Housing statistics quarterly update: December 2021
A summary of activity in new build housing, affordable housing and long term empty properties and second homes in Scotland.
3. All-sector new housebuilding
The new-housebuilding section of this document provides figures on the number of homes started, based on when the foundations are begun, and completed, which is based on when a building inspector deems the property complete.
Figures are presented for homes built on privately led sites (referred to throughout as private sector), local authority led sites (referred to as local authority sector) and housing association led sites (referred to as housing association sector). Social sector housebuilding is the combined total of local authority and housing association builds.
For the private sector the latest information available is for the quarter ending December 2020. Therefore headline findings for new housebuilding across all sectors are presented up to end December 2020, with other figures on social sector housebuilding presented up to end March 2021 where more recent data allows.
The figures have not been seasonally adjusted and so commentary tends to compare the latest 12 month period with the previous 12 month period, or the latest quarter with the same quarter in the previous year. Also note that some of the peaks in the number of starts in Quarter 1 (January to March) each year are generally due to greater numbers of housing association approvals being granted near the end of the financial year.
It should be noted that the amount of all-sector new housebuilding activity recorded in the quarters January to March 2020 and April to June 2020 will have been impacted by the introduction of measures to reduce the spread of the coronavirus (COVID-19) from mid-March to late June, in which non-essential construction activity stopped and home buyers were advised to delay moving to a new home where possible, after which there has been a phased re-start of supply activity.
Chart 1 (see page 1) shows that annual all-sector new build starts and completions (years to end December) have both shown a broadly decreasing direction of trend following the financial crisis in 2008, with starts falling up to 2011 and completions falling up to 2012, after which there have been increases over most years up to 2019. In the latest year to December 2020, starts and completions have decreased by 27% and 35% respectively, with activity levels being affected by the construction and housing market COVID-19 lockdown measures in place between mid March and late June 2020.
Figures for the year to end December 2020
Levels of activity in the two quarters January to March and April to June 2020 were affected by the COVID-19 construction lockdown measures in place between mid-March and late June, with all sectors showing marked decreases in the total number of completions recorded for April to June 2020. Levels of activity recorded in the most recent quarter October to December show increases across all sectors following the decreases seen in the quarter April to June 2020 and the increases recorded in July to September 2020, although overall levels of starts and completions are lower than in the same quarter in the previous year (October to December 2019).
There were 5,177 all-sector completions in October to December 2020, 30% (1,208 homes) more than the 3,969 completions in the previous quarter July to September 2020, and 4,455 homes more than in April to June 2020 when lockdown measures were in place, but 16% (1,008 homes) fewer than the 6,185 homes completed in the same quarter in 2019.
The 3,910 private sector led completions in October to December 2020 is an increase of 30% (912 homes) on the previous quarter, and 3,222 on April to June 2020, but 17% (806 homes) fewer than the 4,716 completions recorded in the same quarter in 2019.
The 537 local authority homes completed in October to December 2020 is an increase of 27% (113 homes) compared with the previous quarter, 503 more homes than in April to June 2020, and 57% (196 homes) higher than the 341 completions seen in October to December 2019.
There were 730 housing association completions in October to December 2020, an increase of 33% (183 homes) on the previous quarter, and 730 more homes than in April to June 2020 (no completions recorded),but 35% (398 homes) fewer homes than the 1,128 completions recorded in the same quarter in 2019. (See Chart 2 below).
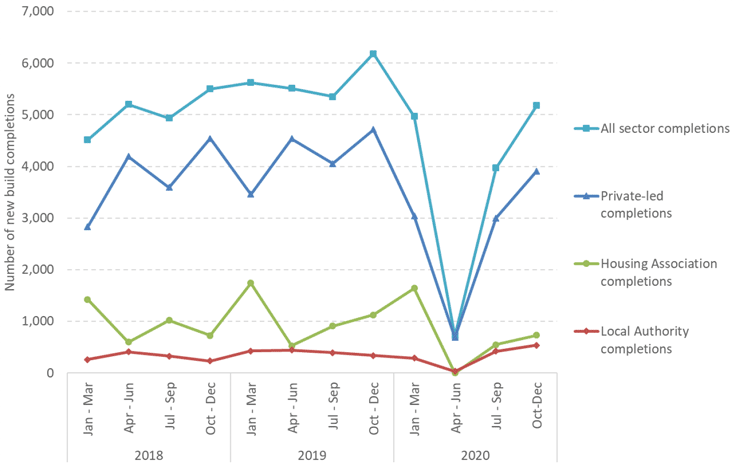
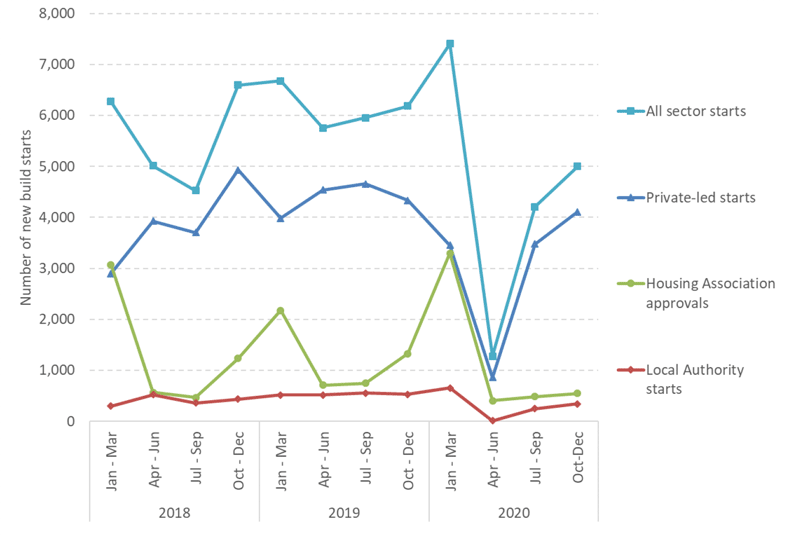
Chart 3 shows quarterly trends in all-sector starts, in which there were 4,996 all-sector homes started in October to December 2020, an increase of 19% (789 homes) compared to the 4,207 homes started in the previous quarter July to September, and 3,719 more than in April to June 2020 when lockdown measures were in place, but a decrease of 19% (1,186) homes compared with October to December 2019.
The 4,110 private sector led starts is an increase of 18% (633 homes) compared with the previous quarter and an increase of 3,250 homes on April to June 2020, but a decrease of 5% (219 homes) compared with the same quarter in 2019.
The 342 local authority homes started in October to December 2020 is an increase of 39% (96 homes) compared to the previous quarter and 329 more homes than in April to June 2020, but a decrease of 35% (186 homes) on the same quarter in 2019.
The 544 housing association approvals in October to December 2020 is an increase
of 12% (60 homes) on the 484 approvals seen in the previous quarter and an increase of 140 homes on the number of approvals in April to June 2020. However, the 544 approvals in October to December 2020 is a decrease of 59% (781 homes) compared with October to December 2019.
Over the 12 months to end December 2020, there were 14,834 all-sector new build homes completed, a drop of 35% (7,839) on the previous year. Over the same period there were 17,883 homes started, a drop of 27% (6,680) on the previous year.
| All sector homes | Starts | Completions |
|---|---|---|
| Quarter Oct to Dec 2017 | 4,412 | 4,136 |
| Quarter Oct to Dec 2018 | 6,596 | 5,503 |
| Quarter Oct to Dec 2019 | 6,182 | 6,185 |
| Quarter Oct to Dec 2020 | 4,996 | 5,177 |
| Change from Q4 2019 to Q4 2020 | -1,186 | -1,008 |
| Change from 2019 to 2020 (%) | -19% | -16% |
| Year to Dec 2017 | 19,463 | 17,450 |
| Year to Dec 2018 | 22,404 | 20,156 |
| Year to Dec 2019 | 24,563 | 22,673 |
| Year to Dec 2020 | 17,883 | 14,834 |
| Change from 2019 to 2020 | -6,680 | -7,839 |
| Change from 2019 to 2020 (%) | -27% | -35% |
Sub-national local authority figures for the year to end December 2020
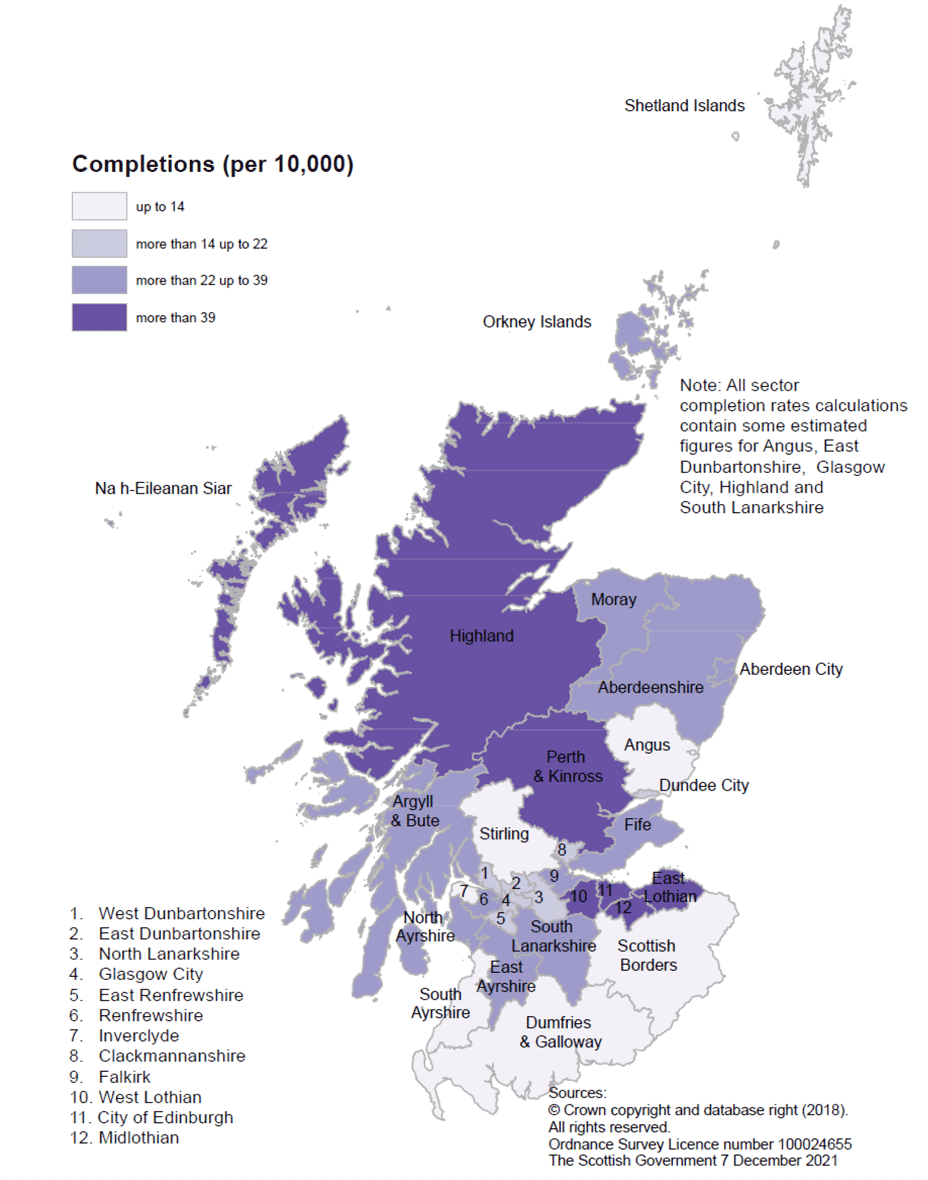
The information on new build housing in Scotland is collected and published at local authority level. Map A, below, shows new housebuilding in the year to end December 2020, as a rate per 10,000 population based on the latest mid-2020 population estimates.
It should be noted that the rates of all-sector new housebuilding activity recorded will have been impacted by the introduction measures to reduce the spread of the coronavirus (COVID-19) from mid-March to late June 2020.
In the year to end December, the highest new build rates were observed in East Lothian, Midlothian, Perth & Kinross, Na h-Eileanan Siar, West Lothian and Highland. The lowest rates were observed in Stirling, South Ayrshire, Shetland Islands, Dumfries & Galloway, Inverclyde, Scottish Borders and Angus.
Note that the all-sector completion rates calculations contain some estimated figures. Estimated figures have been used for private sector completions for East Dunbartonshire Council for the period January to December 2020 and Angus Council, Glasgow Council and South Lanarkshire Council for the period October to December 2020. Estimated figures have also been used for Highland Council local authority sector figures in October to December 2020.
Comparison with the rest of the UK from 2007 to 2021
Each of the countries of the UK produces their own statistics on quarterly new build housing starts and completions by tenure, and all use broadly consistent definitions. The quarterly new build statistics for each of the countries of the UK are brought together in the UK House building update section of the ONS website.
In addition to this, the Ministry of Housing, Communities and Local Government (MHCLG) also produces an additional annual set of statistics for England on new build homes, as a component part of the 'Housing supply; net additional dwellings, England' set of statistics[2]. These statistics are collected on a different basis to the quarterly UK country statistics as local authorities can use a range of data sources to collate these figures, rather than solely using building control information. Latest figures on this for 2019/20 were published in November 2020, and the publication advised that the 'net additional dwellings' should be considered the primary and most comprehensive measure of housing supply in England.
MHCLG have advised that the quarterly new build statistical collection for England, whilst being a useful leading indicator of activity throughout the year, is not currently capturing all new build activity. This is largely due to difficulties in collecting accurate starts and completions data from independent building inspectors or where building control has been sourced out to strategic partnerships or the private sector. These data issues do not exist in the Scotland quarterly housing statistics, given that all of the 32 local authorities in Scotland directly manage building control and the associated provision of data to the Scottish Government on starts and completions.
As a result of this advice from MHCLG, the new build component figures of the 'net additional dwellings' statistics for England are included in the UK comparisons as an additional set of figures to consider when comparing between countries on a financial year basis.
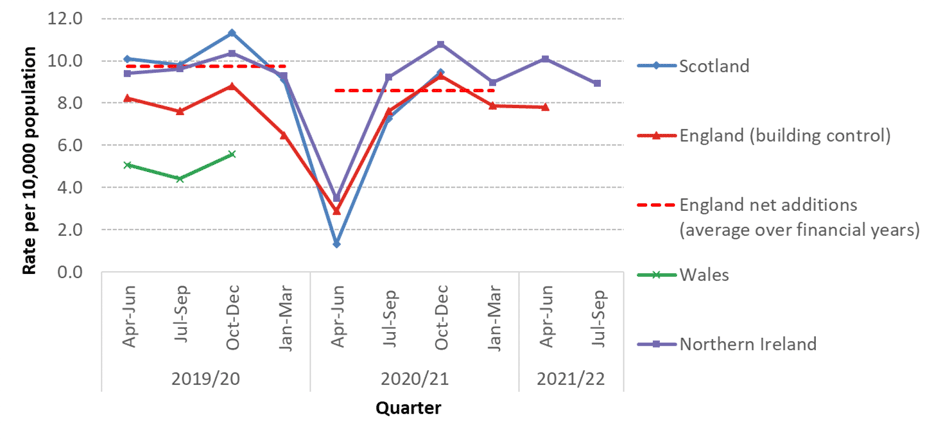
Chart 4a presents trends in the rates of new house building per 10,000 population across each of the UK countries on a financial year basis (years to end March) to allow for comparisons with both the England financial year 'net additional dwelling' statistics and financial year rates derived from each of the quarterly UK series. This shows that whilst Scotland had a higher rate of completions per 10,000 head of population than England over the period 2006/07 to 2013/14, that Scotland and England have seen broadly similar rates of housebuilding each year across the period 2014/15 to 2019/20, when comparing the Scotland figures to the England net addition figures.
In the financial year 2019/20, the 40 homes built per 10,000 population in Scotland was similar to the rates seen in England (net additional dwellings figures) and Northern Ireland (both 39 homes per 10,000).
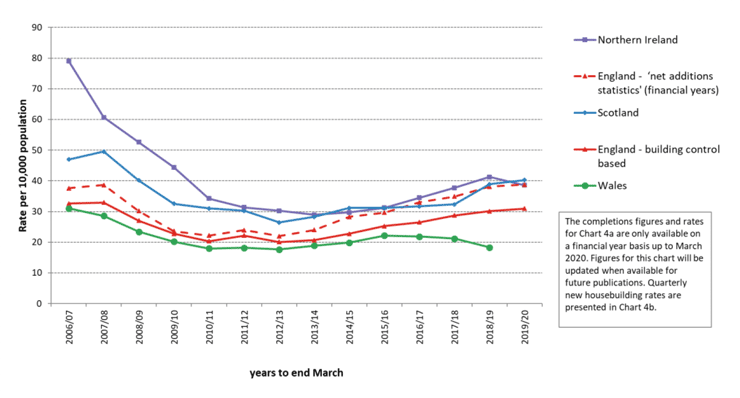
Chart 4b presents more recent trends in the rates of new housebuilding per 10,000 population across each of the UK countries on a quarterly basis, based on the latest published information available for each country.[3]
The England 'net additional dwelling' figure for the financial year 2019/20 is also included as an average across each of the quarters within this year, to help demonstrate the difference in the relative level between this figure and the separate quarterly England building control based figures.
The chart shows the clear impact of COVID-19 lockdown restrictions on construction activity in the quarter April to June 2020, with the rates of new housebuilding per 10,000 population dropping compared to the same in quarter in the previous year by 87% in Scotland, 65% in England (building control based figures), and 63% in Northern Ireland, which may reflect stricter lockdown restrictions for Scottish housing building compared to England and Northern Ireland.
Following this, the rates of new housebuilding in each of these countries have subsequently increased back up to higher levels in the July to September and October to December 2020 quarters, although there have been slight decreases in England and Northern Ireland since then.