Housing Statistics for Scotland Quarterly Update: New Housebuilding and Affordable Housing Supply (published 24 January 2023)
A summary of activity in new build housing, affordable housing and long term empty properties and second homes in Scotland.
5. Social sector new housebuilding
Social sector housing consists of local authority and housing association housing, and has accounted for around a third (29%) of all new build homes completed over the 12 months to the end of June 2022.
Chart 8a shows the number of local authority and housing association homes started and completed each year to end June. In 2009 to 2011 the number of housing association completions were between 5,200 and 5,400 each year, after which the number of homes completed dropped until reaching a low of just over 2,500 in 2017, after which completions increased to just over 4,000 in 2019. Housing association completions then dropped to around 3,100 in 2021, with completions in this year being affected by COVID-19 lockdown measures, before increasing again to almost 3,800 in the year to end June 2022.
Housing association new build approvals fell between 2009 and 2013, to a low of around 2,000, before trending up to over 5,700 in 2020. This then fell to around 2,700 in 2021, and then in the 12 months ending June 2022, rose slightly to almost 2,800.
The number of local authority homes built gradually increased from around 400 homes in 2009 up to just over 1,200 in 2012 (years to end June). Completions then remained stable until 2016, then increased to around 1,400 in 2019. Completions fell to almost 1,100 in 2020 before increasing to almost 2,000 in 2021 and then just over 2,500 in the year to end June 2022. Local authority new build starts have followed a generally similar pattern to that of completions, although the number of starts in the latest year is lower at around 1,700 in 2022.
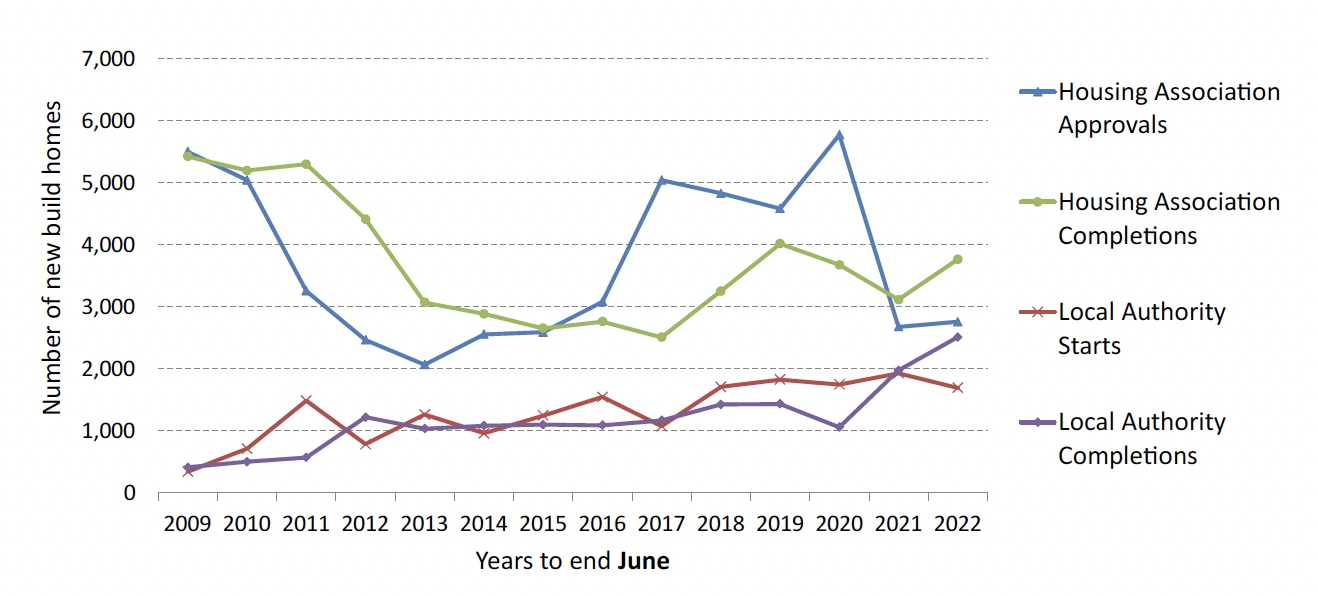
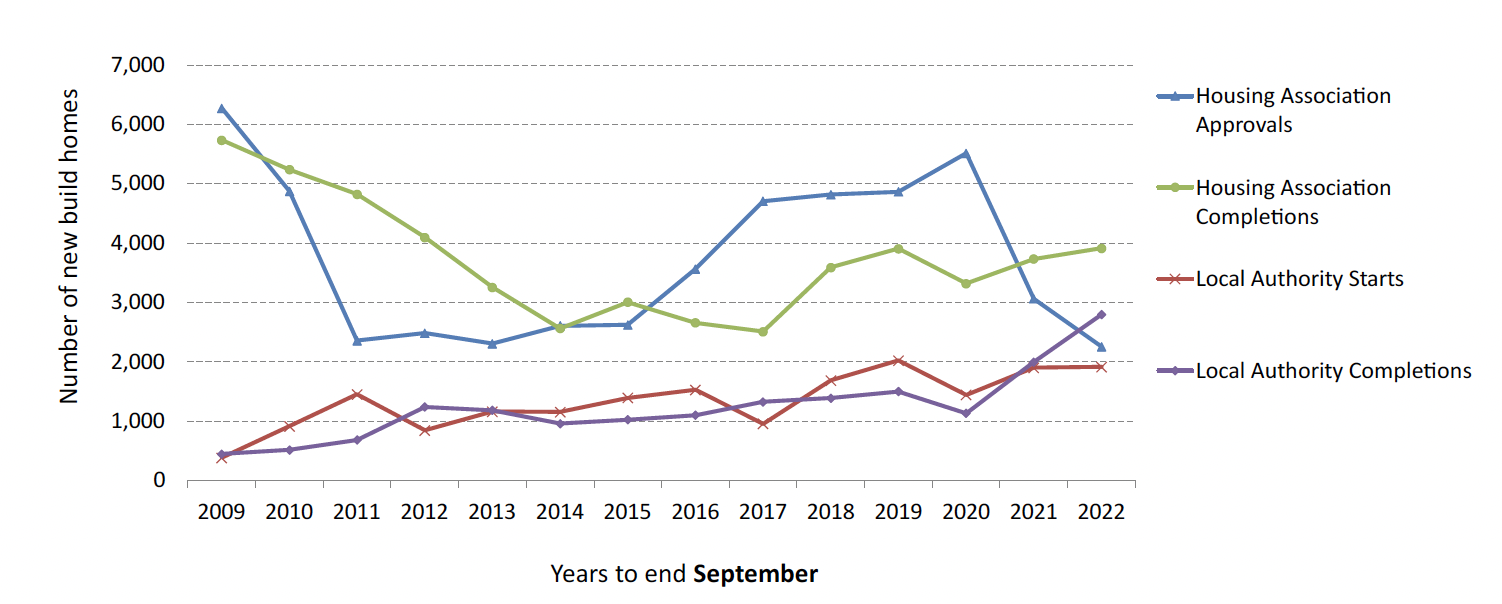
Chart 8b below shows the same figures but for years to end September.
| Social sector homes | Total Social starts | Total Social completions | Local authority starts | Local authority completions | Housing association approvals | Housing association completions |
|---|---|---|---|---|---|---|
| Apr - Jun 2019 | 1,220 | 975 | 513 | 446 | 707 | 529 |
| Apr - Jun 2020 | 417 | 34 | 13 | 34 | 404 | 0 |
| Apr - Jun 2021 | 904 | 1,305 | 584 | 555 | 320 | 750 |
| Apr - Jun 2022 | 753 | 1,023 | 336 | 360 | 417 | 663 |
| Change | -151 | -282 | -248 | -195 | 97 | -87 |
| Change (%) | -17% | -22% | -42% | -35% | 30% | -12% |
| Year to Jun-19 | 6,407 | 5,445 | 1,823 | 1,430 | 4,584 | 4,015 |
| Year to Jun-20 | 7,518 | 4,731 | 1,745 | 1,056 | 5,773 | 3,675 |
| Year to Jun-21 | 4,600 | 5,084 | 1,925 | 1,970 | 2,675 | 3,114 |
| Year to Jun-22 | 4,446 | 6,275 | 1,691 | 2,510 | 2,755 | 3,765 |
| Change | -154 | 1,191 | -234 | 540 | 80 | 651 |
| Change (%) | -3% | 23% | -12% | 27% | 3% | 21% |
A total of 1,023 social sector new build homes were completed between April to June 2022, a decrease of 22% (282 homes) on the same quarter in 2021. This brings the total completions for the 12 months to end June 2022 to 6,275, an increase of 23% (1,191 homes) on the 5,084 social sector new build homes completed in the previous year.
Meanwhile, 753 social sector new build homes were started between April to June 2022. This is 17% (151 homes) lower than the same quarter the previous year. This brings the total for the 12 months to end June 2022 to 4,446, a decrease of 3% (154 homes) on the 4,600 social sector homes started in the same period in 2021.
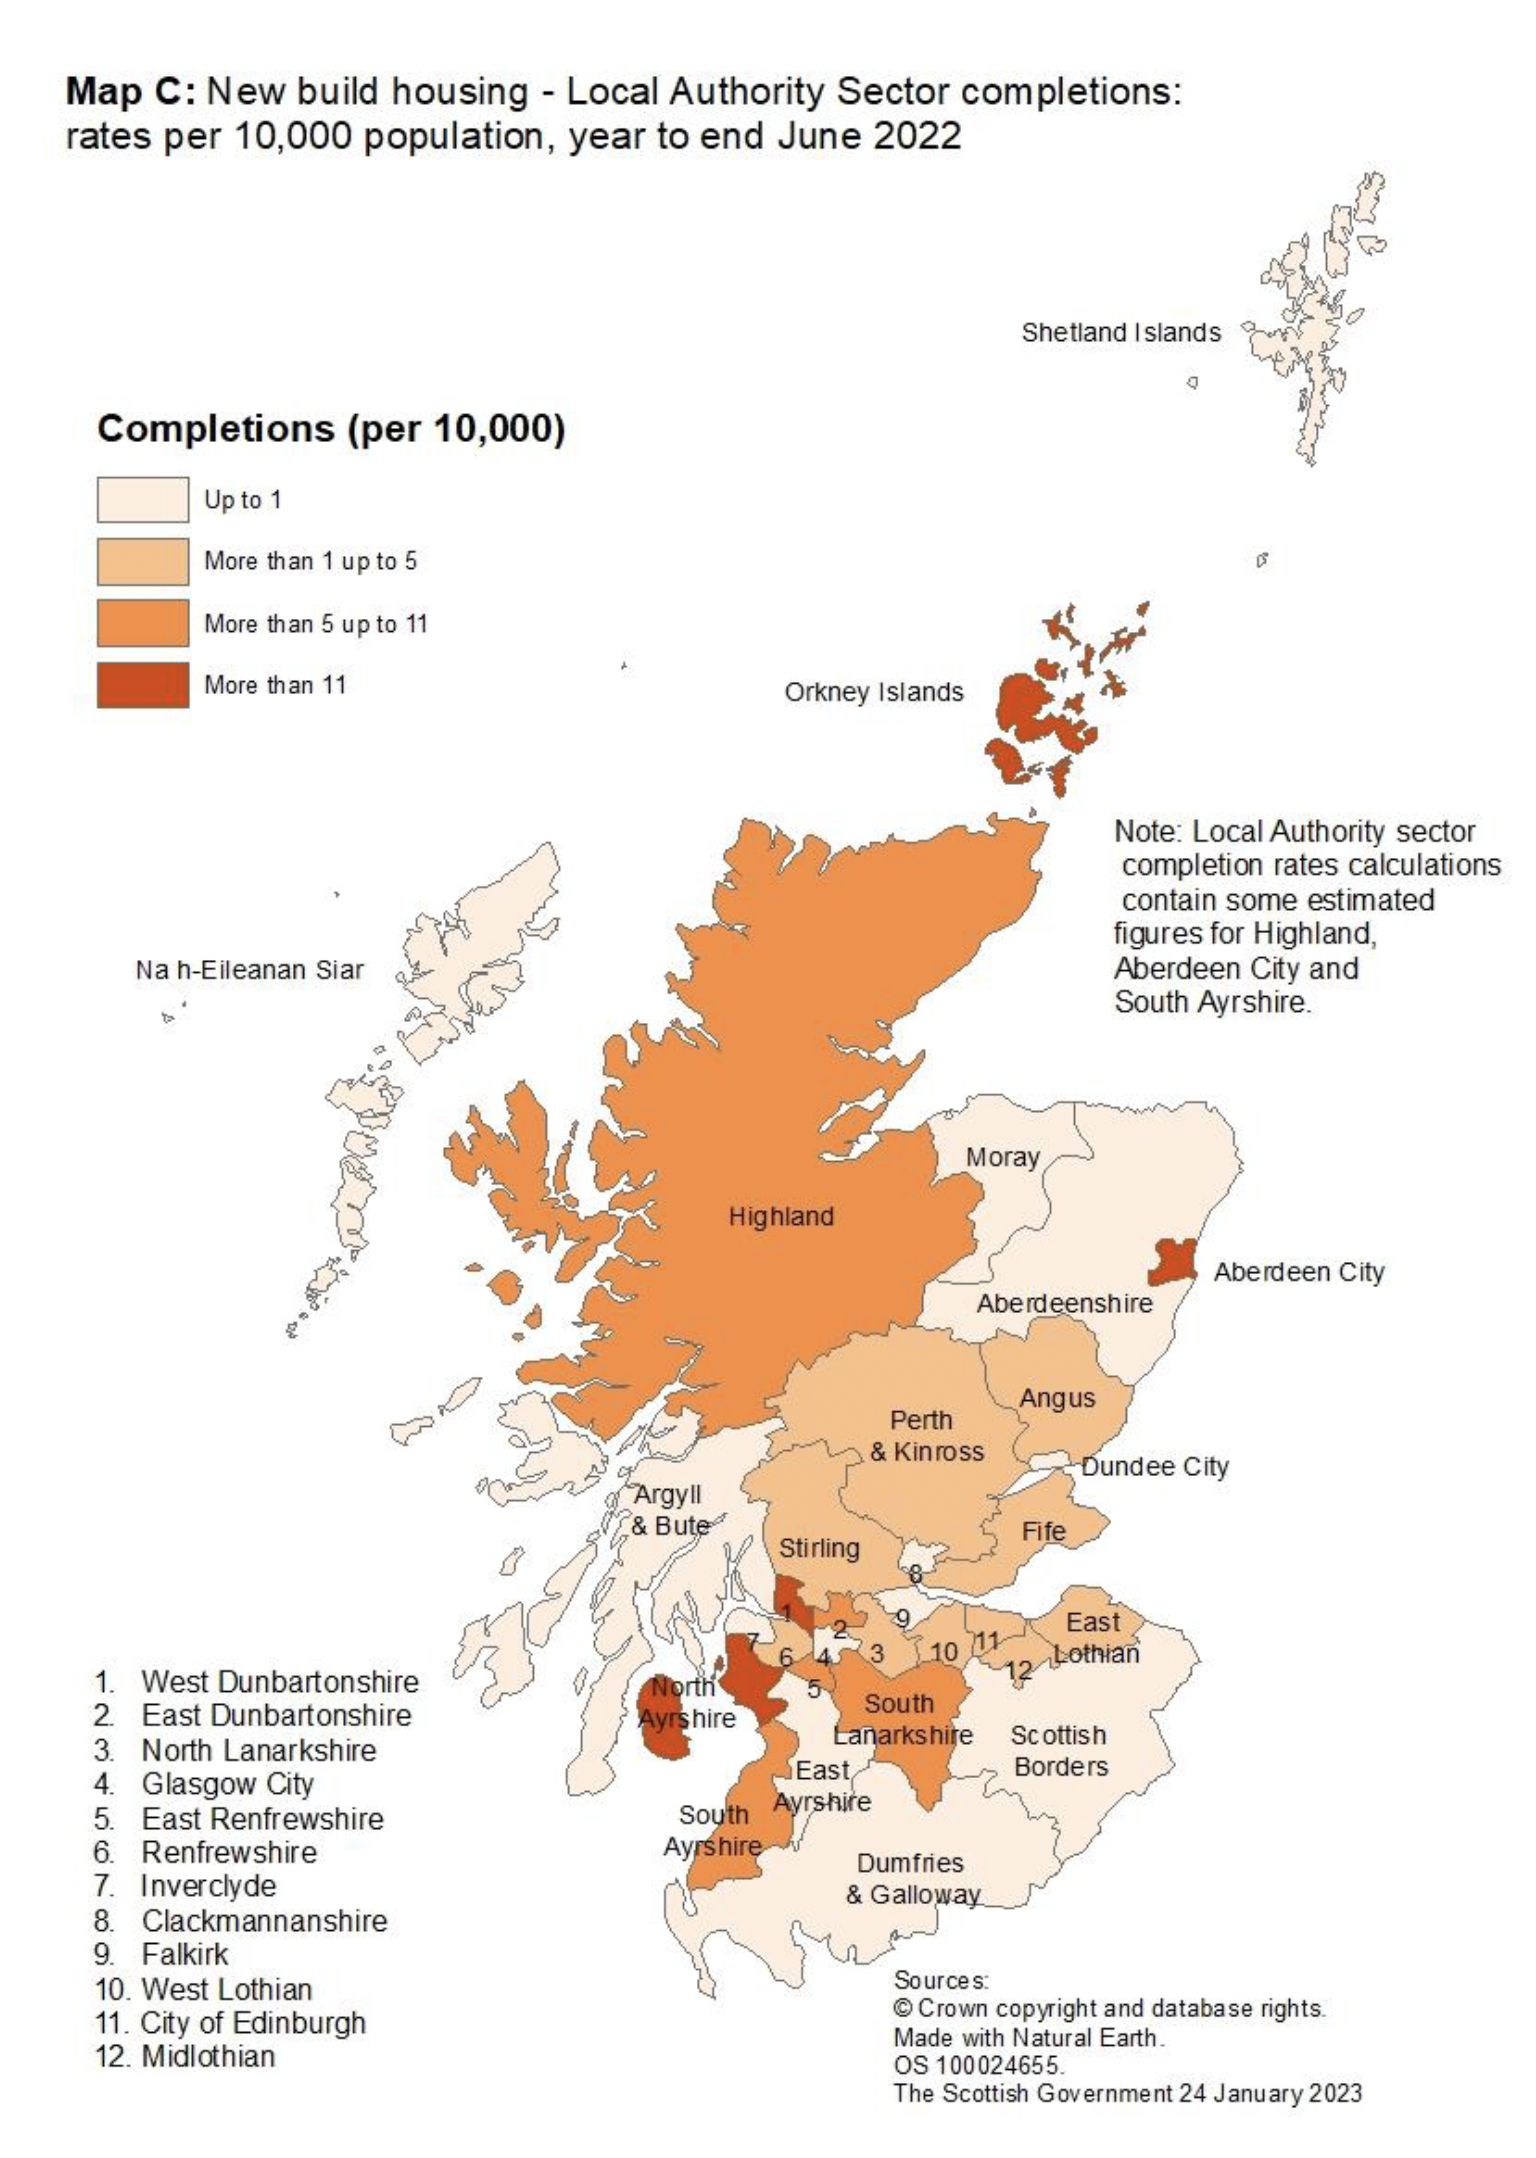
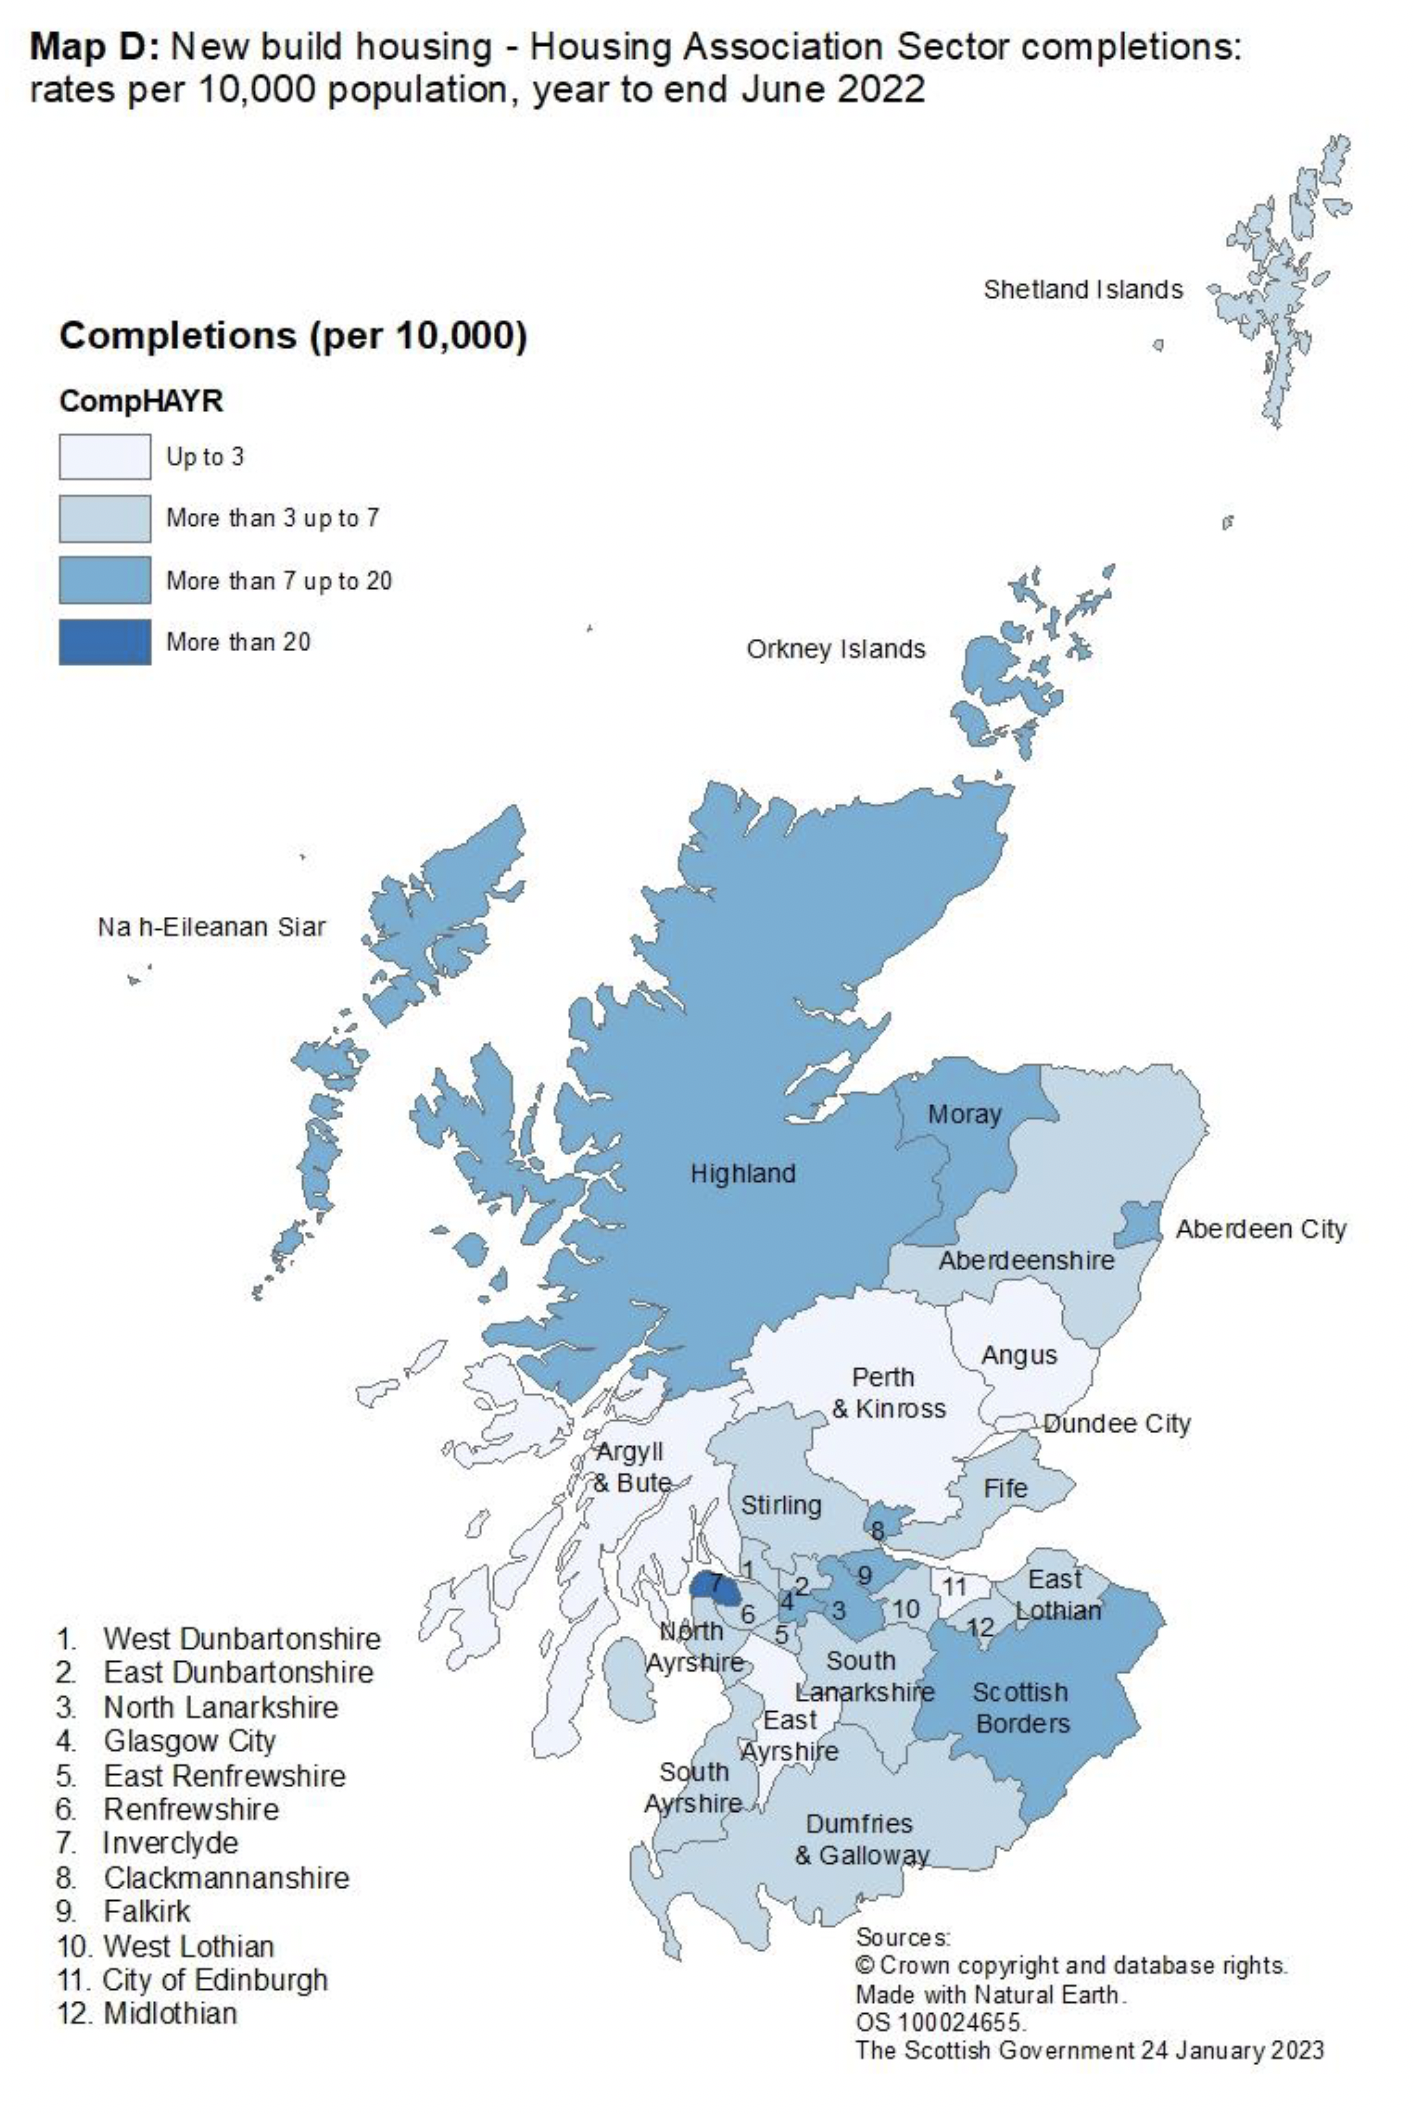
Maps C and D show the rates of housing association and local authority new build completions in each local authority for the year to end June 2022 per 10,000 of the population. The housing stock of 6 local authorities (Argyll & Bute, Dumfries & Galloway, Glasgow, Inverclyde, Na h-Eileanan Siar and Scottish Borders) has been transferred to housing associations and so these areas do not build new local authority houses.
In the year to end June 2022 local authority new build rates were highest in Aberdeen City, Orkney Islands, West Dunbartonshire, and North Ayrshire, with rates over 11 homes per 10,000 households. As well as the 6 stock transfer authorities mentioned above, Aberdeenshire, Clackmannanshire, Dundee City, East Ayrshire, Moray, and the Shetland Islands built no new local authority homes in the year ending June 2022. Falkirk had a rate of less than 1 house built per 10,000 households.
Meanwhile rates of housing association new build completions were highest in Inverclyde with rates of over 20 homes per 10,000 households. East Ayrshire, Dundee City, Argyll & Bute, Edinburgh City, Angus, and Perth & Kinross had a rate less than 3 homes per 10,000 households.
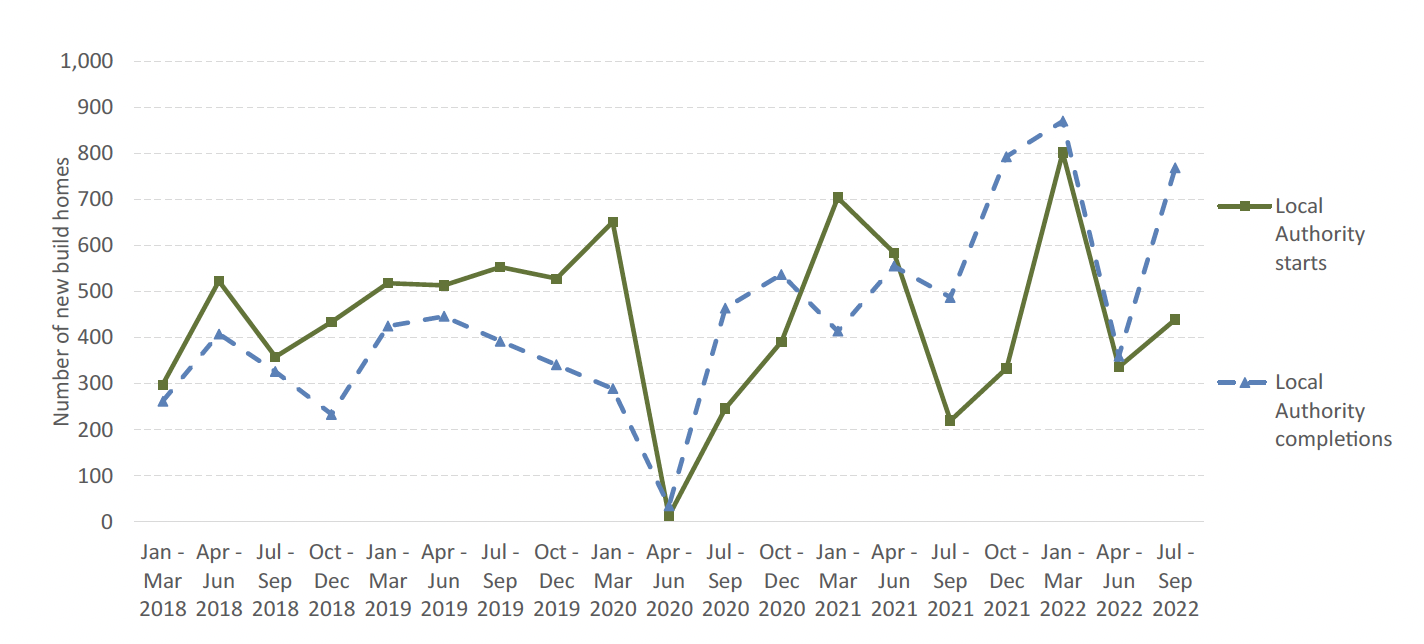
Charts 9 and 10 along with Table 5 show the latest quarterly figures for housing associations and local authorities to end September 2022.
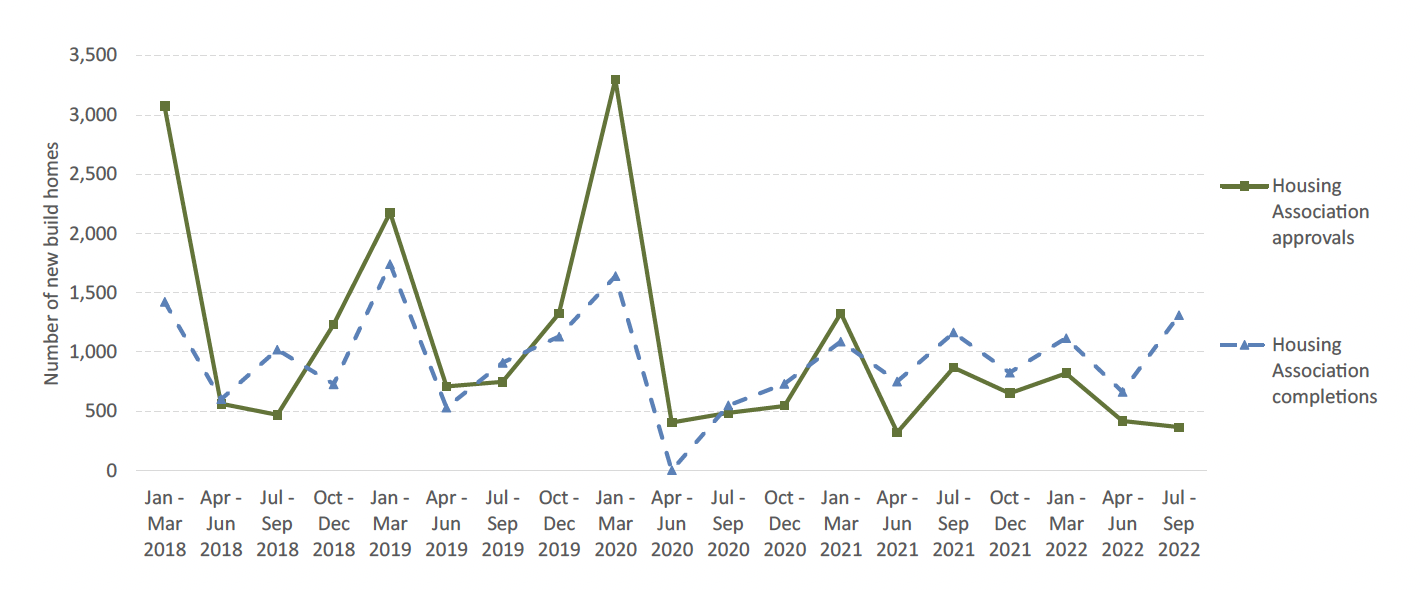
A total of 2,078 social sector new build homes were completed between July to September 2022, an increase of 26% (429 homes) on the 1,649 completions in the same quarter in 2021. This brings the total completions for the 12 months to end September 2022 to 6,704, an increase of 17% (982 homes) on the 5,722 social sector new build homes completed in the previous year.
Meanwhile, 803 social sector new build homes were started between July to September 2022. This is a decrease of 26% (285 homes) compared to the same quarter in the previous year. This brings the total for the 12 months to end September 2022 to 4,161, a decrease of 16% (797 homes) on the 4,958 social sector homes started in the same period in 2021.
In the year to end September 2022, housing association new build completions are up by 5% (183 homes), local authority new build completions are up by 40% (799 homes) and housing association new build approvals are down by 26% (808 homes), whilst local authority new build starts have increased slightly by 11 homes (1%).
| Social sector homes | Total Social starts | Total Social completions | Local authority starts | Local authority completions | Housing association approvals | Housing association completions |
|---|---|---|---|---|---|---|
| Jul - Sep 2019 | 1,299 | 1,300 | 553 | 392 | 746 | 908 |
| Jul - Sep 2020 | 730 | 1,011 | 246 | 464 | 484 | 547 |
| Jul - Sep 2021 | 1,088 | 1,649 | 220 | 487 | 868 | 1,162 |
| Jul - Sep 2022 | 803 | 2,078 | 439 | 769 | 364 | 1,309 |
| Change | -285 | 429 | 219 | 282 | -504 | 147 |
| Change (%) | -26% | 26% | 100% | 58% | -58% | 13% |
| Year to Sep-19 | 6,880 | 5,401 | 2,018 | 1,496 | 4,862 | 3,905 |
| Year to Sep-20 | 6,949 | 4,442 | 1,438 | 1,128 | 5,511 | 3,314 |
| Year to Sep-21 | 4,958 | 5,722 | 1,899 | 1,993 | 3,059 | 3,729 |
| Year to Sep-22 | 4,161 | 6,704 | 1,910 | 2,792 | 2,251 | 3,912 |
| Change | -797 | 982 | 11 | 799 | -808 | 183 |
| Change (%) | -16% | 17% | 1% | 40% | -26% | 5% |