Housing Statistics for Scotland Quarterly Update: New Housebuilding and Affordable Housing Supply (published 24 January 2023)
A summary of activity in new build housing, affordable housing and long term empty properties and second homes in Scotland.
2. All-sector new housebuilding
Chart 1 on page 1 shows that annual all-sector new build starts and completions in the years to end June both showed a broadly decreasing direction of trend following the financial crisis in 2008. Starts fell to a low in 2011 and completions reached their lowest point in 2013. Following this, starts and completions then generally increased year on year up to the year ending June 2019. Starts and completions then dropped in the year to end June 2020 due to the impact of COVID-19 lockdown measures in the quarter April to June 2020, before both increasing again in the year to end June 2021.
In the latest year to end June 2022, completions have increased by 9% to stand at 21,825 homes. Starts have decreased by 13% in the year to end June 2022 to 19,060 homes. Private-led completions rose by 4% (615 homes), local authority completions increased by 27% (540 homes), and housing association completions rose by 21% (651 homes). Private-led starts fell by 15% (2,611 homes) and local authority starts decreased by 12% (234 homes), whilst housing association approvals rose by 3% (80 homes).
Note that previous estimates for private led new housebuilding starts and completions in Glasgow for the period Q2 2020 to Q1 2022 have now been replaced by figures based on data provided by Glasgow City Council for all-sector figures across this period, from which we have derived the private-led component by netting off social sector starts and completions. This has had the effect of decreasing the number of starts by 21 and increasing the number of completions by 1,599 over the full period of 8 quarters, although year on year trends across these two financial years are affected by a lesser extent. Further details are provided in Section 8.
Chart 2 below presents the latest quarterly trends in completions to end June 2022, in which there were 5,319 all-sector completions in the latest quarter April to June 2022, an increase of 5% (245 homes) on the 5,074 completions in the same quarter in 2021.
The 4,296 private sector led completions in April to June 2022 is an increase of 14% (527 homes) on the 3,769 completions in the same quarter in 2021.
The 360 local authority completions in April to June 2022 is represents a decrease of 35% (195 homes) on the 555 completions in the same quarter in 2021.
Meanwhile the 663 housing association completions in April to June 2022 is an decrease of 12% (87 homes) on the 750 completions in the same quarter in 2021.
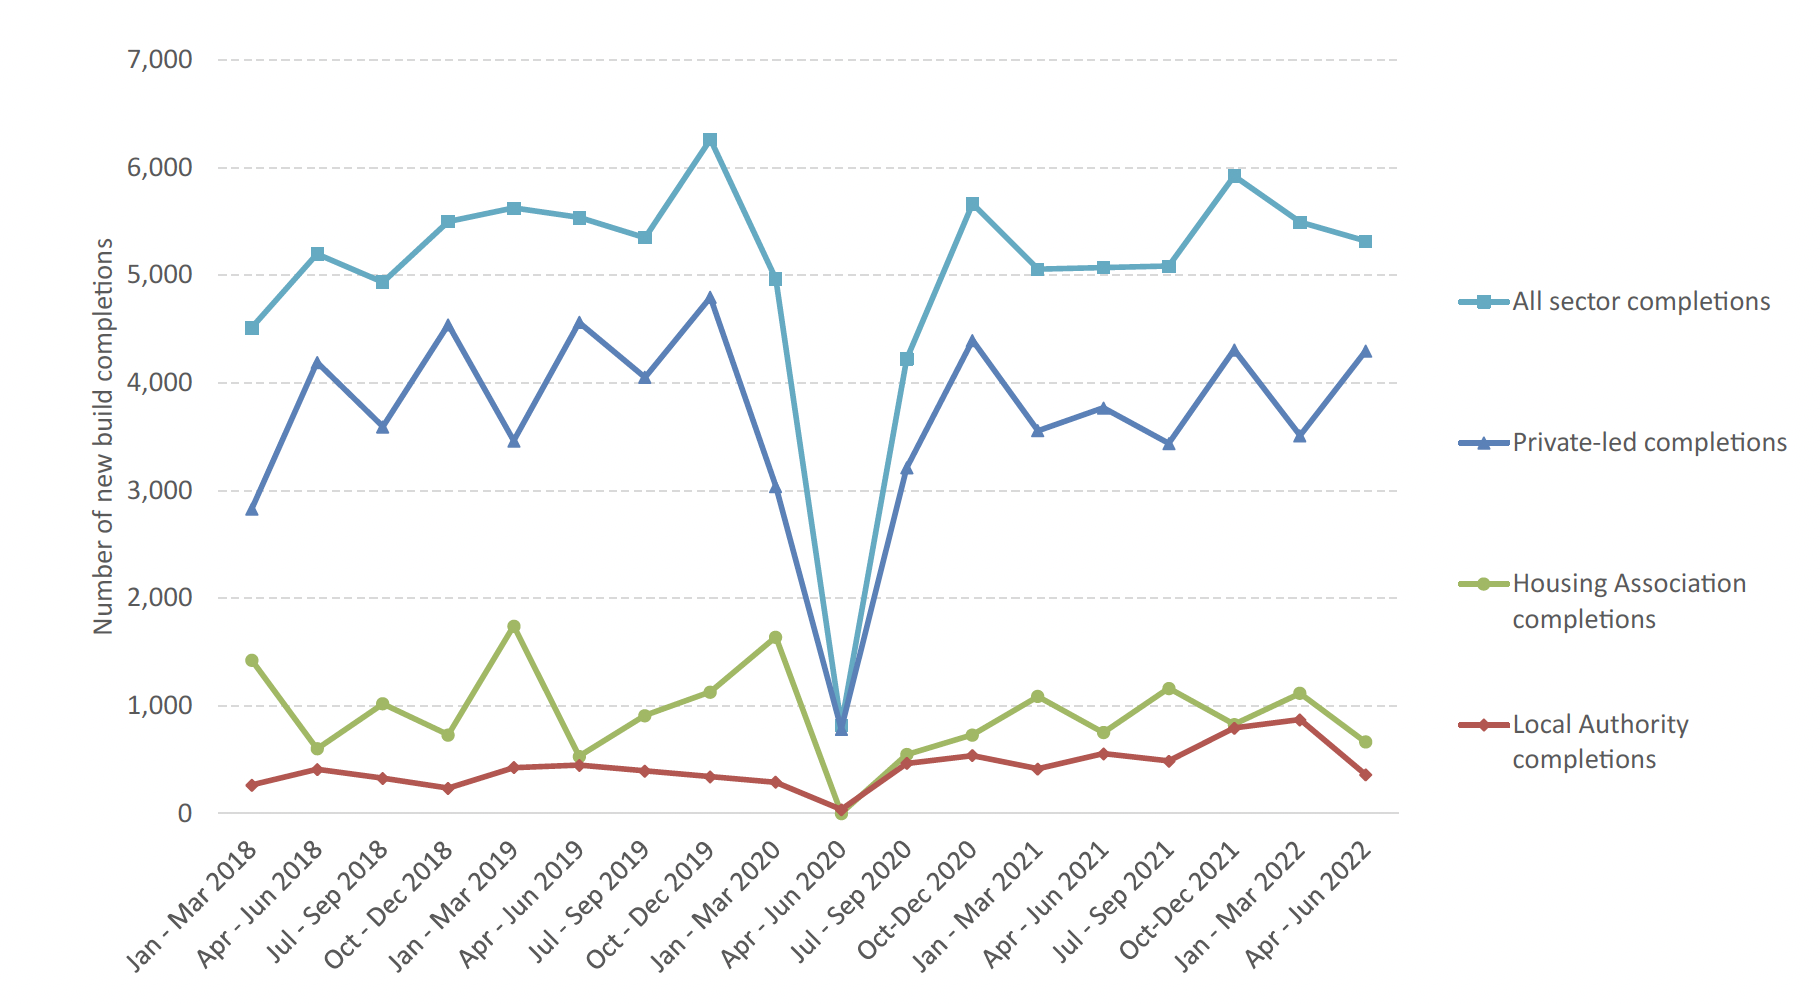
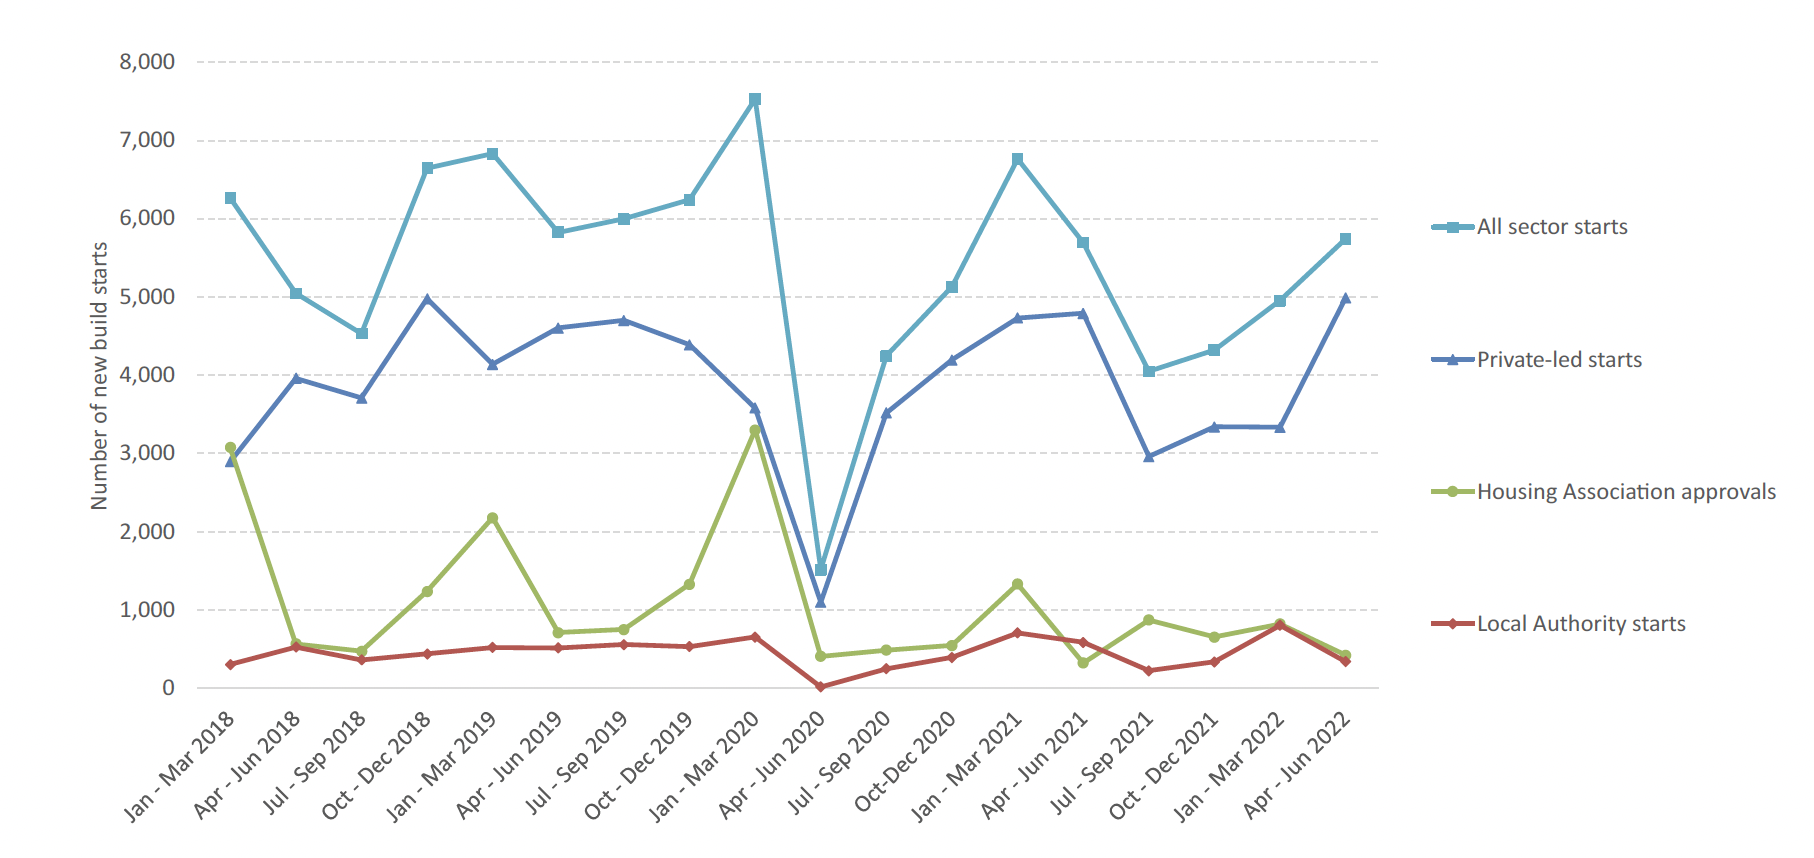
Chart 3 shows the equivalent quarterly trends in starts, in which there were 5,740 all-sector starts in the latest quarter April to June 2022. This is an increase of 1% (48 homes) on the 5,692 starts in the same quarter in 2021.
The 4,987 private sector led starts in April to June 2022 is an increase of 4% (199 homes) on the 4,788 starts in the same quarter in 2021.
The 336 local authority starts in April to June 2022 is a decrease of 42% (248 homes) on the 584 starts in the same quarter in 2021.
Meanwhile the 417 housing association approvals in April to June 2022 is an increase of 30% (97 homes) on the 320 approvals in the same quarter in 2021.
| All sector homes | Starts | Completions |
|---|---|---|
| Quarter Apr to Jun 2019 | 5,822 | 5,538 |
| Quarter Apr to Jun 2020 | 1,513 | 816 |
| Quarter Apr to Jun 2021 | 5,692 | 5,074 |
| Quarter Apr to Jun 2022 | 5,740 | 5,319 |
| Change from Q2 2021 to Q2 2022 | 48 | 245 |
| Change from Q2 2021 to Q2 2022 (%) | 1% | 5% |
| Year to Jun 2019 | 23,826 | 21,605 |
| Year to Jun 2020 | 21,277 | 17,402 |
| Year to Jun 2021 | 21,825 | 20,019 |
| Year to Jun 2022 | 19,060 | 21,825 |
| Change from 2021 to 2022 (%) | -2,765 | 1,806 |
| Change from 2021 to 2022 (%) | -13% | 9% |
Note that new housebuilding starts and completions in April to June 2020 were affected by the impact of the COVID-19 lockdown measures that were in place during that quarter.
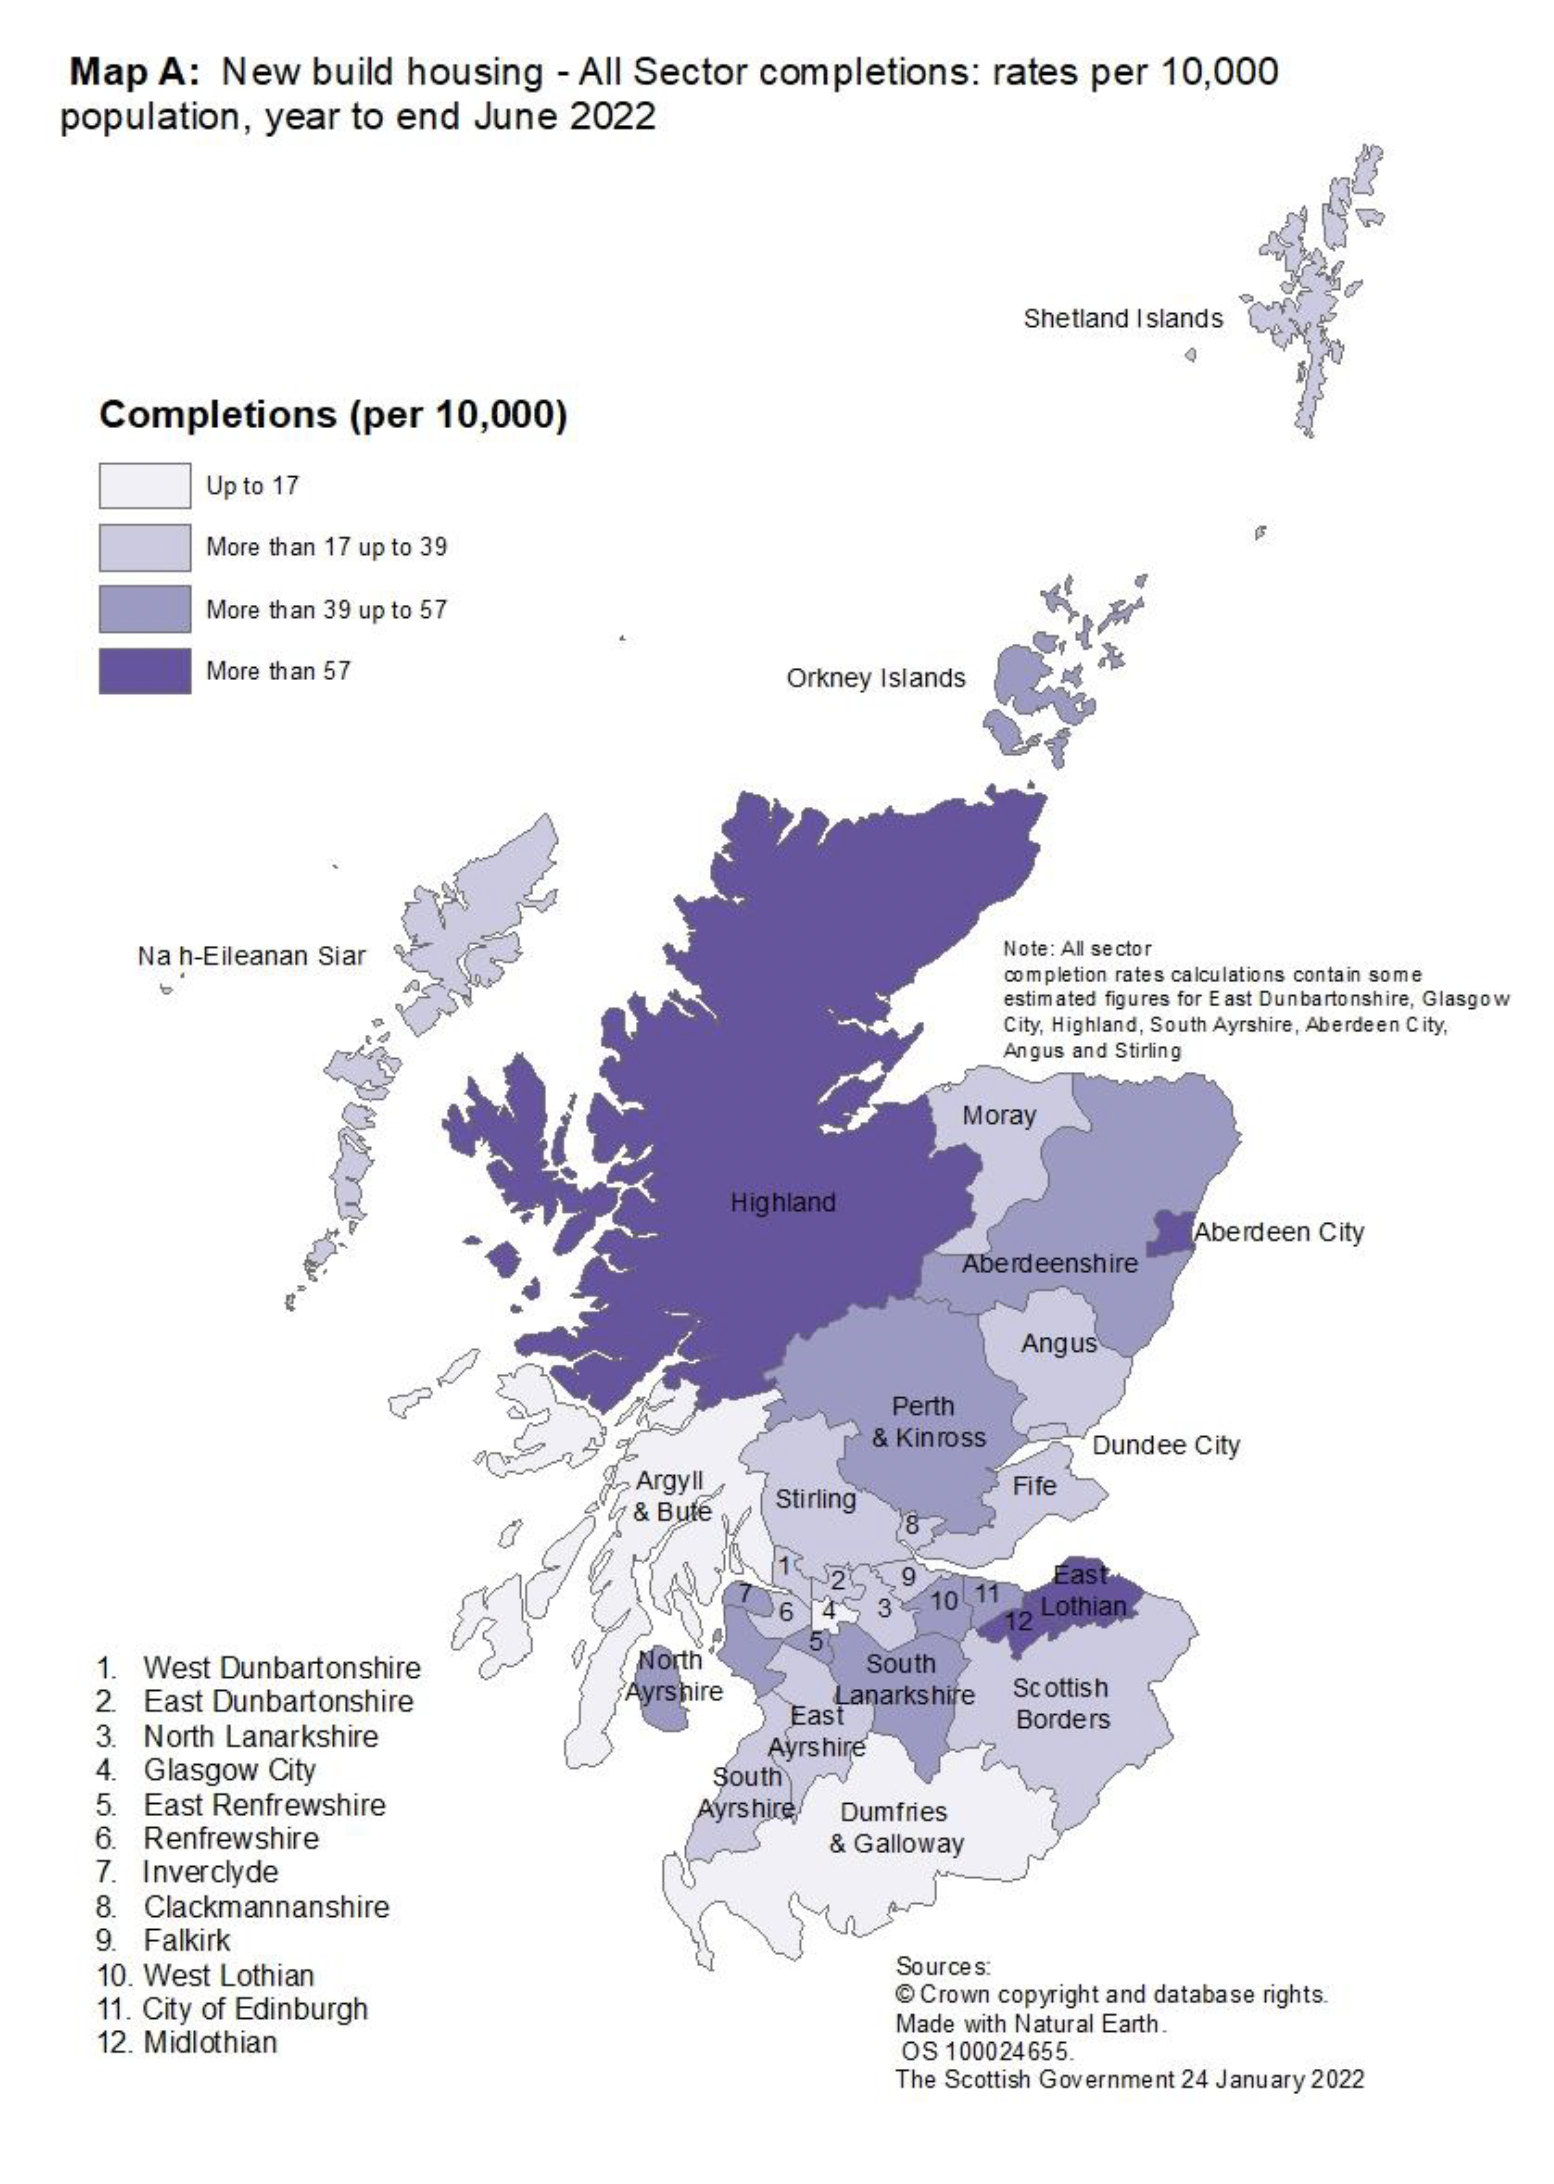
Map A below shows that in the year to end June 2022, the highest new build rates were observed in the local authority areas of Midlothian, Aberdeen City, Highland, and East Lothian which had rates of more than 57 homes per 10,000 population.
The lowest rates were observed in Argyll & Bute, Dumfries & Galloway and Glasgow City, which had rates of 17 homes or fewer per 10,000 population.
Note that the all-sector completion rates calculations contain some estimated figures. Estimated figures have been used for private sector completions for Glasgow City Council from April to June 2021, East Dunbartonshire and South Ayrshire from October to December 2021, Stirling from January to March 2022 and Aberdeen City and Angus for April to May 2022. Local authority completions are estimated for Highland from April to June 2021, and Aberdeen City and South Ayrshire from January to March 2022.
New housebuilding across UK countries
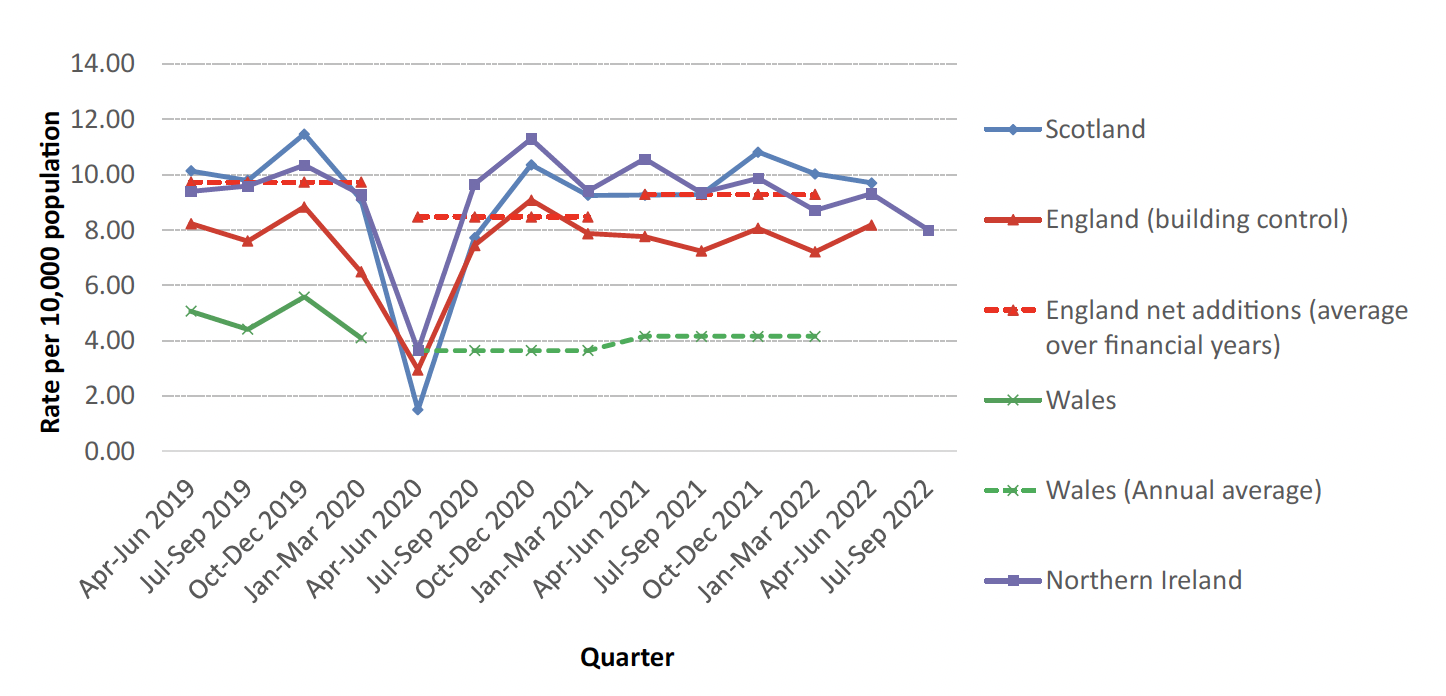
Chart 4a presents trends in the rates of all-sector new housebuilding completions per 10,000 population across each of the UK countries on a financial year basis (years to end March) to allow for comparisons with both the England financial year 'net additional dwelling' statistics and financial year rates derived from each of the quarterly UK series.
The England financial year 'net additional dwellings' series is considered the primary and most comprehensive measure of housing supply in England. The quarterly new build statistical collection for England based on building control is not currently capturing all new build activity, and so is seen more as a leading indicator of activity throughout the year.
The chart shows that whilst Scotland had a higher rate of completions per 10,000 head of population than England ('net additional dwellings' series) over the period 2006/07 to 2013/14, that Scotland and England have seen broadly similar rates of housebuilding each year across the period 2014/15 to 2021/22, with the exception of 2020/21 in which Scotland saw a sharper fall, possibly due to the stricter COVID-19 lockdown restrictions that were in place for housing building in Scotland.
Figures for 2021/22 show that in in all four nations, the completions rate increased from the previous year, with Scotland having the largest increase, up to 39 homes per 10,000 population. This rate for 2021/22 is similar to the rate of 39 per 10,000 in Northern Ireland, and the rate of 37 in England ('net additional dwellings' series), and is above the rate of 17 in Wales.
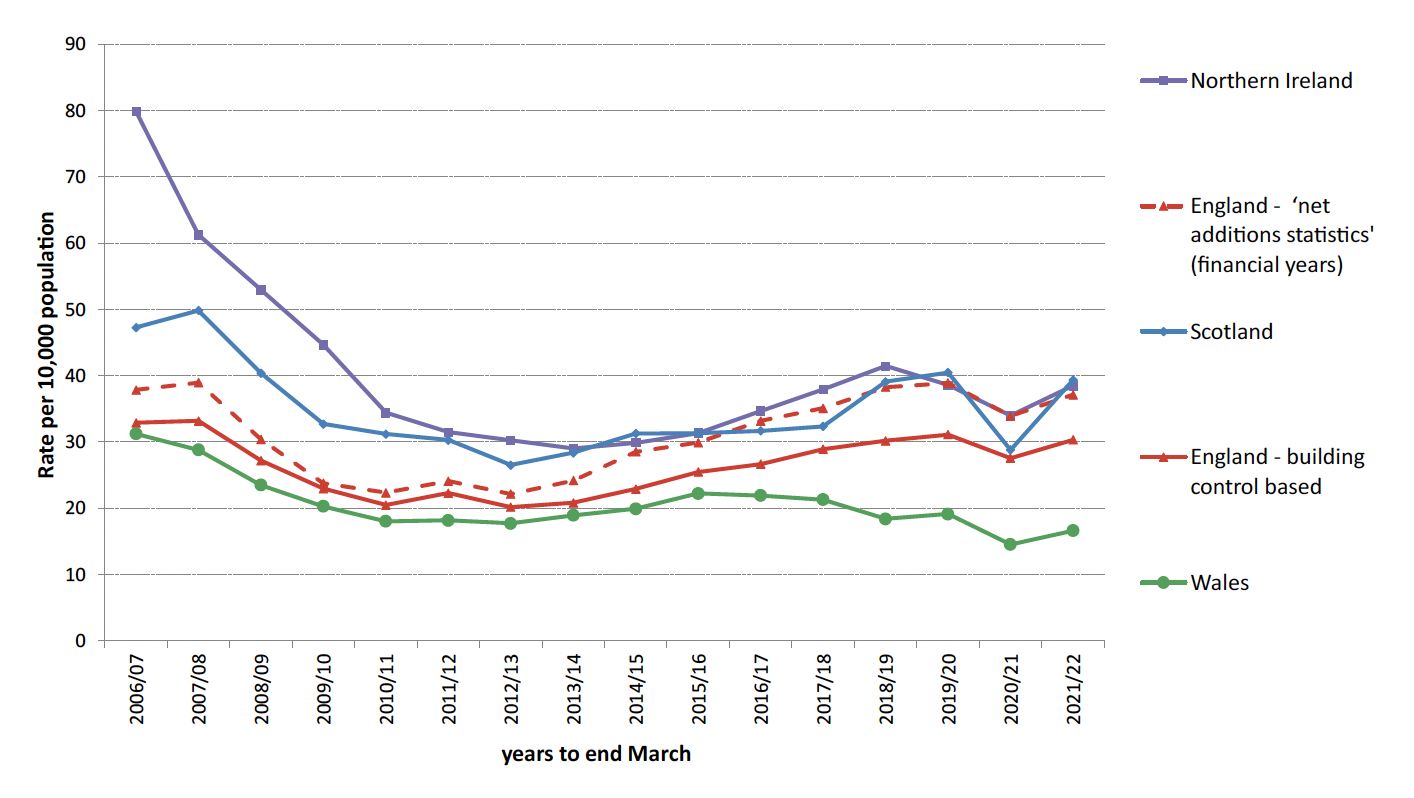
Chart 4b presents more recent trends in the rates of new housebuilding completions per 10,000 population across each of the UK countries on a quarterly basis[1], based on the latest published information available for each country. The England 'net additional dwelling' figures for the financial years 2019/20, 2020/21 and 2021/22 are also included as averages across each of the quarters within these years, to help demonstrate the difference in the relative level between this figure and the separate quarterly England building control based figures.
The chart shows the clear impact of COVID-19 lockdown restrictions on construction activity in the quarter April to June 2020, with the rates of new housebuilding per 10,000 population dropping compared to the same quarter in the previous year by 85% in Scotland, 64% in England (building control based figures), and 61% in Northern Ireland, which may reflect stricter lockdown restrictions for Scottish housing building compared to England and Northern Ireland.
Following this, the rates of new housebuilding in each of these countries subsequently increased back up to higher levels, although the quarterly rates for England and Northern Ireland have shown a slight downward trend over the quarters following the October to December 2020 quarter, until the rate in England rose between in April to June 2022 to the highest value since October to December 2020. The rate in Scotland has shown a more steady trend.