Health and Care Experience Survey: results 2019/2020
Results from the 2019/2020 Health and Care Experience Survey
6. Out of Hours Healthcare
NHS services contacted when the GP practice was closed
In the last twelve months seventeen per cent of people contacted an NHS service when they wanted to see a GP but the GP practice was closed. Note, the results are not comparable with those from last year's survey as the wording of question has been revised. The question last year incorporated those who had used an Out of Hours Service (OOH) service when their GP practice was open.
Respondents were asked which service they received most of their treatment or advice from and Figure 6.1 shows thirty nine per cent of people received phone advice only from NHS24 (111), twenty one per cent received treatment or advice from GP out of Hours Services and seventeen per cent from A&E or Minor Injuries Units.
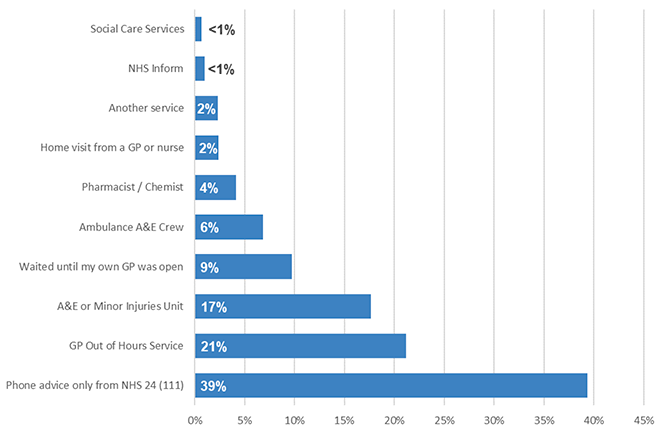
Figure 6.2 shows that around three quarters of people treated or advised by an Out of Hours service phoned NHS24 (111) when their GP practice was closed before receiving their treatment.
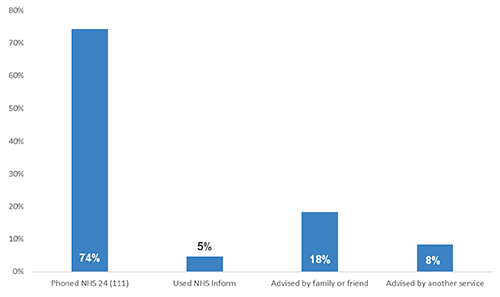
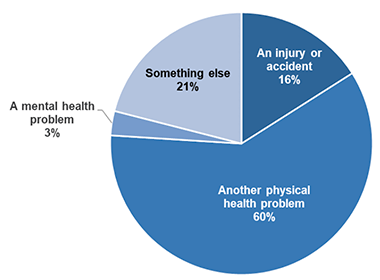
Figure 6.3 shows that the majority of those who contacted an OOH service sought treatment or advice for a physical health problem; sixteen per cent for an injury or accident and sixty percent for another physical health problem. Three per cent of people had received treatment or advice from an OOH service for a mental health problem.
Experience of Out of Hours Healthcare
Most people (seventy nine per cent) rated the overall care positively.
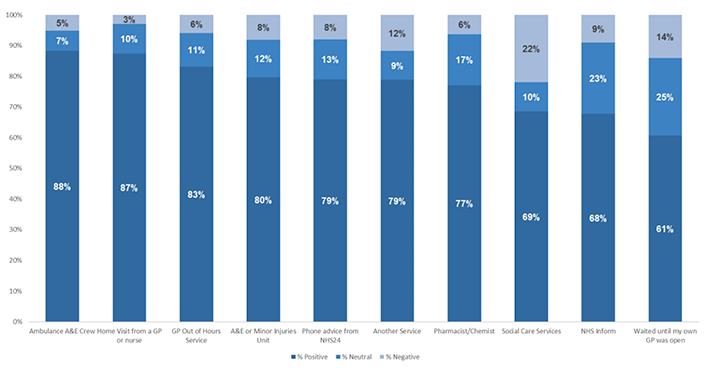
Figure 6.4 shows how people had rated their care by the service they had used. Ambulance A&E crews, home visits from a GP and the GP Out of Hours Service all had the highest proportions of positive ratings (eighty eight, eighty seven and eighty three per cent respectively). Social care services had highest proportion of negative ratings (twenty two per cent) however only a very small number of people had used this service.
The survey asked respondents whether they agreed or disagreed with seven statements relating to their experience the last time they used an OOH service. People were generally positive about their experience of an OOH service.
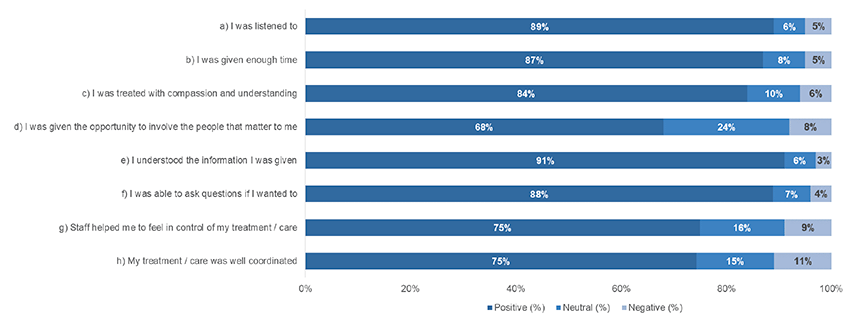
The most positively rated statements were 'I understood the information I was given' and 'I was listened to' (ninety one and eighty nine per cent positive respectively), see Figure 6.5. This is consistent with the most positively rated statements asked about the GP practice. The statement with the lowest positive rating was 'I was given the opportunity to involve the people that matter to me' (sixty eight per cent). However, it should be noted that this statement also had the largest neutral response ('Neither agree nor disagree') and the proportion of people rating the statement negatively was still relatively low (eight per cent).
Responses can be analysed by the service that people ended up receiving treatment or advice from. Looking across all the statements, those who had a home visit from a GP or received treatment or advice from an ambulance A&E crew were the most positive. People who ended up receiving treatment or advice from social care services, from NHS Inform or by phone from NHS 24 were the least positive.
Contact
Email: patientexperience@gov.scot