Health and Care Experience Survey: results 2019/2020
Results from the 2019/2020 Health and Care Experience Survey
5. Recent Treatment or Advice from the GP Practice
Most Recent Treatment or Advice
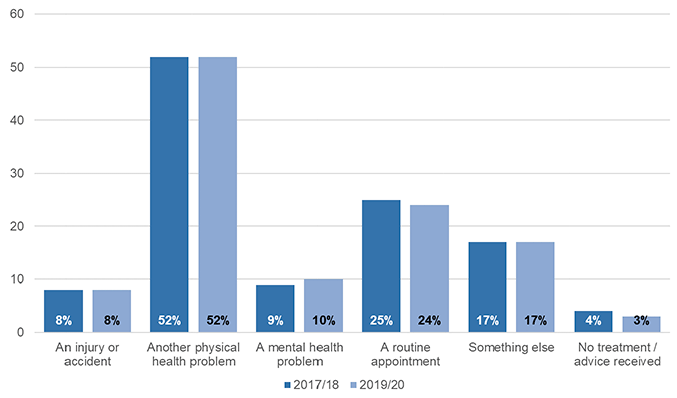
Those who had contacted their GP practice within the last twelve months were asked, if they had received treatment or advice at their GP practice in this time, what they had received treatment or advice for.
Respondents were asked to tick all the reasons for treatment or advice that applied to them and Figure 5.1 details the total proportion of people selecting each reason. Only three per cent of people did not receive any treatment or advice.
The vast majority (eighty eight per cent) of those who had received treatment or advice had selected only one reason for seeking treatment or advice. Only two per cent of people selected three or more reasons for seeking treatment or advice.
The last time treatment or advice had been received from the GP practice, most of that treatment or advice was provided by:
- a doctor for just over three quarters of people (seventy four per cent);
- a nurse for one fifth of people (twenty per cent);
- other healthcare professional for five per cent of people.
Experience of Care
Respondents were asked whether they agreed or disagreed with eight statements relating to their experience of care the last time they received treatment or advice at their GP practice. People were generally positive about their experience with more than seventy five per cent of people rating nine out of the eleven statements positively, as shown in Figure 5.2.
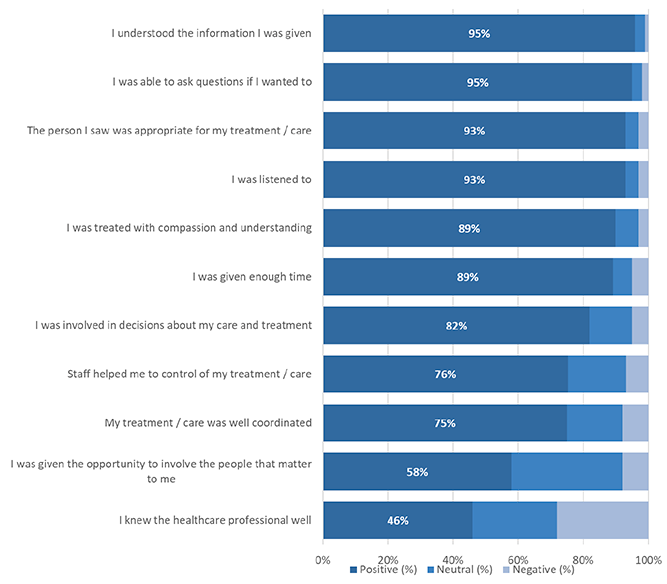
The most positively rated statements were 'I understood the information I was given' and 'I was able to ask questions if I wanted to (both ninety five per cent positive).
The statement with the lowest positive rating was 'I knew the healthcare professional well', with less than half of people (forty six per cent) rating it positively. This statement also has a significantly higher negative rating (twenty eight per cent) than the other statements. However, those who had contacted their GP practice more frequently in the last twelve months were more likely to respond positively to this statement.
People were also less positive about the statement 'I was given the opportunity to involve the people that matter to me', with a per cent positive rating of fifty eight per cent. However this statement has the highest neutral response of all the statements (thirty four per cent) and has a negative rating consistent with the other, more positively rated, statements (eight per cent). This question also had a noticeably lower response rate than the other statements which suggests people may have felt the statement was not applicable to them and so chose to leave it blank.
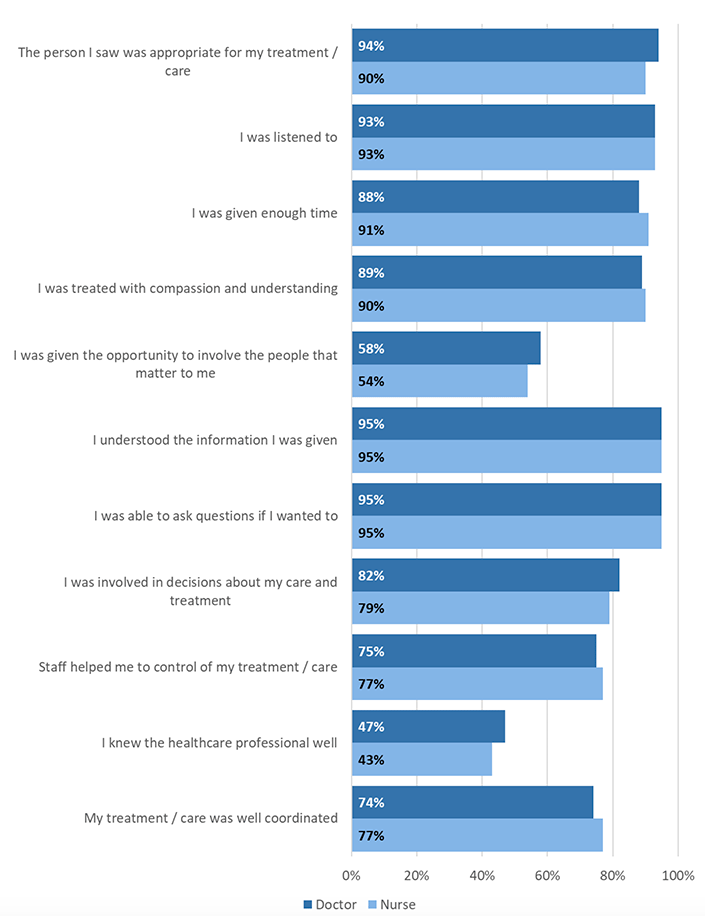
Looking at the per cent positive ratings based on whether most of the treatment or advice was provided by a doctor or a nurse, these were broadly consistent with the overall ratings as can be seen in Figure 5.3.
Previous surveys asked similar questions around the statements 'I was listened to' and 'I was given enough time' specifically in relation to doctors and nurses. The proportion of people agreeing with the statements in relation to doctors remains broadly steady:
- 'I was listened to' was rated positively by ninety three per cent of people in 2019/20, the same as in 2017/18; and
- 'I was given enough time' was rated positively by eighty eight per cent of people in 2019/20, compared to ninety per cent in 2017/18.
Effects of Treatment or Advice
Respondents were then asked to describe the effect that the treatment or advice had on both the symptoms they were experiencing and their overall wellbeing. Around a fifth of people either felt that it was too soon to say or that this was not applicable to them (twenty one and eighteen per cent for symptoms and overall wellbeing respectively).
Figure 5.4 shows the responses for those who were able to describe the effects. People were more likely to report that their symptoms had got better than their overall wellbeing (sixty four per cent vs. fifty six per cent). The proportion of people selecting 'Got worse' was five per cent for symptoms and six per cent for overall wellbeing.
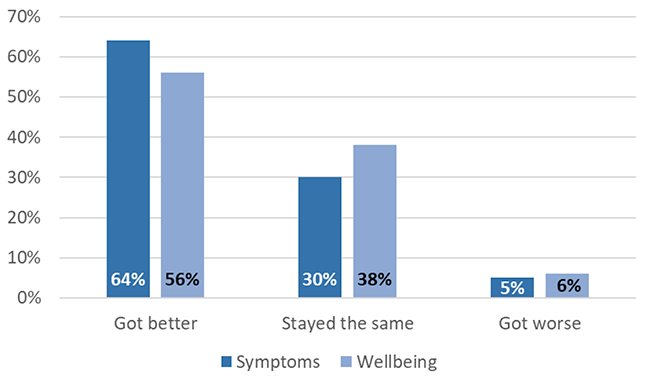
Those who were treated or advised by a doctor were more likely to report that both their symptoms and overall wellbeing had got better (sixty five and fifty seven per cent respectively) compared to those who were treated or advised by a nurse (sixty two and fifty one per cent respectively).
Contact
Email: patientexperience@gov.scot