Growing up in Scotland: a study following the lives of Scotland's children
The first research report on Sweep 1 findings of the Growing Up in Scotland study.
Chapter 9: Parental Health
9.1 Introduction
Parental health and well-being are important in shaping the early experiences of young children, including their health and development. Evidence suggests that these early experiences have an influence in determining, at least in part, future life circumstances and health (Wadsworth and Kuh, 1997; can de Mheen et al. Parental health and well-being will also influence the process of parenting (Murray, 1996) and is further important in itself as Scotland aims to improve the health of all the population. Improving Health in Scotland: The Challenge (Scottish Executive, 2003b) sets out a framework which aims 'to narrow the opportunity gap and improve the health of our most disadvantaged communities at a faster rate, thereby narrowing the health gap'. Delivering for Health (Scottish Executive, 2005) emphasises a shift towards preventive medicine and more continuous care in the community. While inequalities in health, related particularly to poverty and deprivation are emphasised in government policy documents, this is balanced by a recognition of related lifestyle factors, such as drinking, diet, smoking and exercise, which are themselves socially patterned. More recently, the Framework for Mental Health Services in Scotland (Scottish Executive, 2001) aims to accelerate improvements in this area, highlighting the need to support the mental health needs of the Scottish population.
The GUS study, in addition to measuring the health and well-being of the children involved, also assesses, through a series of self-completion questions, the physical and mental health of their parents. This section explores the general health of parents and the prevalence of long-standing illness, parents' health-related quality of life and their smoking, drinking and drug use.
9.2 Physical health
9.2.1 General health
All respondents were asked to assess their health in general as either 'excellent', 'very good', 'good', 'fair' or 'poor'. The vast majority of parents (85%) in both cohorts said that their general health was good or better (Table 9.1) including one-fifth who reported their health to be excellent. Only a very small proportion regarded their health to be poor.
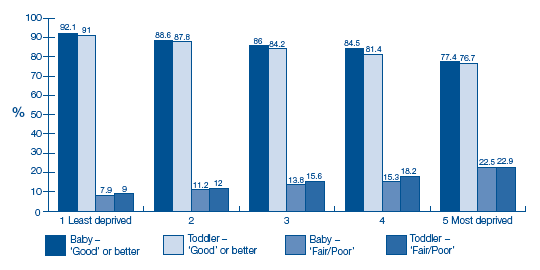
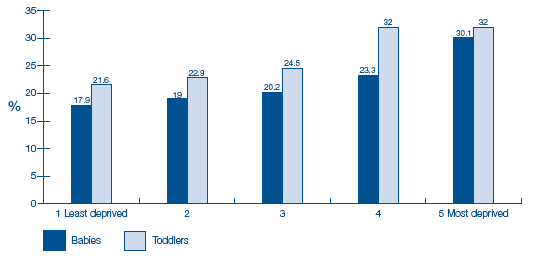
There were statistically significant differences in general health ratings across most of the sub-groups considered in the analysis. Older mothers were more likely than younger mothers to rate their health as 'good' or better. Although proportions were generally high for both groups, 82% of teenage mothers regarded their health to be 'good' or better compared with 87% of mothers in their forties. Parity had only a small effect on self-assessed health, the data suggest that perceived health rating decreases as the number of children in the household increases - 7% of mothers with four or more children rated their health as poor compared with 2% of mothers with one child. Level of deprivation, across a range of measures. was significantly related to reported general health. For example, the data in Figure 9-A show that parents living in the most deprived areas were more than twice as likely to report fair or poor health than those who live in the least deprived areas. In the toddler cohort a little over one in five parents living in areas in the most deprived quintile rated their health as 'fair' or 'poor' compared with less than one in ten parents in the least-deprived quintile. White respondents were more likely to report better health: 57% reported their health to be very good or better compared with 45% of the non-white sample.
Table 9.1 Parental general health by sample type
| Health status |
Sample type (%) |
|
|---|---|---|
| Babies |
Toddlers |
|
| Excellent |
19.3 |
17.4 |
| Very good |
38.4 |
37.4 |
| Good |
27.5 |
29.1 |
| Fair |
12.1 |
13.0 |
| Poor |
2.5 |
2.9 |
| Can't say |
0.1 |
0.3 |
| Bases |
||
| Weighted |
5217 |
2858 |
| Unweighted |
5217 |
2858 |
Figure 9-A Self-assessed general health by area deprivation quintiles
9.2.2 Long-standing illness
All respondents were asked whether they had any health problems or disabilities that had lasted or were expected to last for more than a year. Respondents were then asked to say whether their illness limited their ability to carry out normal day-to-day activities in any way.
The prevalence of long-standing illness was very similar for the parents of babies and toddlers. Around one in six parents in each cohort (16% babies, 17% toddlers) had a long-standing illness, of whom around two-fifths (40% babies, 46% toddlers) or 7% of the whole of each sample, reported having a limiting illness.
Lone parents were significantly more likely than parents in couple families to report a long-standing illness. Among the parents of babies, around a quarter of lone parents (23%) had a long-standing illness compared with 15% of parents in couple families. Furthermore, 10% of all lone parents with babies had a limiting long-standing illness compared with 6% of baby parents in couple families.
Prevalence of long-standing illness (both limiting and non-limiting) was strongly linked to area deprivation. Within the baby sample, parents living in the most deprived quintile were almost twice as likely to report a long-standing illness as those in the least deprived quintile (20% most deprived versus 12% least deprived).
9.2.3 Long-standing illness and general health
The relationship between reported general health and long-standing illness is not as straightforward as might be expected, as having a long-standing illness did not necessarily correspond with a poor self-assessment of general health (Table 9.2). As the data in the table show, one-fifth of toddler parents with a long-standing illness rated their general health as very good or better and a further 30% considered their health to be good. A similar pattern was evident among baby parents.
Table 9.2 Prevalence of long-standing illness by self-assessed general health - toddler sample only
| Health status |
Do you have any health problems or disabilities that are |
Row bases |
||
|---|---|---|---|---|
| (Row % in italics) |
||||
| Yes |
No |
Weighted |
Unweighted |
|
| Toddlers |
||||
| Excellent |
3.2 |
20.3 |
495 |
502 |
| 3.2 |
96.8 |
|||
| Very good |
17.3 |
41.4 |
1061 |
1074 |
| 7.9 |
92.1 |
|||
| Good |
29.5 |
29.0 |
826 |
818 |
| 17.2 |
82.8 |
|||
| Fair |
34.3 |
8.6 |
369 |
358 |
| 44.8 |
55.2 |
|||
| Poor |
15.0 |
0.4 |
83 |
84 |
| 87.6 |
12.4 |
|||
| Can't say |
0.6 |
0.2 |
7 |
7 |
| 43.4 |
56.6 |
|||
| Column bases |
||||
| Weighted |
482 |
2358 |
||
| Unweighted |
480 |
2363 |
||
9.3 Health-related quality of life
9.3.1 Introduction
Health-related quality of life was measured by the Medical Outcomes Study 12-Item Short Form ( SF-12). This was new to the Scottish Health Survey in 2003, but has previously been used in population surveys on many occasions (for example, the Health Survey for England and the National Survey of NHS Patients). The SF-12 is a widely used self-reported generic measure of health status, yielding both a physical component ( PCS) and a mental health component ( MCS) summary scale score (Ware et al. 2001). It is a shorter, yet valid, alternative to the SF-36 and is tailored for use in large health surveys of general populations. Higher scores on both the physical and mental health component scales are indicative of better health-related quality of life, but as with the self-assessed health results presented in Section 9.2.1, results in this section are based on informants' self-reports of their own physical and mental functioning and as such are subjective. This may lead to differential reporting between informants with equivalent status.
9.3.2 Medical Outcomes Study Short Form ( SF-12) scores
Table 9.3 presents the results for the baby cohort for each of the 12 items that make up the SF-12 scale by sample and family type. There were some significant differences in responses to these questions between respondents from different family types with lone parents being consistently more likely than couple families to report that poor health or pain affected their daily lives on a variety of measures. For example, 16% of lone parents said that ill health limited their ability to perform moderate activities compared with 9% of parents in couple families.
Some of the clearest distinctions between the two groups relate to the emotional measures, with lone parents more likely to report the impact of emotional problems on their lives. For example, around a quarter (27%) of lone parent respondents said that they accomplished less as a result of emotional problems, compared with 15% of parents in couple families. There was a greater distinction between the mean mental component scores of lone parent and couple families than there was in the mean physical component scores, mirroring the distinction already identified in the individual measures.
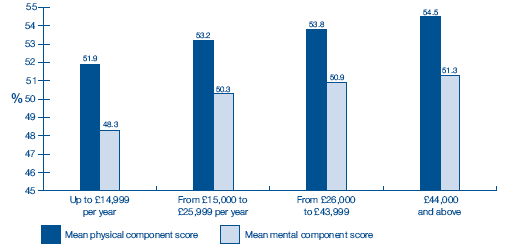
The summary scores enable comparison across a range of other groups within the sample. Figure 9-B displays the mean physical and mental component scores by household income quartile. As the data show, there was a clear income-related increase in combined SF-12 scores indicating an rise in health-related quality of life as household income increases. The mean mental component score was 48.3 for the parents of babies in the lowest income quartile compared with 51.3 in the highest income quartile, a similar increase is evident in mean physical component scores. The differences evident across the household income quartiles represent some of the most pronounced distinctions in the combined SF-12 scores within the sample. However, a number of less pronounced differences also exist. For example, the data show that mothers under the age of 20 at the time of the child's birth have the lowest scores on the scale, with those in their 30s having the highest.
Table 9.3 Health-related quality of life by family type (baby cohort only)
| Health-related quality of life measures |
Family type |
|
|---|---|---|
| Lone Parent |
Couple Family |
|
| Health assessed as fair or poor |
22.1 |
12.8 |
| Extent to which ill-health limits ability to perform moderate activities |
||
| A lot |
4.1 |
1.8 |
| A little |
12.2 |
7.3 |
| Not at all |
83.7 |
90.9 |
| Extent to which ill-health limits ability to climb several flights of stairs |
||
| A lot |
4.6 |
1.8 |
| A little |
16.0 |
9.7 |
| Not at all |
79.4 |
88.6 |
| Accomplished less as a result of poor physical health |
17.3 |
12.3 |
| Limited in work or other daily activities as a result of poor physical health |
13.7 |
8.6 |
| Accomplished less as a result of emotional problems |
27.1 |
14.9 |
| Performed work or any other activities less carefully as a result of emotional problems |
21.5 |
12.3 |
| Pain interfered with normal work at least slightly |
25.0 |
18.3 |
| Extent to which felt calm and peaceful in past 4 weeks |
||
| All/most of the time |
45.1 |
42.6 |
| Good bit/some of the time |
19.7 |
21.8 |
| A little/none of the time |
14.1 |
12.2 |
| Amount of time had a lot of energy in last 4 weeks |
||
| All/most of the time |
40.2 |
35.5 |
| Good bit/some of the time |
44.2 |
51.4 |
| A little/none of the time |
15.6 |
13.1 |
| Amount of time felt down in last 4 weeks |
||
| All/most of the time |
9.5 |
4.0 |
| Good bit/some of the time |
29.5 |
22.6 |
| A little/none of the time |
61.0 |
73.4 |
| Amount of time felt that physical or emotional problems interfered with social activities in last 4 weeks |
||
| All/most of the time |
8.4 |
3.6 |
| Good bit/some of the time |
17.6 |
10.4 |
| A little/none of the time |
73.8 |
86.0 |
| Mean physical component score |
52.1 |
53.5 |
| Standard error of mean |
0.25 |
0.10 |
| Mean mental component score |
48.0 |
50.6 |
| Standard error of mean |
0.37 |
0.14 |
| Bases |
||
| Weighted |
1058 |
4158 |
| Unweighted |
978 |
4239 |
Showing a similar pattern, parents living in more deprived areas and those in routine or semi-routine households also reported lower summary physical and mental component scores than those in more affluent areas and those in intermediate or managerial/
professional occupations.
Figure 9-B Health-related quality of life by household income quartile (baby cohort only)
9.4 Smoking
Respondents were asked a number of questions about their smoking, drinking and drug use. Given the particular sensitivity of these topics, these questions were all contained within the self-completion section of the interview where responses were not seen by the interviewer.
9.4.1 Current smoking behaviour
Overall, 28% of respondents in the baby cohort and 31% of respondents in the toddler cohort were current smokers at the time of the interview. (Results from the 2003 Scottish Health Survey found that 28% of all women were current smokers at that time. 17 ) There were a number of marked differences in smoking prevalence by area deprivation, household income and household NS-SEC across both cohorts. The propensity to smoke increased with area deprivation levels. One in ten parents in the least deprived quintile smoked at the time of the interview compared with 45% of those in the most deprived quintile. Respondents in higher income households were less likely to smoke than those in lower income households - around half of parents in the lowest income quartile smoked at the time of the interview compared with less than 10% of parents in the highest income quartile. Smoking prevalence was lower in households where parents were in managerial and professional occupations (14% babies, 15% toddlers) than in households where parents were in routine and semi-routine occupations (53% babies, 56% toddlers).
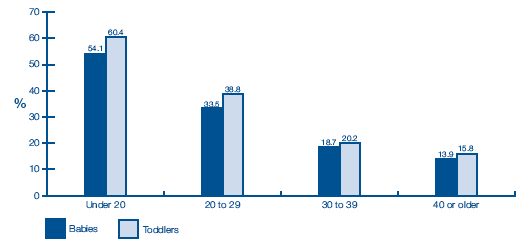
Smoking rates were higher among lone parents, younger mothers and respondents with lower or no educational qualifications. Three in five lone parents (59%) in the toddler cohort smoked compared with just over one in five (22%) of parents in couple families. In the baby sample, a little over half (54%) of mothers who were in their teens at the time of the cohort child's birth smoked compared with around a third of twenty-something mothers, 19% of thirty-something mothers and 14% of mothers aged 40 or older (see Figure 9-C).
Figure 9-C Smoking at the time of the interview by age of mother at birth of cohort child
On average, respondents who smoked reported smoking around 12 cigarettes a day. The patterns evident in smoking prevalence are generally reflected in this data so that those parents who were more likely to smoke also smoked more cigarettes a day, although differences between groups were not great.
Overall, around one in three children (30% babies, 32% toddlers) in the sample were living in a household where at least one person smoked in the house. As might be expected, the patterns in this data mirror those in smoking prevalence - for example, in the toddler cohort 51% of respondents in the most deprived quintile said that at least one person smoked in the house compared with 10% in the least deprived quintile.
9.4.2 Smoking whilst pregnant
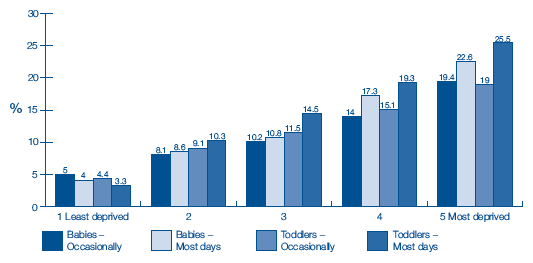
Across both cohorts, around one in four mothers said that they smoked during their pregnancy with the cohort child (25% babies, 27% toddlers). Of those who smoked during their pregnancy, around half said they smoked 'most days' and half smoked only 'occasionally'. Mothers living in more deprived areas were more likely to have smoked during their pregnancy; in the baby cohort, 42% in the most deprived quintile reported smoking whilst pregnant compared with 9% in the least deprived quintile (Figure 9-D). Further patterns already identified in the smoking prevalence data are repeated here.
Figure 9-D Smoking during pregnancy by sample type and area deprivation quintiles
9.5 Consumption of alcohol
9.5.1 Current alcohol consumption
The vast majority of parents in both cohorts drank alcohol - four out of five (80%) did so at least once a month or more often, including around one in five who drank more often than once a week. On average, among those respondents who drank, parents of babies consumed 3.8 units of alcohol per week. Toddlers' parents had a slightly higher mean intake of 4.4 units per week. In both cohorts, the vast majority of parents who drank alcohol consumed less than five units per week (71% babies' parents, 66% toddlers' parents), around a quarter consumed between five and ten units per week and less than 10% consumed more than ten units per week. Only a very small proportion of respondents exceeded the recommended weekly limits of alcohol consumption. 18 However, a greater number admitted to drinking more than five units of alcohol on a single occasion. 19 Across both cohorts, a little under three-quarters (71% babies' parents, 73% toddlers' parents) reported that they did this at least intermittently including a significant minority (22% babies' parents, 27% toddlers' parents) who did so two or three times a month or more often. In comparison to other national data sources, levels of alcohol consumption levels appear to be lower than average. However, the dominance of mothers among the respondents will explain much of this variation.
The prevalence of alcohol consumption varied considerably by area deprivation and household income. A little over one in ten (12%) mothers in the least deprived quintile said that they never drank, or hadn't done so in the last year, compared with around one in four (26%) parents in the most deprived quintile. There was little variation in the average number of units of alcohol consumed by area deprivation. However, respondents in more deprived areas were significantly more likely to say they drank five or more units on one occasion than those in less deprived areas (Figure 9-E). In the baby cohort, a little over three-quarters (77%) of respondents in the most deprived quintile did this at least occasionally including 15% who did so on a weekly basis, compared with around
two-thirds (64%) of parents in the least deprived quintile who did so occasionally and 7% who did so weekly.
Figure 9-E Percentage who consume five or more units of alcohol on one occasion at least two or three times a month or more often by sample type and area deprivation quintiles
There is a similar relationship between alcohol consumption and household income. Frequency of alcohol consumption increased with household income - 8% of parents in the lowest income households drank alcohol more than once a week compared with 36% of parents in the highest income group. The propensity to consume five or more units of alcohol on one occasion increased as household income decreased; in the toddler cohort, 20% of parents in the lowest income quartile said they never did this compared with 33% of parents in the highest income quartile.
Analysis by family type highlighted some interesting distinctions across the sample. For example, although similar proportions of lone parents and parents in couple families did not drink alcohol (in the baby sample, 22% and 18% respectively) the drinking behaviour of those who did drink varied considerably (Table 9.4). Parents in couple families were significantly more likely to consume alcohol more than once a week than lone parents (in the baby sample, 6% versus 21%). However, on average lone parents drank a slightly higher number of units of alcohol in a typical week (in the baby sample, 4.2 units for lone parents versus 3.7 for couple families) and were more likely to drink five or more units of alcohol on one occasion than parents in couple families. Around a third (31%) of parents in couple families never drank five or more units on one occasion compared with just under one-fifth (18%) of lone parents. Fifteen percent of lone parents reported doing so at least once a week compared with 8% of parents in couple families.
Table 9.4 Alcohol consumption by family type (baby sample only)
| Consumption of alcohol variable |
Family type |
|
|---|---|---|
| Lone parent |
Couple Family |
|
| Frequency of alcohol consumption |
||
| More often than once a week |
6.2 |
21.0 |
| Once a week |
19.8 |
19.6 |
| 2 or 3 times a month |
17.2 |
15.1 |
| Once a month or less |
34.3 |
26.2 |
| Not in the last year/not at all |
22.3 |
18.1 |
| Bases |
||
| Weighted |
1058 |
4158 |
| Unweighted |
978 |
4239 |
| Mean number of units of alcohol drunk in an average week |
4.2 |
3.7 |
| Frequency of drinking 5 or more units on one occasion |
||
| More often than once a week |
1.6 |
0.9 |
| Once or twice a week |
13.0 |
7.2 |
| 2 or 3 times a month |
18.3 |
11.6 |
| Less than once a month |
48.7 |
48.9 |
| Never |
18.4 |
31.3 |
| Bases |
||
| Weighted |
807 |
3372 |
| Unweighted |
746 |
3462 |
9.5.2 Consumption of alcohol whilst pregnant
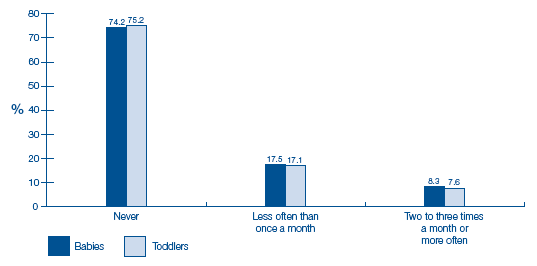
Where the respondent was the child's natural mother, they were asked how often they drank alcohol during their pregnancy with the cohort child (Figure 9-F). For both cohorts, around three-quarters of respondents (74% babies, 75% toddlers) said that they did not drink at all and those who did largely said that they drank less often than once a month (17% both samples). Only a very small proportion drank alcohol monthly or more often whilst pregnant.
Figure 9-F Consumption of alcohol whilst pregnant by sample type
Across both cohorts, lone parents and younger mothers were less likely to say they drank whilst pregnant than parents in couple families and older mothers. For example, one-fifth (19% babies, 20% toddlers) of lone parents said they did so compared with around a quarter (27% babies, 26% toddlers) of parents in couple families.
Continuing the patterns identified earlier, mothers living in more deprived areas were less likely to say they drank whilst pregnant than those living in less deprived areas. Sixty-five percent of mothers in the least deprived quintile reported never drinking alcohol whilst pregnant compared with 82% of mothers in the most deprived quintile.
9.6 Illicit drug use
Respondents were asked a series of questions about use of certain illicit drugs - whether they had ever used drugs and what types of drug they had used, whether they had used any drugs in the last 12 months and whether they felt they had been dependent on a particular drug in the last year.
As with the questions on smoking and drinking, questions on drug use were contained within the self-report section of the interview. Although self-report surveys are a very useful method of monitoring drug using behaviour, there are a number of limitations associated with their use. First, more serious or 'chaotic' drug users are likely to be under-represented as they are more likely to be homeless, in prison or simply never available for interview. Secondly, given the illegal nature of much drug use, it is likely that there is an element of under-reporting within the survey, particularly with the use of harder or more heavily stigmatised substances (such as heroin and crack cocaine). Finally, it is also possible that people will forget occasional use of drugs, particularly if this was a long time ago, or if they regard themselves as 'non-users'.
9.6.1 Ever used drugs
In both cohorts, around a quarter of parents said that they had ever taken drugs (27% of babies' parents, 25% of toddlers' parents). These figures are slightly higher than those found in the 2004 Scottish Crime and Victimisation Survey ( SCVS) in which 20% of women aged between 16 and 59 reported ever using drugs. However, given that a further finding from SCVS was that drug use was concentrated among younger age groups, this difference is likely due to a more restricted, and younger, age range in the GUS sample than in SCVS. The vast majority of drug use was accounted for by use of cannabis - in the baby cohort almost all of those (94%) who ever used any drugs said they had used cannabis at some time (see Table 9.5). Although much less frequently used, amphetamines and ecstasy were the next most common drugs used followed by cocaine and LSD. Use of harder drugs such as heroin, methadone or crack was extremely rare - less than 1% of each sample reported any use of these drugs.
Table 9.5 Prevalence of lifetime drug use by sample type
| Type of drug |
% of all sample |
% of those who had ever used drugs |
||
|---|---|---|---|---|
| Baby |
Toddler |
Baby |
Toddler |
|
| Any drug |
26.8 |
24.9 |
100.0 |
100.0 |
| Cannabis |
25.0 |
23.0 |
93.5 |
92.2 |
| Amphetamines |
6.1 |
6.2 |
23.0 |
25.1 |
| Cocaine or coke |
3.5 |
3.2 |
13.2 |
12.7 |
| Crack |
<1 |
<1 |
1.8 |
1.1 |
| Ecstasy |
5.4 |
5.1 |
20.1 |
20.5 |
| Heroin |
1.0 |
<1 |
3.6 |
3.2 |
| Methadone |
<1 |
<1 |
3.0 |
1.6 |
| Acid or LSD |
2.8 |
3.1 |
10.6 |
12.4 |
| Another illegal drug |
<1 |
<1 |
1.9 |
1.4 |
| Bases |
||||
| Weighted |
5217 |
2858 |
1397 |
712 |
| Unweighted |
5217 |
2858 |
1379 |
701 |
Lone parents and younger mothers were more likely to say that they had ever taken drugs than parents in couple families and older mothers. In the baby cohort, a third of lone parents (33%) said they had taken drugs at some point compared with a quarter of parents in couple families. One in three (33%) of babies' mothers aged under 20 years old at the time of the child's birth said they had ever used drugs compared with one in four (25%) mothers in their thirties and a little over one in five (21%) mothers aged 40 or older. There were no other significant differences in drug use across the sample.
9.6.2 Drug use in the last year
If respondents indicated that they had ever used a particular type of drug, they were then asked whether or not they had used that drug in the last 12 months. Just under 5% of all respondents in either cohort reported taking drugs in the 12 months before the interview. As might be expected, these figures are slightly lower than those recorded by the 2004 Scottish Crime and Victimisation Survey which found that 7% of women aged between 16 and 59 had used drugs in the last year.
Among the GUS sample, of all those who had ever taken drugs, just under one-fifth had used drugs in the last 12 months (17% babies, 19% toddlers). The majority of drug use in the last year was accounted for by use of cannabis, around nine out of ten respondents who had used any drugs in the last year had used cannabis. Only a tiny proportion of the whole sample, and a very small proportion of those who had used drugs in the last 12 months, reported use of a drug other than cannabis.
In similarity to the patterns highlighted in the earlier data, across both cohorts lone parents and younger mothers were significantly more likely to say they had used drugs in the last year than parents in couple families and older mothers. For example, 11% of mothers aged under 20 in the baby sample reported drug use in the last 12 months compared with 6% of mothers in their twenties, 3% of mothers in their thirties and 2% of mothers aged 40 or older.
Use of drugs in the last year also varied by mothers' educational level. Mothers who had lower or no educational qualifications had a greater propensity to report drug use in the last year than those who had higher educational qualifications. In the toddler cohort, 7% of mothers with no educational qualifications reported using drugs in the last year compared with 2% of those with a degree.
In both samples, household income and NS-SEC were related to drug use in the last year. Looking at the baby sample, one in ten respondents in the lowest income quartile said they had used drugs in the last year compared with 2% in the highest and second highest quartiles. Nine percent of parents in routine and semi-routine households used drugs in the last year compared with 2% of those in managerial or professional households (see Figure 9-G).
Figure 9-G Any use of drugs in the last 12 months by sample type and household NS-SEC
9.6.3 Drug dependency and treatment
Respondents who indicated that they had used a particular drug in the last 12 months were then asked whether they had used that drug to the extent that they felt they needed it or were dependent on it.
Around 1% of all respondents and 5% of those who had ever used drugs, in both samples, reported that they had had some dependency on a particular drug in the last 12 months. Among those who had used drugs in the last 12 months, 32% in the baby sample and 24% in the toddler sample reported some dependency (note that the base numbers for this group are quite small). Those parents using methadone and heroin were the most likely to report dependency.
Respondents who said they had used drugs in the last 12 months were asked whether they had received any treatment for, help with or advice about their drug use. Fourteen percent of the relevant group in the baby sample and 10% in the toddler sample reported they had received treatment, help or advice in the last year because of their drug use. Methadone and heroin users were those most likely to be receiving help.
9.7 Key points
- The vast majority of parents in both cohorts (85%) reported their general health to be either good, very good or excellent. Lone parents were more likely than couple parents to rate their health as fair or poor and to have a long-standing health problem and limiting illness, as were those with lower levels of educational attainment and those living in areas of greater deprivation.
- Around one in six parents in both cohorts (16% babies, 17% toddlers) reported having a long-standing illness. Of this group, approximately 4 in 10, or 7% of the whole sample, reported having a limiting illness or disability.
- Lone parents were much more likely to report emotional health problems than couple parents.
- Approximately three in ten parents were current smokers at the time of interview, with marked differences by area deprivation, household income and socio-economic classification. Smoking rates were also higher among lone parents, younger mothers and those with lower levels of educational attainment.
- In the toddler cohort, 51% of cohort children in the lowest income quartile lived in a household in which at least one person smoked, compared with just 10% of those in the highest quartile.
- About one in four mothers said that they smoked while pregnant with the cohort child; and, of those who did, around half said they smoked 'most days'. Around a quarter of mothers indicated that they drank alcohol during their pregnancy.
- Parents in couple families were likely to consume alcohol more often, as were older parents and those in more affluent households and areas. Although lone parents were less likely to drink often, they tended to drink more when they did so.
- Around a quarter of all parents (26%) said they had ever taken illicit drugs, and about one in 20 (4.7%) said they had used drugs in the previous 12 months. The vast majority of drug use was accounted for by cannabis use.
9.8 Conclusion
Overall, the indicators of health used in this study suggest that the general level of health and well-being reported by the parents were good. This is to be expected with a relatively young sample and reflects other health-related surveys although the rates of parents reporting that their health was fair or poor was slightly lower than that found in the MCS (17.7% of mothers, Dex and Joshi, 2004). Closer examination of differences between subgroups within GUS reinforce the established pattern of inequalities in relation to health. Those in more disadvantaged households, more deprived areas, lone parents, non-white parents and younger parents, on the whole, report less favourably on their own health and report higher rates of long-standing illness than the more advantaged or those living as a couple. Subjective measures of health status do not always correlate highly with reports of long-standing illness, and the presence of the latter is not always perceived as compromising good health even though it may affect everyday life. Importantly, the emotional health component of the SF -12, showed quite marked variation between lone parents and couple families, suggesting that the former are more vulnerable and that services should be tailored to meet their needs and support them in their parenting role in particular.
The health behaviour data also follow familiar patterns with marked differences in smoking rates by age, family type and deprivation. This remains a major concern and challenge for government and parents themselves as the detrimental effects on smokers and their children are well known. The smoking rates for the Scottish cohort in the MCS were very similar. Alcohol rates were also socially patterned; the overall picture was of low to moderate drinking with some evidence of more frequent drinking among older and more affluent parents but with higher amounts of alcohol consumed, less frequently, by lone parents. Although a quarter of all parents said that they had ever taken an illegal drug, this was predominantly cannabis and only one in 20 reported that they had used drugs in the previous 12 months. The study contains a few respondents who use drugs other than cannabis.