Government Expenditure and Revenue Scotland 2022-23
Government Expenditure and Revenue Scotland (GERS) is a National Statistics publication. It estimates the revenue raised in Scotland and the cost of public services provided for the benefit of Scotland.
Summary
Introduction
- Government Expenditure and Revenue Scotland (GERS) addresses three questions about Scotland’s public sector finances under the current constitutional arrangements:
- What revenues were raised in Scotland?
- How much was spent on public services for Scotland?
- To what extent did revenues cover the costs of these public services?
- GERS is a National Statistics publication. It is assessed by the independent UK Statistics Authority to ensure that it meets the standards set out in the Code of Practice for Statistics.
- The tables below provide figures for the last three years. Figures for back to 1998-99 are available in the accompanying spreadsheets online.
- Feedback from users of the publication is welcome. A correspondence address is available in the back leaf of the publication. Comments can be emailed to economic.statistics@gov.scot.
Scotland’s Overall Fiscal Position
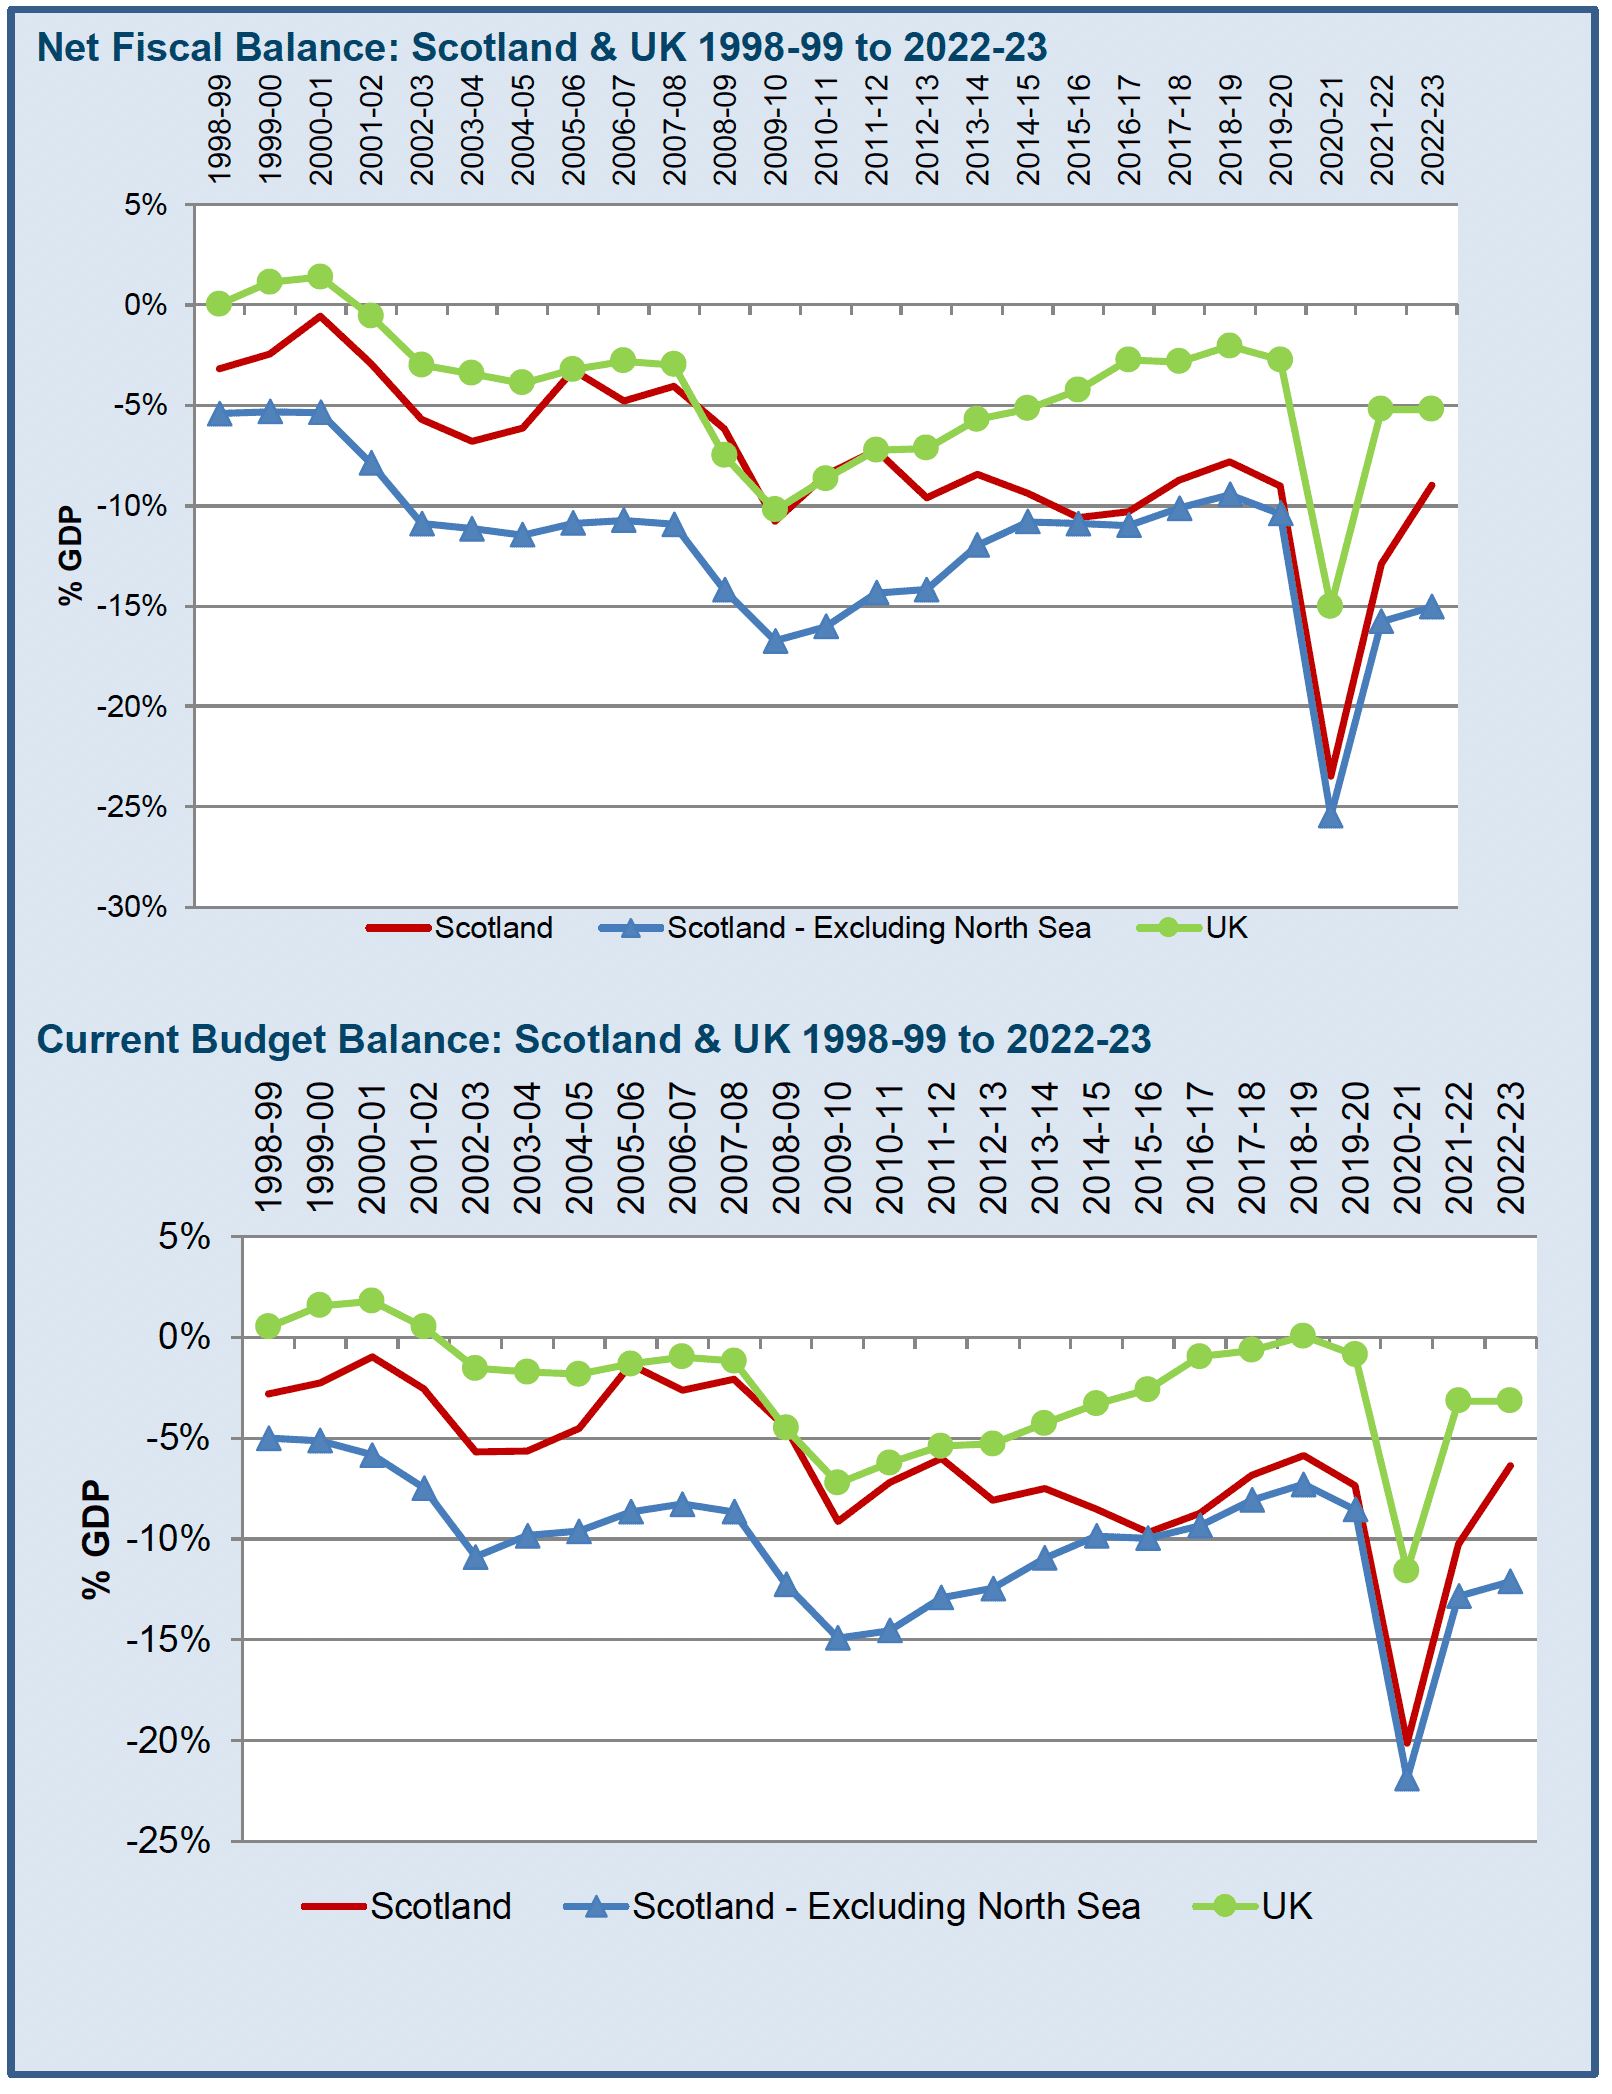
- GERS provides two measures of Scotland’s fiscal position, the net fiscal balance and the current budget balance.
- The net fiscal balance measures the difference between total public sector expenditure and public sector revenue. It therefore includes public sector capital investment, such as the construction of roads, hospitals, and schools, which yields benefits not just to current taxpayers but also to future taxpayers. It is shown in Table S.1 below.
- The results for this year’s publication reflect the impact of rising inflation, driven by high energy prices, through 2022-23. There has been significant spending on support for the cost of living for households and businesses, worth £4.5 billion for Scotland in 2022-23. Spending on reserved debt interest payments, which are partly linked to inflation, has also increased sharply. These increases in spending is partially offset by a reduction in spending linked to the coronavirus pandemic, which means that spending on health falls for the first time in GERS. Rising energy prices, and the introduction of windfall taxes on the oil and gas industry, have also led to record increases in revenue from the North Sea, which is now at its highest ever level.
| £ million | |||
|---|---|---|---|
| 2020-21 | 2021-22 | 2022-23 | |
| Scotland | -37,853 | -24,899 | -19,139 |
| Scotland - Excluding North Sea | -38,605 | -27,345 | -28,525 |
| As % of GDP | |||
| Scotland | -23.4% | -12.8% | -9.0% |
| Scotland - Excluding North Sea | -25.4% | -15.7% | -15.1% |
| UK | -15.0% | -5.2% | -5.2% |
- In 2022-23, Scotland’s net fiscal balance as a share of GDP was -9.0%, compared to -12.8% in 2021-22. This is a fall of 3.8 percentage points for Scotland, whilst the UK deficit remained at 5.2%.
- This difference is primarily explained by the contribution of North Sea revenue and activity. Scottish North Sea revenue, grew by £6.9 billion in 2022-23 to £9.4 billion, to reach its highest ever level. However, excluding North Sea revenue, the net fiscal balance for Scotland fell by 0.6 percentage points. This reflects strong growth in receipts, discussed below.
- The current budget balance shows the difference between revenue and current expenditure only. It therefore excludes public sector capital investment. It measures the degree to which taxpayers meet the cost of paying for public services, excluding capital investment. It is shown in Table S.2 below.
- The current budget balance for Scotland tends to move in line with the net fiscal balance figure but is typically around 2 percentage points smaller as a share of GDP. In 2022-23, the deficit on the Scottish current budget balance including the North Sea also decreased by 3.8 percentage points.
| £ million | |||
|---|---|---|---|
| 2020-21 | 2021-22 | 2022-23 | |
| Scotland | -32,451 | -19,774 | -13,577 |
| Scotland - Excluding North Sea | -33,203 | -22,220 | -22,963 |
| As % of GDP | |||
| Scotland | -20.0% | -10.2% | -6.4% |
| Scotland - Excluding North Sea | -21.8% | -12.8% | -12.1% |
| UK | -11.6% | -3.2% | -3.2% |
Scotland’s revenue
- Table S.3 shows two estimates of Scotland’s public sector revenue: (i) all Scottish revenue, and (ii) excluding North Sea revenue.
- Scotland’s revenue in 2022-23 grew by £15.0 billion to £87.5 billion. This was an increase of 20.7% from 2021-22, the largest increase recorded. This reflects strong growth in North Sea receipts due to high energy prices and the introduction of the Energy Profits Levy, as well as the continuing reversal of the falls in revenue caused by the pandemic. Scottish revenue was 8.6% of the UK total, its highest level since 2013-14.
- Onshore revenue also recorded strong growth, increasing by 11.5%. This reflected particular growth in income tax, national insurance contributions, and VAT, all of which are affected by inflation. As a share of GDP, non-North Sea revenue rose to 41.2%, its highest level recorded in GERS.
- Scotland’s share of UK non-North Sea revenue was 7.7% in 2022-23, slightly higher than in 2021-22. This rise was due to relatively stronger performance in income tax receipts, as well as non-domestic rates income after the ending of reliefs introduced during the coronavirus pandemic ended.
| £ million | |||
|---|---|---|---|
| 2020-21 | 2021-22 | 2022-23 | |
| Scotland | 62,423 | 72,481 | 87,496 |
| Scotland - Excluding North Sea | 61,670 | 70,035 | 78,110 |
| As % of UK total revenue | |||
| Scotland | 7.9% | 7.9% | 8.6% |
| Scotland - Excluding North Sea | 7.8% | 7.6% | 7.7% |
| As % of GDP | |||
| Scotland | 38.6% | 37.3% | 41.1% |
| Scotland - Excluding North Sea | 40.5% | 40.2% | 41.2% |
| UK | 38.1% | 39.3% | 40.4% |
- Table S.4 below shows estimates of revenue per person for Scotland and the UK. In the latest year, revenue per person was £696 higher than the UK average, the first time it has been higher since 2014-15. The difference between revenue per person in Scotland and the UK is variable and depends North Sea revenue. In 2021-22, when North Sea revenue was lower, revenue per person was £498 lower than the UK average.
- Excluding North Sea revenue, revenue per person in Scotland is lower than the UK average by £859 in 2022-23.
| £ per person | |||
|---|---|---|---|
| 2020-21 | 2021-22 | 2022-23 | |
| Scotland | |||
| Including North Sea revenue | 11,413 | 13,227 | 15,967 |
| Excluding North Sea revenue | 11,275 | 12,780 | 14,254 |
| UK | |||
| Including North Sea revenue | 11,833 | 13,725 | 15,271 |
| Excluding North Sea revenue | 11,826 | 13,685 | 15,113 |
| Difference (Scotland minus UK) | |||
| Including North Sea revenue | -420 | -498 | 696 |
| Excluding North Sea revenue | -550 | -905 | -859 |
Scotland’s spending
- Table S.5 below shows estimates of public spending for Scotland. Expenditure increased from £97.4 billion in 2021-22 to £106.6 billion in 2022-23. This represents a return to growth following a fall in 2021-22, when public expenditure fell relative to 2020-21 as coronavirus spending was reduced. As a share of GDP, public spending remained at historically high levels in 2022-23, at 50% of GDP, around 5 percentage points higher than prior to the pandemic.
- The increase in spending reflects an increase in reserved public sector debt interest, which has increased due to higher borrowing costs and inflation, and the introduction of Cost of Living support for households and businesses. Together, these account for almost the entire increase in spending in 2022-23. Without these increases, public spending would have remained flat, with broader increases in areas such as education being offset by falls in health spending, as spending associated with the pandemic fell.
| 2020-21 | 2021-22 | 2022-23 | |
|---|---|---|---|
| Scotland - £ millions | 100,275 | 97,380 | 106,635 |
| Share of UK (%) | 9.1% | 9.4% | 9.2% |
| As % of GDP | |||
| Scotland | 61.9% | 50.1% | 50.1% |
| Scotland - Excluding North Sea revenue | 65.8% | 55.9% | 56.2% |
| UK | 53.1% | 44.5% | 45.6% |
- Table S.6 below shows estimates of expenditure per person for Scotland and the UK. Expenditure for Scotland has been consistently higher per person than the UK average over the period.
| £ per person | |||
|---|---|---|---|
| 2020-21 | 2021-22 | 2022-23 | |
| Scotland | 18,334 | 17,770 | 19,459 |
| UK | 16,505 | 15,549 | 17,243 |
| Difference (Scotland minus UK) | 1,829 | 2,222 | 2,217 |
Frequently Asked Questions
Below is a summary of some of the most frequently asked questions and their answers.
Q: Who produces GERS?
A: GERS is produced by Scottish Government statisticians. It is designated as a National Statistics product, which means that it is produced independently of Scottish Ministers and has been assessed by the UK Statistics Authority as being produced in line with the Code of Practice for Statistics. This means the statistics have been found to meet user needs, to be methodologically sound, explained well and produced free of political interference.
Q: Why is public sector spending per person higher for Scotland in GERS?
A: Public sector spending in Scotland consists of spending on devolved services by the Scottish Government and local authorities, and spending on reserved services by the UK Government. For reserved spending such as public sector debt interest, international services, and defence, Scotland is allocated a population share of UK spending, and so spending per person on these areas is the same.
As such, spending per person for Scotland is higher primarily due to spending on devolved services. While there are no official estimates of how spending on devolved services compares in Scotland to other parts of the UK, analysis by bodies such as the Institute of Fiscal Studies[1] suggest that it is between 25% and 30% higher per person in Scotland. This is as a result of the Barnett formula, and slower population growth in Scotland.
Q: Why is non-North Sea public sector revenue per person lower in Scotland?
Excluding North Sea revenue, revenue per person is lower in Scotland. While for many revenues, revenue per person will be similar in Scotland to the UK, there are some exceptions to this. Revenues where Scotland’s share of UK revenue is relatively low are those associated with property or assets, such as capital gains tax (4.0%), and inheritance tax (4.7%), reflecting that in particular properties prices tend to be lower than the UK average.[2] Scotland’s share of income tax (6.7%) is also relatively low. In part, this reflects the shifting of income tax onto higher earners, through the introduction of the additional rate of income tax and increases in the personal allowance. Scotland has relatively fewer additional rate tax payers, with only around 4% of the UK total.
Q: Is GERS a description of the whole Scottish economy?
A: No. GERS reports only on public sector revenue and expenditure. Although these may be affected by economic performance, GERS does not directly report on Scotland’s wider economy. If users are interested in the measurement of the economy as a whole, they should refer to other economic statistics products, such as the quarterly Gross Domestic product figures or Quarterly National Accounts Scotland (QNAS) (Economy statistics - gov.scot (www.gov.scot)).
Q: How much interest expenditure does Scotland have in GERS?
A: GERS includes two categories of interest spending. The first is reserved UK debt interest, and Scotland is allocated a population share of this, amounting to £9.1 billion in 2022-23. The second is interest spending associated with public sector pension funds. These funds also generate interest income, and in 2022-23 Scotland is apportioned £1.8 billion of interest expenditure associated with public sector pensions, and £1.8 billion of interest income.
Q: How much spending occurs in Scotland?
A: As set out in the Preface, GERS shows spending for Scotland, rather than spending in Scotland. This shows that around 9.2% of UK spending is undertaken for Scotland, slightly higher than a population share. While direct estimates of spend in Scotland are not available, this is consistent with broader indicators of public sector activity in Scotland, which show that the public sector plays a larger role in Scotland than the UK as a whole. For example, around 10% of UK public sector employees are based in Scotland. Data from HMRC’s Real Time Information system suggests that 9.4% of paybill across public administration and defence, education, health and social care was spent in Scotland in 2022-23.
As GERS shows spending for Scotland, not all spending that occurs in Scotland is included in the GERS spending figures. For example, around £100 million of Scottish Government expenditure is not included GERS, as it is assumed to benefit residents outside of Scotland, such as spending on museums in Scotland which benefits visitors from the rest of the UK.
Q: What are accounting adjustments and why do they feature in the GERS estimates?
A: Accounting adjustments are used to present revenue and expenditure on a National Accounts basis, an international reporting standard used by governments. They normally reflect non-cash items, such as depreciation or pensions liabilities. In general, these adjustments do not affect the net fiscal balance or current budget balance, as they are added to both revenue and expenditure. In 2022-23, accounting adjustments added £8.3 billion to the estimate of Scottish public sector revenue and £7.8 billion to the estimate of Scottish public sector spending. For more information on accounting adjustments and where they appear in the revenue tables, see Table A.9.
Q: Do you use company headquarters to assign corporation tax or taxes like VAT or insurance?
A: No. Corporation tax on trading profits is estimated on a company-by-company basis, depending on the economic activity each company has in Scotland, not simply on the location of company headquarters. VAT, and other taxes such as those related to insurance activity, are related to expenditure, and are therefore estimated based on expenditure that occurs in Scotland, rather than the location of a company’s head office.
Q: How do taxes from the whisky industry feature in the GERS estimates?
A: Like any industry, the whisky industry’s activity in Scotland generates tax revenue through a range of sources, such as corporation tax on profits, income tax and national insurance contributions on staff earnings, and non-domestic rates payments on business premises. These are all captured in the estimates of Scottish public sector receipts reported in GERS.
In addition, whisky consumed in the UK is subject to VAT and alcohol duty. This is assigned to Scotland on the basis of how much is consumed in Scotland. Whisky which is exported does not generate UK VAT or alcohol duty. There is no export duty in the UK.
Contact
Email: economic.statistics@gov.scot