Assessing fisheries displacement by other licensed marine activities: good practice guidance
This project developed ‘Good Practice Guidance for Assessing Fisheries Displacement’ through a detailed literature review and consultation with the ScotMER Fish and Fisheries Receptor Group (FFSRG), commercial fisheries industry, offshore energy and regulatory sectors.
5 Good Practice Guidance: commercial fisheries data
This section of the Guidance provides recommendations for the sourcing, analysis and presentation of commercial fisheries data, which is required to inform commercial fisheries environmental baselines. These baselines inform fisheries displacement (and other impact) assessments.
5.1 Recommended data types and sources
International Council of the Exploration of the Sea (ICES) statistical rectangles are the smallest spatial unit used for the collection and analysis of fisheries statistics by the European Commission (EC) Member States, and the UK. ICES rectangles are approximately 900 NM2 and align to 30° latitude by 1° longitude. Although fishing activity is not evenly distributed across ICES rectangles and effort cannot be determined at finer scales within each rectangle (e.g. as the % overlap of a development with an ICES rectangle), it is suggested that fishing activity is described in relation to the ICES rectangles in which the development is expected to be located and any adjacent ICES rectangles as needed (the study area), with reference to wider sea areas regionally and nationally depending on the operational range of the fleet(s) in question to provide a description of activity in relation to other fishing grounds (i.e. proportional context).
No single source of data can be used to comprehensively describe commercial fishing activity, due to the inherent limitations of each data source, such as, variations in spatial scales, fleet coverage (e.g. under-10 m vessels) or whether the data provides quantified fishing activity or spatial distribution (or both). A robust description of commercial fishing activity therefore must be informed by several data sources, in combination with stakeholder consultation.
This Guidance provides a list of recommended sources intended to be relevant for EIAs for applications across UK waters. In consideration of the locations of OWFs being progressively more offshore, and therefore the commercial fishing fleets which are active within these areas having larger operational ranges, it has been recommended that Marine Management Organisation (MMO) data is used for commercial fisheries baselines to ensure UK wide coverage, relevant to these receptors. It is also verified and publicly available, so provides a consistent data source. Furthermore, this recommendation is also based on standard industry practice by EIA practitioners, however, it should be noted that the data sources used in commercial fisheries impact assessments are dependent on the location of the development and the commercial fisheries receptors identified as being relevant to the development during the EIA process. For instance, for some developments, the use of Marine Scotland data may be valuable to the assessment, either as an additional source or in replacement of some of the MMO datasets. Some regional or local datasets may also be available which could act as an additional data source for the commercial fisheries impact assessment. Further details on other commercial fisheries data sources are provided in Section 5.1.3.
For Welsh and Irish EIAs additional data sources may be required, but this Guidance can be used to inform which types of data would be needed for commercial fisheries assessment in these areas.
The data types and sources which are recommended to be used for conducting commercial fishing impact assessments are provided in Table 5‑1. The structure of a commercial fisheries baseline varies depending on the region, but in general it's often easier to present the data by category in the order they are presented below in Table 5‑1.
Box 2 – Study Area
The study area should include the ICES rectangle(s) that overlap(s) with the development and any adjacent rectangles, as needed. A wider study area may be evaluated for certain fisheries. For example, it is often assumed that smaller vessels are more likely to be displaced to the local area (potentially remaining within the same ICES rectangle), with larger vessels potentially being displaced to ICES rectangles further away. It should be noted that fishing vessel operators/owners may choose to change their home port in some instances and so smaller vessels may be displaced to grounds further away than their operational ranges (Seafish & UKFEN, 2012; ABPmer, 2017).
As a basic rule, the study area should consider the areas in which fishing effort may be relocated to. This requires consideration of operational range, attachment to home port and the availability of alternative grounds.
Table 5‑1 Recommended data sources to inform assessments of commercial fisheries displacement
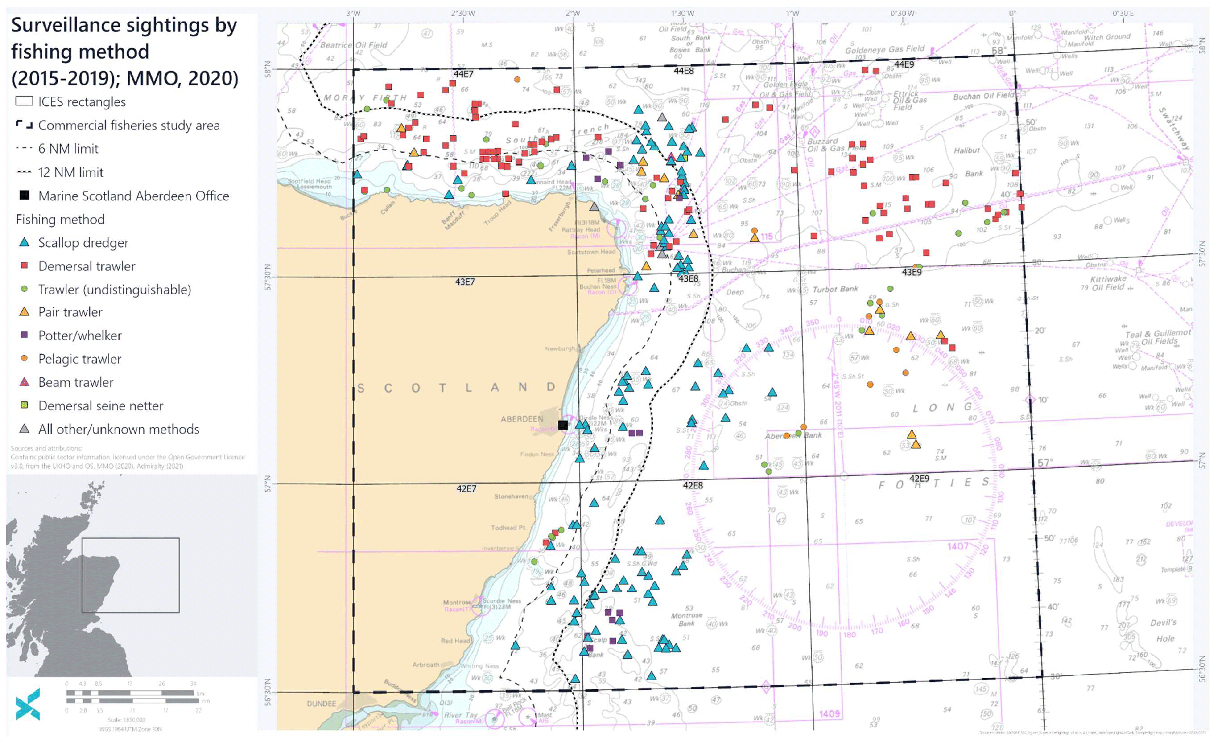
Figure number (Section 5.2): Figure 5.1
Source and data: MMO Surveillance Sightings
Description & key use in EIA: Sightings (visual observations) of fishing vessels recorded from aerial and vessel surveillance vessels in UK territorial waters.
Provides an indication of the distribution of fishing activity, fishing methods and nationality, but cannot be used to provide a quantitative assessment of fishing activity.
Limitations: Data is subject to survey effort (typically weekly and during daylight hours). There are also temporal gaps in sightings.
Fishing method and nationality is assigned by sight, and is not confirmed, due to the similarities of fishing vessels when gear is in operation (especially mobile gears), it should be assumed that they are indicative only.
Accessibility: Access via request under the Freedom of Information Act (FOIA) via the MMO master data register: accesstoinformation@marinemanagement.org.uk
Analysis section link: Section 5.1.2.1
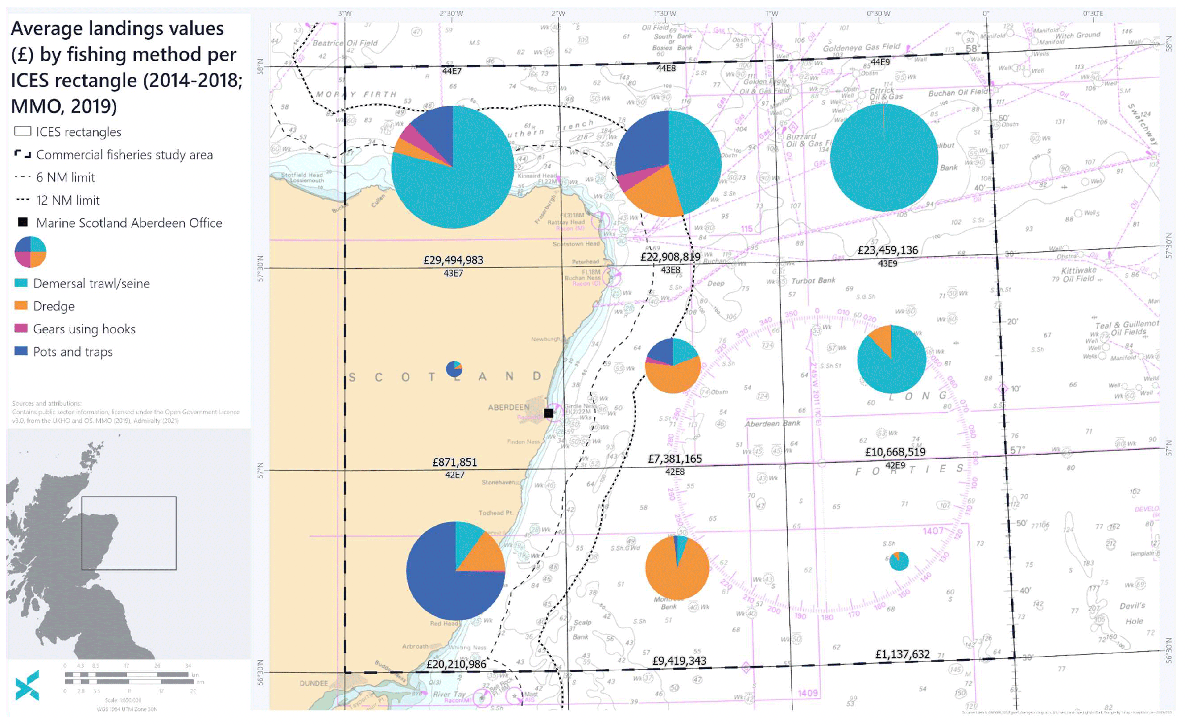
Figure number (Section 5.2): Figure 5.2
Source and data: MMO[11] Fisheries Statistics
Description & key use in EIA: Landings by value (£), effort (days) and weight (tonnes) sourced from logbooks, dockside inspections, landings declarations.
Provides fisheries statistics by vessel size, fishing method and species at ICES rectangle scale and can be analysed to determine annual and seasonal variation. These data do not provide any indication of the spatial distribution of fishing value or effort within each ICES rectangle.
The Registered Buyers and Sellers (RBS) Regulation should mean that all registered buyers have to provide sales notes and these data are incorporated into this dataset. These data will not be included if fishermen sell direct to the public and / or at quantities under the excepted limit within the RBS.
Limitations: Although data covers the under-10 m fleet, the monitoring systems for under-10 m vessels are not mandatory and so may not be representative of all activity
Data may misrepresent the fishing activity, depending on the size of the development / project, given the large spatial scale of the landings data.
Accessibility: As above
Analysis section link: Section 5.1.2.2
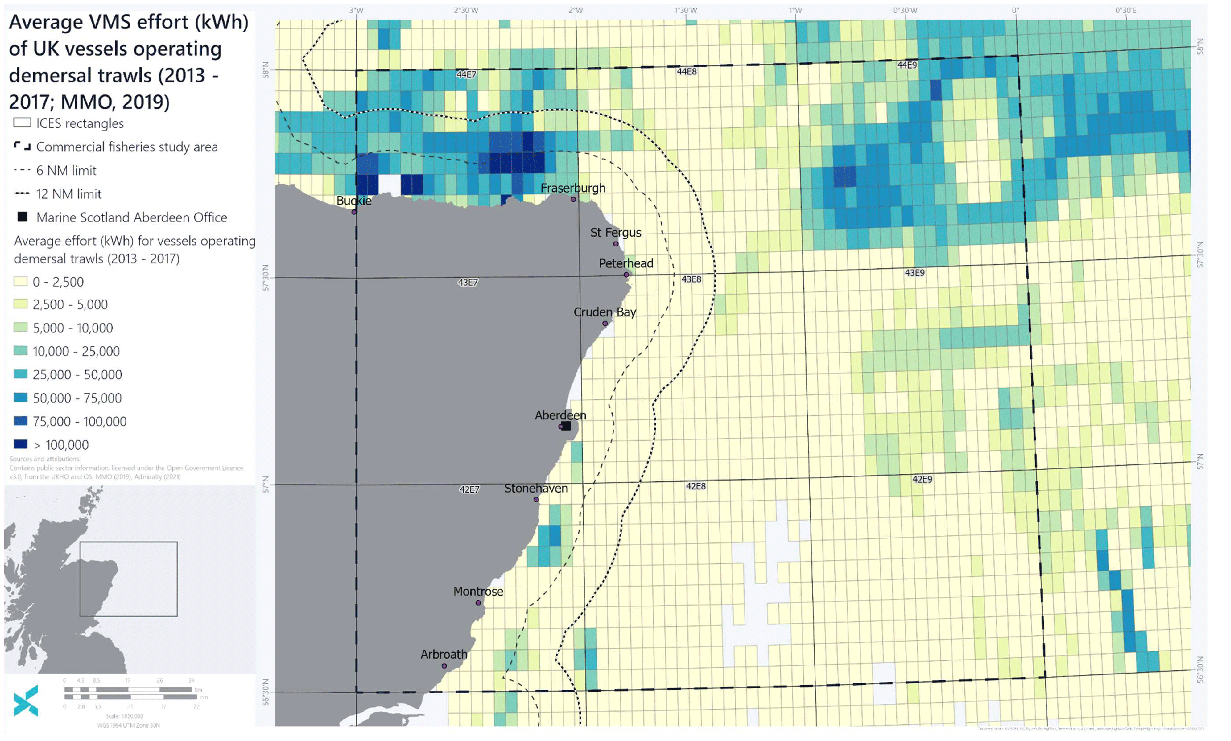
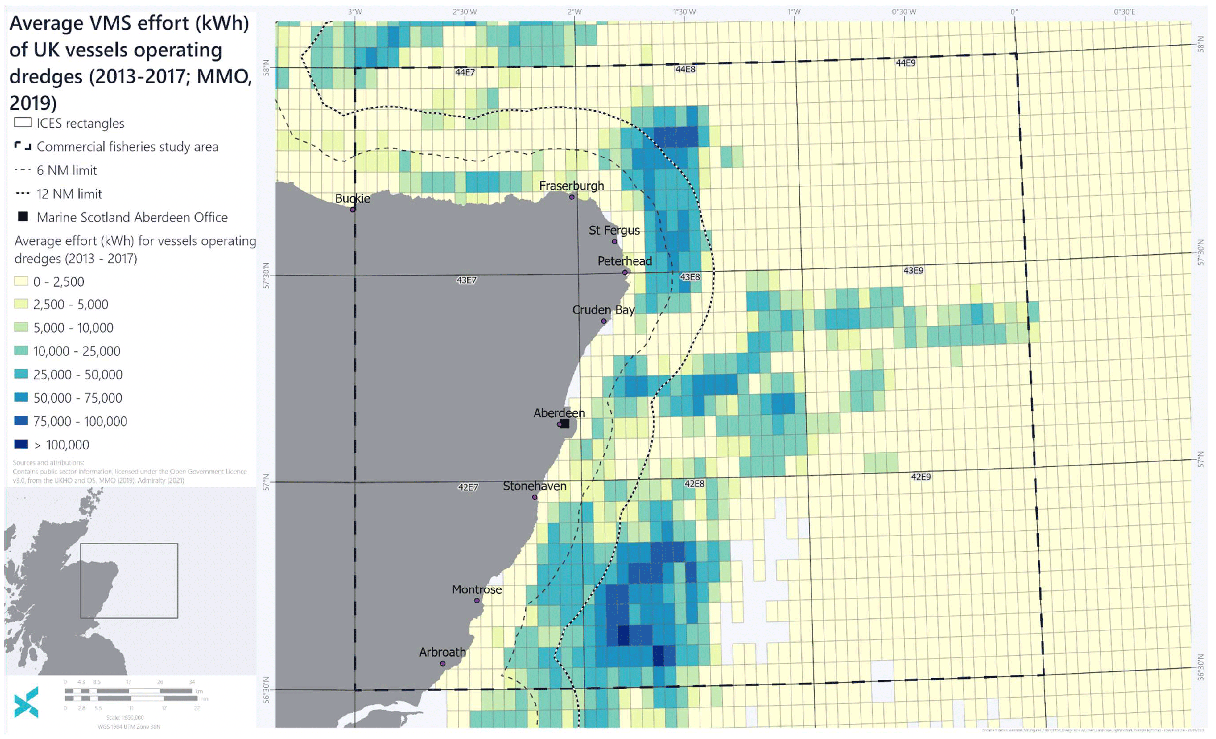
Figure number (Section 5.2): Figure 5.3 & Figure 5.4
Source and data: MMO Vessel Monitoring System (VMS)
Description & key use in EIA: Provides fishing effort (kW per hour) and value (£) for UK vessels (see limitations) through satellite tracking equipment which is cross-referenced with landings, engine power, and logbook data. The data is anonymised and presented in a 0.05° by 0.05° grid.
VMS data provides quantitative information on the spatial distribution of fishing activity.
Limitations: Rectangles with < 5 transmissions are not included within the dataset. Vessels of < 15 m in length are not represented in the dataset.
There is generally two or more years delay in data being published.
These data do not differentiate between vessels that are fishing or stationary / steaming (although it is filtered to include vessels travelling between 1 and 6 knots to limit the effect this has on the data).
Accessibility: As above
Analysis section link: Section 5.1.2.3
Figure number (Section 5.2): N/A
Source and data: Marine Scotland VMS
Description & key use in EIA: VMS data for demersal trawling, Nephrops trawling and dredging. The Marine Scotland VMS data is valuable for developments which overlap with Nephrops fishing grounds as there is a dedicated VMS dataset for Nephrops trawling, which is a subset of the bottom trawling dataset.
This dataset is a processed version of ICES / OSPAR gridded VMS data (described for Transboundary Data).
Limitations: Dataset includes 3 fishing methods only and is not updated annually. The data is provided in a web layer and so processing is limited and covers a relatively long time period (2009 – 2016 for bottom trawls and dredges and 2009 – 2017 for bottom trawls targeting Nephrops and crustaceans).
The limitations that apply to the MMO VMS data are similar to those for the Marine Scotland VMS data, such as only including coverage of vessels >15 m in length.
Accessibility: Available to download via NMPi at: Average intensity (hours) of fishing using ICES VMS data sets | Marine Scotland Information which is available via the National Marine Plan Interactive (NMPi) (Marine Scotland, 2021).
Analysis section link: Section 5.1.2.4
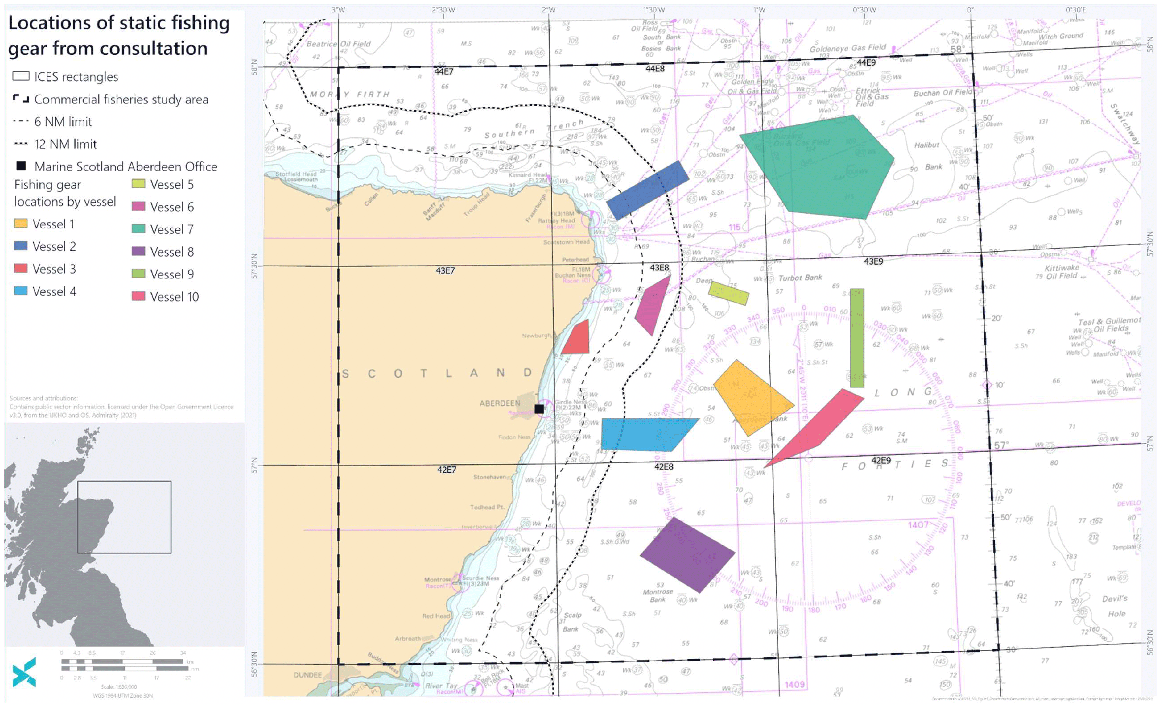
Figure number (Section 5.2): Figure 5.5
Source and data: Information of fishing grounds from consultation with fishing vessel operators / owners
Description & key use in EIA: Consultation is of paramount importance in development of a robust commercial fisheries baseline, in particular for the under-10 m fleets which are not consistently represented through other data sources.
Consultation data may include annotations of printed charts, photographs of on-board GPS plotters (taken or sent to the Fisheries Liaison Officer (FLO)). These data are anonymised and with permission granted prior to the use of the data.
These data provide further information on the distribution of fishing activity by fishing method, key species, seasonal trends and also offers an opportunity to receive early concerns and feedback from fisheries stakeholders.
Limitations: Inaccuracies may arise, as the data may be subject to human error.
Accessibility: Often obtained by the FLO, further information in Section 5.1.2.5
Analysis section link: Section 5.1.2.5
Figure number (Section 5.2): N/A
Source and data: MMO vessel lists
Description & key use in EIA: MMO vessels lists, updated monthly, are available for over-10 m and under-10 m vessels (MMO, 2021a, MMO, 2021b). The lists include details on the administrative port, home port, port letters and number, vessel name, registry and numbers, fish producer organisation, as well as details on vessel parameters including length, tonnage, engine power. The spreadsheet also identifies whether the vessel has a shellfish or scallop licence.
This dataset can be used to obtain information on vessel parameters which can be used to describe the sensitivity of a vessel to displacement (see Section 6.3.1).
Limitations: This dataset cannot be used to describe activity. Vessels may travel several kilometres from their home port and so this should not be used as a proxy for distribution.
Accessibility: Available for download at the following links: Vessel lists over 10 metres - GOV.UK (www.gov.uk) and Vessel lists 10 metres and under - GOV.UK (www.gov.uk)
Analysis section link: N/A
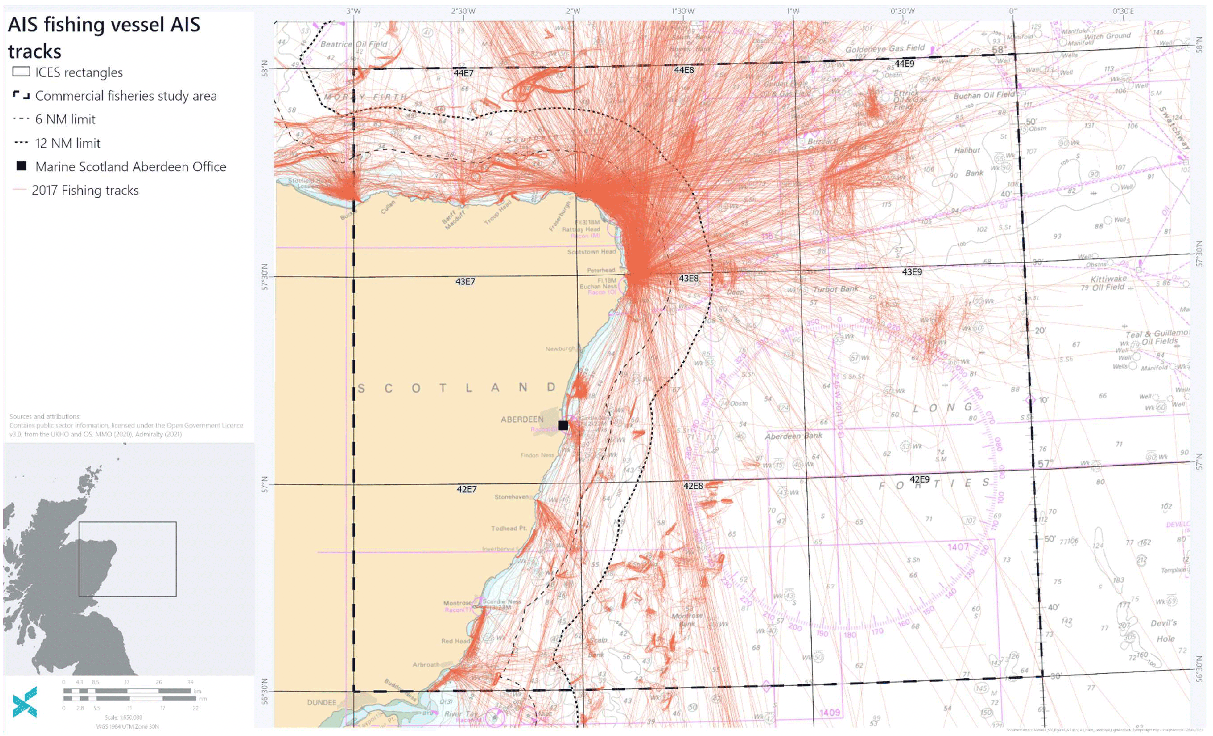
Figure number (Section 5.2): Figure 5.6
Source and data: Automatic Identification System (AIS) data (various sources)
Description & key use in EIA: All EU vessels > 15 m in length are required to have an AIS transponder which transmits details of the vessel's position, speed and course.
These data provide an indication of the spatial distribution of fishing activity.
Limitations: Vessels of < 15 m in length may not be represented in the dataset.
AIS data does not typically provide information on fishing method, and some errors in fishing vessel categorisation may be present.
Accessibility: Available via EMODnet (without the parameters needed to filter for speed) or via private AIS data holders (may incur a cost). AIS tracks and gridded AIS data are also available from the MMO.
Analysis section link: Section 5.1.2.6
Figure number (Section 5.2): N/A
Source and data: Transboundary (non-UK) Data
Description & key use in EIA: Non-UK fisheries statistics, VMS data, AIS data and consultation may be required with non-UK fleets if non-UK fishing vessels are understood to be active in the vicinity of the development and may be potentially sensitive to displacement of fishing activity or to the effects of secondary displacement.
Limitations: Similar limitations for fisheries statistics and VMS data as described above, depending on the source. VMS data from ICES does not provide information on nationality and so needs to be corroborated with another source. Vessels of < 12 m in length are not represented in this dataset.
Accessibility is the main constraint for transboundary data.
Accessibility: VMS effort data is available from ICES for most European fleets by method but not by nationality (i.e. overall fishing activity is shown for each method across the EU).[12]
Fisheries management organisations of the relevant non-UK countries should be contacted in order to obtain the most accurate and up to date information on fishing statistics, including landings value and effort and VMS, where available. There can be challenges in obtaining non-UK data, to avoid this it is recommended requests to the relevant organisations and data owners are issued ASAP at the start of the scoping.
Landings data for most EU member states are publicly available through the Scientific, Technical and Economic Committee for Fisheries (STECF).[13]
Analysis section link: N/A
5.1.1 Recommendations for data on under-10 m fishing vessels
Monitoring and management of the under-10 m fishing vessel fleet is an area of priority research and focus for Marine Scotland. Less data are available for the under-10 m fleet for commercial fisheries impact assessments when compared with the over-10 m fleet and fishing activity by these vessels is underrepresented. The MMO fisheries statistics include landings for the under-10 m fleet, however, reporting of landings is not mandatory in England for the under-10 m fleet. Also, the systems for tracking activity in Scotland by these vessels are in the process of being updated. Landings are recorded by sales notes, but this may not include detail on fishing methods, area from which catch is caught and therefore some details for monitoring the under-10 m fleet may require fishery officer input (e.g. ICES rectangles from which landings originate). In Scotland, vessels under-10 m that are not a member of a Producer Organisation (PO) also provide weekly Fish1 forms and this provides voyage information. Vessels between 10-12 m or under-10 m vessels in a PO, provide a paper logbook per voyage.
No VMS or AIS data are available for the under-10 m fleet. However, the Marine Scotland ScotMap dataset, available through NMPi,[14] presents spatial information on relative value and usage (number of fishing vessels and crew) for vessels under-15 m in length and was collected through face-to-face interviews with vessel owners and operators between 2007 and 2011. The commercial fisheries industry has confirmed that this is not thought to be representative of recent activity and therefore is not recommended for use in commercial fisheries baselines. Despite this caveat, this dataset can provide a starting point for the types of fisheries likely to be present but should not be solely relied upon to inform the commercial fisheries baseline.
As a result of the paucity in consistent quantitative data on recent activity by the under-10 m fleet, it is recommended that obtaining information on the fishing operating practices and fishing grounds (if required) for the under-10 m fleet is a focus of the consultation with national and local fishing organisations and representatives at an early stage of any assessment. Consultation should form a primary source of information for commercial fisheries baselines. In relation to static fishing gear, static fishing gear observation surveys may also be completed by developers to record locations of gear and their activity.
5.1.1.1 Future monitoring of the under-10 m fleet
In Scotland, the Scottish Inshore Fisheries Strategy 2015 aimed to implement an appropriate form of vessel monitoring for inshore vessels (Marine Scotland, 2015). This initiated an expansion of research into monitoring, and the Modernisation of the Inshore Fleet Programme involving vessel tracking and Remote Electronic Monitoring (REM) for inshore fleets, with varying technology being proposed for various fleets in relation to operational range, patterns of activity and environmental interactions. Further details on the objectives and commitments for REM monitoring are described in Scotland's Fisheries Management Strategy 2020 – 2030.[15] At the time of writing, REM is currently used on a voluntary basis by the scallop dredge fleet with the aim of this being implemented in legislation in 2022 and for this programme to be expanded to other fishing fleets beyond scallop dredges in subsequent years. 40 creel boats in the Outer Hebrides have also been equipped with low-cost REM technology which reports vessel position.[16] Depending on the accessibility of these data, this may be an additional resource to describe commercial fishing activity.
The data which will be collected as part of this programme may be used to inform commercial fisheries baselines in the future with careful consideration of confidentiality and respect for ground sensitivities. However, as the monitoring programme is currently in its early stages, it is unlikely that the monitoring data would be publicly available at a large enough scale for commercial fishing impact assessments for several years.
5.1.2 Data analysis
Please note there are limitations with each data source, provided in Table 5‑1 which must be considered before a source is used to inform baseline. The following section provides recommendations for how to process the various data sources prior to use within an EIA.
For most data spanning across multiple years, it is recommended that at least 5 years of data is analysed for the majority of fishing methods, where available. Data across this 5-year period should then be averaged to identify average fishing patterns which are less likely to be skewed by one particular year. The exception to this is fishing methods which are nomadic in nature with unpredictable fishing patterns, such as nomadic scallop dredges. For these fishing methods, 10 - 15 years of data should be obtained if possible, and 7 years at a minimum. The annual averages per year can also be analysed to determine inter-annual variation and this is especially valuable for fishing methods which are nomadic.
AIS data should cover 12 months to enable analysis seasonal variations.
Box 3 – COVID-19
EIA practitioners should be aware that due to potential impacts of COVID-19 on the fishing industry, data from 2020 and 2021 may not be representative of the commercial fisheries baseline. Use of data from this period alone might not reveal average fishing patterns which are typical for that area or receptor. Data from this period may also be confounded by potential impacts from Brexit.
5.1.2.1 Surveillance Sightings
These point data can be processed to present the total sightings over the time period provided, by fishing method and by nationality. If there are more than 10 fishing methods and nationalities which are shown in the map extent, just including the top 10 (i.e. in order of the highest number of sightings) with the remaining being categorised as 'all other methods' may improve the clarity of the figure. In the example, some fishing methods were pooled to limit error in classifications (Figure 5.1).
5.1.2.2 MMO Fisheries Statistics
The description of commercial fishing activity if using landings data should be based on an average over time per unit of area. Fisheries statistics are made available annually for the previous year. If using 5 years of data, annual averages by parameters such as vessel length, fishing method, species can be presented in bar graphs or plotted via GIS as shown in Figure 5.2. For species, it may be best to present the top ten (in terms of average value or effort) in the figures. Inter-annual or seasonal variation can also be analysed using the data, presented in bar graphs.
As noted above, for the majority of fishing methods, 5 years of data is sufficient. However, for fishing fleets with more unpredictable patterns of activity such as nomadic scallop dredgers (typically showing a 5-7 year cyclical pattern of activity) 10-15 years of landings data should be obtained, where available, to enable annual averages per year to be shown, and presented in a bar graph (e.g. see Brown and May Marine, 2018).
Box 4 – Marine Scotland Fisheries Statistics
Marine Scotland fisheries statistics can be analysed in a similar way to the MMO fisheries statistics. However, this dataset provides less detailed information on landings value, weights or effort by fishing method. Some ICES rectangles marked as 'disclosive' within the Marine Scotland dataset are also included within the MMO dataset. For the most comprehensive baseline using publicly available data, it is recommended that MMO fisheries statistics are used. This is particularly relevant if the project in question is further offshore than 12 Nautical Miles (NM) where transboundary and larger vessels with wider operational ranges may be present, increasing the overall spatial scale of data which is needed to be considered for coverage and perspective.
The use of MMO fisheries statistics in EIAs for renewables developments is common practice, even for Scottish developments, due to the advantages listed above.
5.1.2.3 MMO Vessel Monitoring System (VMS)
VMS data provide fishing activity data (effort, tonnes landed and value) which are obtained via mandatory satellite tracking to provide monitoring data of all vessels over-12 m in length throughout the EEZ, however, gridded data from the MMO is only available for over-15 m vessels.[17] Prior to the VMS data being released, position information is cross-referenced with logbook data to provide data in values and / or effort (kWh).[18] The tracking data are filtered to remove stationary vessels in port, or those which are transiting (i.e. speeds between 1 and 6 knots are included only). These data are anonymised and provided as a total for each year per grid squares which are 0.05° x 0.05° within ICES rectangles (approx. 4.5 nm2). Further information on the MMO VMS data can be found on the MMO website.[19]
Once obtained following the process outlined above, these VMS data should be averaged to show average activity annually, as presented in Figure 5.3 and Figure 5.4. For commercial fisheries baselines it is recommended that a combination of value and effort VMS data are shown, with VMS effort being potentially more relevant to fisheries displacement specifically, due to this being associated with a relocation of fishing pressure. VMS data are the most comprehensive source of data on fishing activity by vessels over-15 m in length and should always be included in commercial fisheries baselines which include vessels of this size.
5.1.2.4 Marine Scotland VMS
The VMS data available through the Marine Scotland NMPi can be downloaded directly as separate GIS layers, so can be easily imported to GIS figures.
The key differences between the Marine Scotland VMS and the MMO VMS data are that the MMO VMS data include a greater number of fishing methods and by value and effort. Marine Scotland VMS data are available for Nephrops trawling, bottom trawling and dredging, and by effort only.
The Marine Scotland VMS data are valuable in providing a finer scale indication of where Nephrops trawling is expected to occur. For example, where Nephrops trawling is expected to occur, the Marine Scotland VMS data should be reviewed and compared with the MMO VMS data to identify the areas where Nephropstrawling occurs vs demersal trawling for other species.
5.1.2.5 Consultation data
The FLO or EIA consultant (sometimes fulfilled by the same person) with expansive knowledge of fishing, with key support from any Fisheries Industry Representatives (FIRs), should carry out consultation as early as possible.[20] FIRs are usually nominated to represent an area by local fishermen and are essential to maintaining relationships and ensuring data coverage is comprehensive. In some instances, the FLO may be involved in the commercial fisheries assessment, however, this varies by project.
The type of consultation data which are provided will depend on the fishing methods which are operated in the study area, and the technology on board the vessels. Consultation data may also allow for the identification of emerging fishing methods.
Further details and recommendations for consultation are provided in Section 6.2.1.
5.1.2.6 AIS data
The International Maritime Organization (IMO) requires all vessels over-15 m to carry and operate an AIS transponder on board, to monitor their position, speed and course.
AIS data provide point data which shows a time series of a vessel's position which can be converted to lines to indicate vessel tracks. The data normally provide vessel categories, enabling just fishing vessels to be selected and shown. AIS data do not provide information on activity values or effort, but provide an indication of where fishing vessels are, and if filtered by speed (between 1 and 6 knots as defined in Lee et al (2010) and typically seen in other datasets) can provide some information on the distribution of what is assumed to be fishing activity.[21] It should be noted that AIS data may not provide constant vessel tracks if the transmitter is not permanently switched on.
5.1.3 Other data
As mentioned in Section 5.1, the recommended sources identified above are not exhaustive and represent the key sources of commercial fisheries data which should be drawn on for a commercial fisheries baseline. However, other data sources may be valuable to the assessment, depending on the location, project design parameters and the commercial fisheries present within the study area. These additional sources include but are not limited to:
- Site-specific data, such as static fishing gear observation surveys, which can be used to record locations of gear and their activity and corroborate available information and data;
- National fisheries statistics reports, such as the Scottish Sea Fisheries Statistics 2019;[22]
- MMO landings data by port (note these landings cannot be attributed to ICES rectangles);
- Transboundary data or information from the North Sea Advisory Council;
- Regional data reports, such as Shetland Fisheries Statistics 2019;[23]
- ICES species stock assessments and survey data; and
- Regional mapped data, for instance the NAFC Marine Centre maps for shellfish creel and dredging grounds in Shetland presented within the Shetland Islands Marine Region State of the Environment Assessment[24] and available to view on NMPi.
Additional sources of data may also be identified through consultation.
5.2 Commercial fisheries data presentation
This section provides examples of how the commercial fisheries data listed in Section 5.1 can be presented. It is recommended where possible that figures are used as opposed to tables or text. The parameters which are selected for use in an EIA and the analysis which is carried out should be relevant to the location and project description of the development and the commercial fishing activity in the area of study (e.g. depending on fisheries characteristics and project design). The Figures shown in Section 5.2.1 are indicative only.
As described in Section 5.1, the data should be presented and described in a logical format and structure, going from a high level of detail to a finer scale. Surveillance sightings and fisheries statistics should be presented and described first. Surveillance sightings data provides an indication of the relative spatial distribution of fishing activity by method and nationality, but cannot be used to provide a quantitative assessment of fishing activity, due to the limitations presented in Table 5‑1. The fisheries statistics provide detail on effort and value by fishing method, vessel length and species and can also be used to determine annual or seasonal variations. However, these data do not provide any indication of the distribution of activity within each ICES rectangle. VMS data, consultation and AIS data should be described to provide an indication of the spatial distribution of fishing effort within the study area and in each ICES rectangle, corroborating the fisheries statistics and surveillance sightings data. It is important that a holistic approach is taken and that all the data are considered together to provide an accurate baseline for commercial fisheries and to clearly understand the receptors that should be considered in the impact assessment.
In order to make figures as clear as possible to commercial fisheries stakeholders, mapping outputs should employ the WGS1984 datum and relevant Universal Transverse Mercator (UTM) zone if a projection is used. Whether or not the map is presented in geographic or projected space, coordinates on the grid / graticule should include geographic latitude and longitude values (in WGS1984), presented as either Degrees Decimal Minutes (DDM) or Degrees Minutes Seconds (DMS). For all figures which are presenting commercial fisheries data labeled ICES rectangles, the 6 NM inshore and 12 NM territorial limits, and a NM scale bar should be shown. If possible, an admiralty chart[25] should be used as a basemap, unless this make the data less distinguishable (e.g. for VMS figures).
5.2.1 Good Practice Guidance: presentation of commercial fisheries data
Contact
Email: ScotMER@gov.scot