Fair Work Action Plan 2022 and Anti-Racist Employment Strategy 2022: Fairer Scotland duty assessment
Fairer Scotland Duty Assessment (FSDA) of the Fair Work Action Plan 2022 and Anti-Racist Employment Strategy 2022.
Appendix D Evidence and key issues
D.1 Socio-economic disadvantage overview
In broad terms, socio-economic disadvantage means living on a low income compared to others in Scotland, with little or no accumulated wealth, which can lead to greater material deprivation, and restricting the ability to access basic goods and services. Tackling socioeconomic disadvantage itself through minimising child and adult poverty is key for sustainable and inclusive economic growth. National trends indicate that income poverty disproportionally impacts groups who face existing structural disadvantages, including disabled people, women, and specific ethnic groups[85]. This can lead to poor health and wellbeing outcomes, and detrimentally affect the equality of opportunity a person experiences.
This sub-section summarises some of the key issues and evidence relating to socio-economic disadvantage in relation to the RAP and ARES. It is important to note that socio-economic disadvantage is a society-wide issue and those who face it are not one homogenous group. It is inherently intersectional and has the potential to affect individuals irrespective of their characteristics. Nevertheless, some protected characteristics do disproportionately face socio-economic disadvantage. For example, disabled people[86] (disabled women[87]), women, and certain racialised minorities groups[88]. This is also true for some communities of place where the location in which someone lives can contribute to socio-economic disadvantage being exacerbated, such as rural and island communities. This assessment has taken a holistic approach, aiming to identify intersectionality between socio-economic disadvantage, protected characteristics groups, and island communities.
D.2 Low income
Low income is a key driver of a range of negative outcomes and can be defined in multiple ways. Primarily, low income can be considered through the lens of poverty including:
- Relative poverty - individuals living in households whose equivalised income is below 60% of UK median income in the same year
- Absolute poverty - individuals living in households whose equivalised income is below 60% of inflation adjusted UK median income in 2010/11)[89]
- Persistent poverty - where households live in poverty for 3 years out of 4[90]
Since the pandemic, 4 in 10 households have become categorised as low income, the effect of which means people are going without essentials, are unable to pay utility bills, and no longer have the option to save money[91]. Figure 3-1 shows the change in percentage of people living in relative poverty since the mid-to-late 1990s in Scotland:
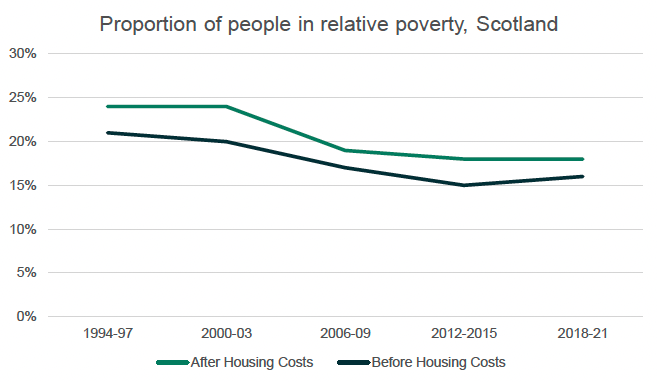
This highlights, while the most recent estimate is unreliable, the undoubted financial strain vast numbers of people in Scotland are feeling, proportions of people in relative poverty have increased slightly over the past 5 years, despite generally decreasing over time. While the most recent estimate of rates of absolute poverty are also considered to be unreliable, a longer-term decline can be demonstrated, as displayed in Figure 3-2:
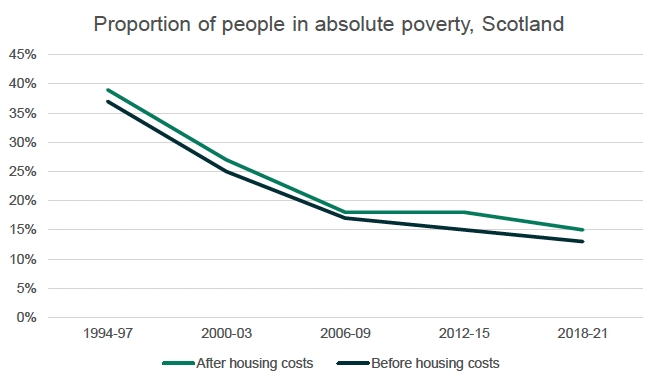
Absolute poverty rates have fallen faster than relative poverty rates, likely due to targeted Government interventions, such as increased benefits provision for struggling families, as well as falling median incomes in recent years. Ultimately, these figures point to the complex nature of the driving factors behind socio-economic disadvantage, and that it is imperative not to oversimplify its causes and how it impacts different groups in different ways. For example, there is significant intersectionality between socio-economic disadvantage and gender given the gendered experience of poverty. Despite official statistics showing broadly similar rates of poverty between men and women, this is largely a function of looking at household poverty – in which women's and men's incomes can often be considered together as joint incomes. While poverty is measured at household level for good reason, because the living standard of an individual may depend on the income of other members of the household (say for example a non-working person may live with a high earning partner, with both having a high standard of living) there is also the potential to conceal key differences, not least women's lower pay, greater likelihood of part-time working and care responsibilities, and the gender pay gap.
Intersectionality of socio-economic disadvantage, poverty, and age is also key to consider – children are more likely to be in poverty across all measures compared to adults. Since the pandemic, a range of families at risk of poverty in Scotland have been identified through Best Start, Bright Futures, the Scottish Government's child poverty delivery plan, these include; single-parent households, families with a baby, and families with a young mother (under the age of 25). The financial strain of raising children can be detrimental to many households. In addition, the ongoing impacts of the pandemic and the current cost of living crisis is having effects on mental health for families. 69% of single parent families, and four in five families with a baby have reported a negative impact on their mental health[94]. Figure 3-3 highlights the proportion of children in Scotland experiencing relative poverty since the mid-to-late 1990s:
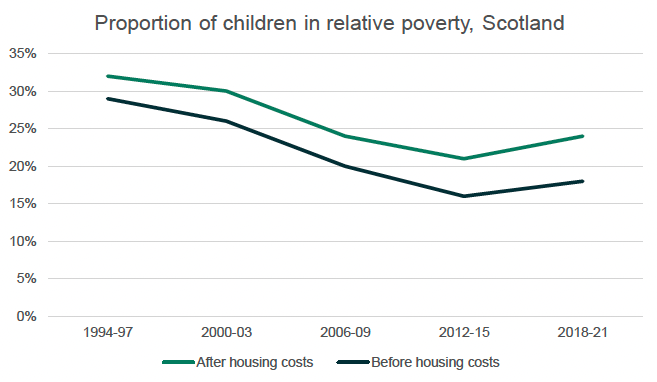
Relative child poverty rates dropped to their lowest around 2012-15, but have been climbing since, the pandemic being the critical cause for this increase. Somewhat expectantly, the figure broadly reflects Figure 3-1 and the patterns seen in the relative poverty figures for Scotland as a whole.
When considering ethnicity, child poverty rates become even more disproportionately spread, in 2021 48% of Scottish children from racialised minorities were living in relative poverty[96]. These increasing proportions are also true for absolute child poverty as highlighted below:
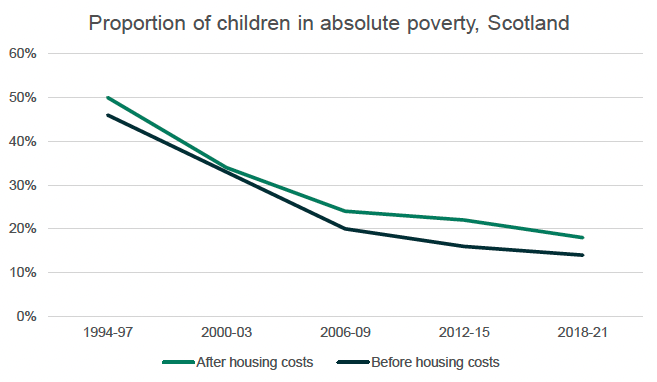
Intersectionality of low income and ethnicity is also a common theme in the UK and Scotland. Between 2016/17 and 2018/19, people from Pakistani and Bangladeshi ethnic groups had the lowest median weekly household incomes (£334 and £365 respectively), while people from White and Indian ethnic groups had the highest (£518 and £538 respectively)[98]. Low incomes for racialised minorities can be due to lower wages, higher unemployment rates, higher rates of part-time work, and larger household sizes[99]
The above Figures highlight how efforts made to improve benefits, social security and labour market progression are being reflected in increasingly lower proportions of adults and children experiencing poverty. However, recent social upheaval threatens to jeopardise this progress, and indeed this has already begun to happen with some families experiencing economic difficulties leading to negative social outcomes.
D.3 Real Living Wage
The real Living Wage (rLW) is an hourly rate of pay established by the Living Wage Foundation which employers can voluntarily commit to. It is £10.90 across the UK, and £11.95 in London for people aged 18 or over. Unlike the UK Government's minimum wage ('National Living Wage' for over 23s – £9.50), the real Living Wage is the only wage rate independently calculated based on living costs. It is a voluntary base rate for employers who wish to go beyond the government minimum to demonstrate that they value their lowest paid staff. Living Wage employers pay all their directly employed staff aged 18 and over – as well as in scope regular third-party contractors – at or above the real Living Wage. It represents a means through which the poorest families and households in Scottish society may avoid poverty and the associated stressors it can cause.
At present, according to the Employer Directory in Scotland there are 1,649 real Living Wage employers, with concentrations seen in large cities such as Edinburgh and Glasgow.[100]
Research from the Living Wage Foundation (2017) revealed that out of the 840 employers surveyed across the UK (201 in Scotland) who pay their employees the real Living Wage, 75% reported an increased motivation and retention rates of employees and a 25% drop in absenteeism.[101] The Living Wage Foundation (2017) also reported that 93% of students want to work for employers who pay at least the real Living Wage.
Social Enterprise Scotland has also demonstrated the potential outcomes of paying the real Living Wage:[102]
- Over 57,000 workers currently employed by over 2,800 Living Wage employers in Scotland will receive a welcome pay boost because of the new rate; and
- As a result of rate increase, a full-time worker on the real Living Wage will earn £1,950 a year more than their current pay.
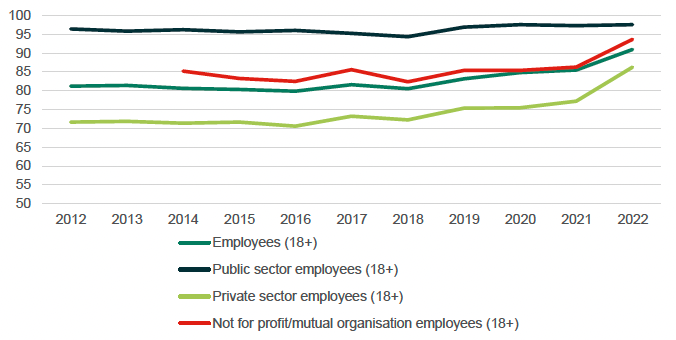
Figure 3-4 below reveals the percentage of employees (18+) earning at least the real Living Wage in Scotland between 2012-2022, across all employees, public sector employees, private sector employees and employees within not for profit or mutual organisations.
Between 2012 and 2020, records for all employees (18+) reveal that 9.8% more employees were paid at least the real Living Wage by 2022 and 14.6% in the private sector. While only 1.1% more employees (18+) in the public sector were paid the real Living Wage or more by 2022.
Data for the third sector is only available for 2015-2022, during which time a further 10.4% of employees (18+) earnt the real Living Wage or more.
D.4 Zero Hours Contracts
A zero-hour contract exists when an employer is not obliged to provide employees with a minimum number of working hours. Between 2018-2019, statistics showed that the number of people working zero-hour contracts grew by 10% to over 70,000, however, the UK government as well as Scottish groups such as Citizens Advice Scotland have become increasingly conscientious of the potential negative implications zero-hour contracts can have. For people from a low socio-economic background, uncertainty on working patterns and when income can be expected can lead to stress and financial difficulties[104].
Inappropriate use of these contracts can instil distrust, insecurity and low performance and productivity in the workforce.[105] Employees require regular work to secure a consistent income stream to fund financial commitments. This ultimately reduces stress surrounding monies and increases focus on productivity.
Thereby, the benefits of excluding the use of zero hours contracts include:
- Lower staff turnover and recruitment expenses;
- Lower rates of staff absenteeism because of reduced stress levels;
- Increased productivity; and
- Improved employer reputation.
No inappropriate use of zero hours contracts is included in the Scottish Business Pledge to encourage employee's contribution to Scotland becoming a leading Fair Work Nation.
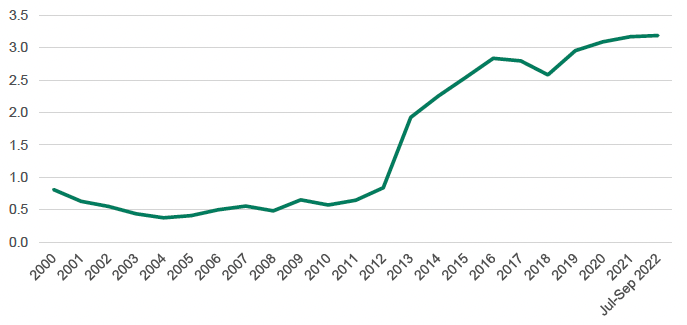
While disaggregated data for Scotland is not available, the percentage of people in zero hours contract employment in the UK has been on the rise since 2011 from 0.6% to 3.2% in July-September 2022 (as shown in figure 3-5).
D.5 Low / no wealth
Access to wealth is a key factor that can protect people from socio-economic disadvantage. Conversely, lack of or no wealth is a driving factor behind generational socio-economic disadvantage. Wealth refers to an individual or group's money and/or material assets that have built up over time (Public Health Scotland, 2021). For example, financial products, assets, equity from housing, and pension savings. Accessible savings can help households deal with problems that arise on a day-to-day basis.
Certain households are more likely to have above average wealth, for example pensioner couples, married couples, and households with degree-level qualifications. Whereas lone parent households, those in social rented housing, and households where the household reference person is unemployed or economically inactive tend to have below average wealth.
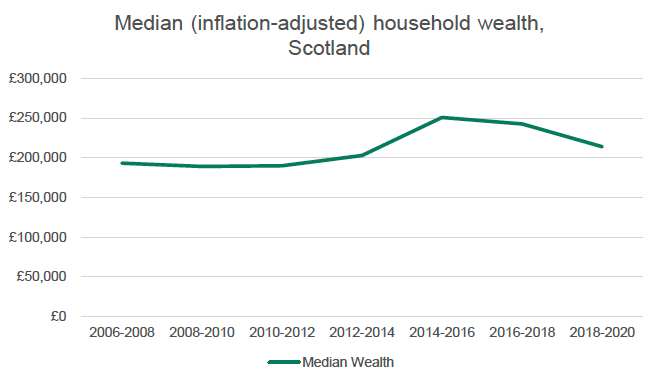
The latest Scottish data available on wealth was collected between 2018-2020, prior to the first national COVID lockdown. The exact impact of COVID on wealth and debt is therefore difficult to adjudicate at this stage, however, it is unlikely that pre-existing disparities in wealth were remedied over the course of the pandemic. In 2018-2020, a typical Scottish household had £214,000 of total wealth, which represents a broadly similar median figure to 2006-2008 when data collection began, as Figure 3-6 highlights:
Moreover, the distribution of wealth in Scotland is highly unequal with the wealthiest 2% of all households having 18% of the nation's wealth. Conversely, the bottom 2% of households had less than 1% of the wealth. Disaggregating Scottish household wealth into deciles reveals the extent of disparity between the most and least wealthy - the top 10% of households having on average £1.7 million in total wealth, compared to the bottom 10% having £7,600. Further analysis reveals that, when assessing financial wealth alone (so, not counting physical wealth which includes property, belongings etc.), then the bottom 30% of Scottish households are in debt. The effect of low wealth is that it lessens the chances that future generations will be able to break the cycle of socio-economic disadvantage, as insufficient wealth is able to be passed on that will increase the likelihood of upward social mobility.
There is significant intersectionality between wealth and age. A younger household (age categorisation is based off the age of the adult with the highest income) is less likely to have much or even any pension or property wealth, with most wealth being made up of their belongings (physical wealth). Over the course of someone's lifetime, they will typically accumulate more wealth through paying off a property mortgage and acquiring pensions savings. Figures 3-7 to 3-10 highlight the median household wealth by type of wealth and age in Scotland (2018-2020):
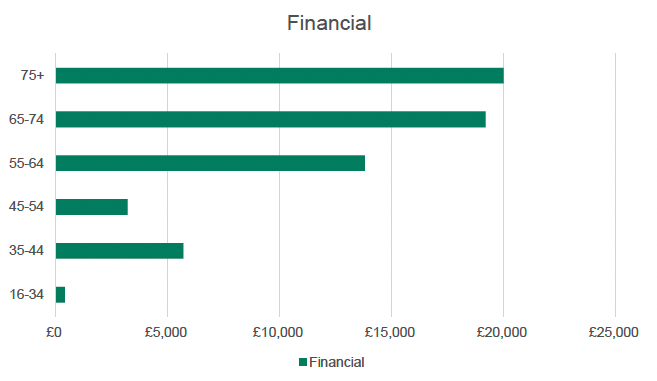
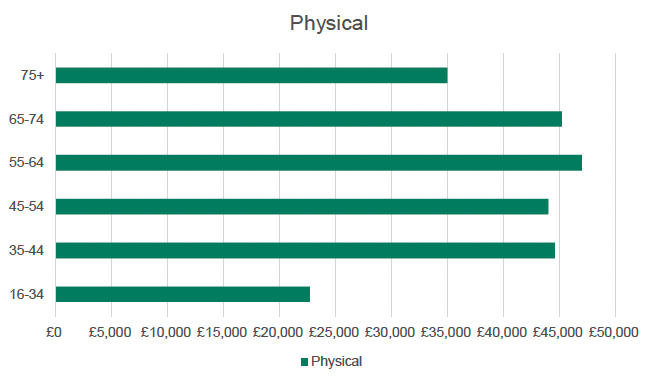
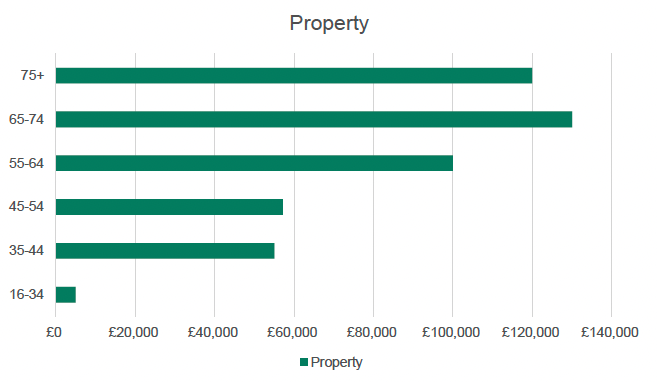
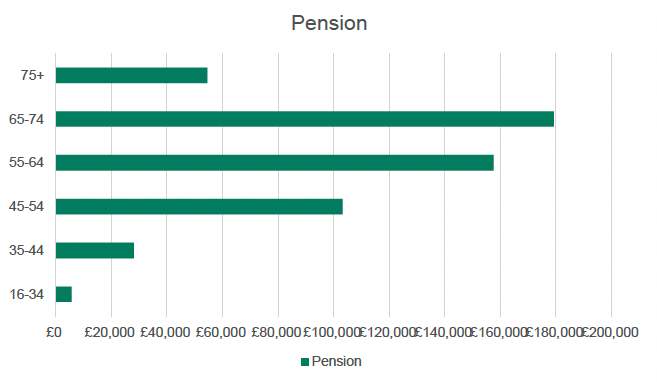
Particularly when young people are looking to develop their financial and physical wealth in the early part of their working life, payment of the real Living Wage may constitute a significant enabler towards these ends.
D.6 Material deprivation
Material deprivation is an additional way of measuring living standards and refers to the self-reported inability of individuals or households to afford goods and activities that are typical in society at a given point in time, irrespective of whether they would choose to have these items, even if they could afford them[112]. There is a key line of intersectionality between socio-economic disadvantage in the form of material deprivation, and children and pensioner households.
In terms of children, the pandemic exemplified how disadvantaged households may disproportionately suffer due to material deprivation. Reliance on remote working highlighted how disadvantaged children and young people, who lacked access to suitable working spaces, IT hardware and broadband services at home, found homework more challenging, and this then negatively impacted the pre-existing attainment gap.[113]
Material deprivation and low income are complexly linked. In fact, combined material deprivation and low income is used as a metric to measure child poverty in Scotland, the exact definition of this metric being 'living in a household with below 70% of median incomes in that year, plus whose parents want but cannot afford specific goods or services for their children or for themselves (such as a holiday away from home once a year, or bedrooms for every child aged 10+ of a different gender)'.[114] Some households will be on a low income but still have the basic necessities they need to get by. For example, they may have built up over time, or have family and friends to help them out. Contrastingly, some households will be unable to afford basic things despite having a higher income, this might be due to pre-existing debt, or if the household lead has recently started a new job after a period of unemployment. However, there are many cases where material deprivation and low income are not mutually exclusive, and severe child material deprivation, coupled with low income, has been on the rise over the last decade as highlighted by figure 3-11:
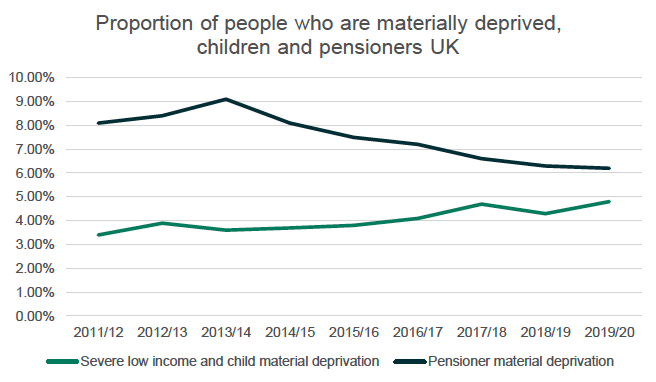
The declining proportion of pensioners experiencing material deprivation is likely a reflection of the declining proportions of people living in relative and absolute poverty in society.
There is also intersectionality between material deprivation and other protected characteristics groups. Black and minority ethnic families for example tend to have more children in the UK[116], which therefore means more resources are required to meet their basic needs. This factor coupled with the ethnicity pay gap[117] highlights the multi-faceted causes of socio-economic disadvantage, and that many families, or children born into those families, are pre-disposed to be potential adverse effects.
D.7 Area deprivation
Area deprivation refers to the possibility that living in a deprived area can exacerbate negative outcomes for individuals and households already affected by issues of low income. Those areas that have consistently been in the 5% most deprived in Scotland faces historic and ongoing socio-economic challenges. The Scottish Index of Multiple Deprivation presents a relative measure of deprivation across 6,976 small areas (called data zones). If an area is identified as 'deprived', this can relate to people having a low income, but it can also mean fewer resources or opportunities[118]. In Scotland, the least deprived area is in Stockbridge, Edinburgh, the most deprived area is in Greenock town centre. The area with the largest local share of deprived areas was Inverclyde, with 45% of data zones among the 20% most deprived areas in Scotland, Glasgow City has similar deprivation levels at 44%.
However, socio-economic disadvantage is not always experienced in neat concentrations of people in recognisable communities. For example, over half of people on low income do not live in the 20% most deprived areas in Scotland. In some instances, therefore, it is necessary to consider deprivation as it affects communities of place or communities of interest.
'Communities of place' refers to people who are bound together because of where they reside, work, visit or otherwise spend a continuous portion of their time. For example, people rural, remote and island areas face a particular set of circumstances which exacerbate disadvantage. Poorer people in those areas will have different experiences from better-off residents, but also from poorer people living in cities. Poverty is often hidden in smaller, rural, and/or island communities; cost of living and accessibility of transport, education, and employment impact more negatively on rural populations. According to research done by the Highlands and Islands Enterprise, an economic and community development agency for the north and west of Scotland, budgets that households need to achieve a minimum acceptable standard of living in remote rural Scotland are typically 10-40 percent higher than elsewhere in the UK. This premium is greatest for single people and families supporting children.[119]
'Communities of interest' can refer to groups of people who share an experience. For example, consideration of the impact of strategic decisions on people who have experienced homelessness, or the care system, may help develop a deeper understanding of possible socio-economic impacts. Those who share one or more of the protected characteristics listed in the Equality Act 2010 can also be considered communities of interest. Those who share an identity – for example, lone parents – can similarly be communities of interest too.[120]
D.8 Socio-economic background
Socio-economic background represents a mechanism by which disadvantage can persist across generations, essentially it refers to the structural disadvantage that can occur due to a parent's education, employment, and income. Low socio-economic background can be a causal factor behind higher rates of student absenteeism and low educational attainment[121], poor physical and mental health[122][123], and lack of social mobility[124]. In terms of education and social mobility, low socio-economic background can result in lesser networking opportunities, lack of knowledge around employment opportunities, and reduced confidence in one's own abilities.