Farm salmon escape event: levels of farm/wild hybridisation
Results of a genetic survey to examine levels of farm/wild hybrid salmon in rivers local to a large-scale farm escape in in south west Scotland and north east England. This occurred in 2020 when MOWI’s Carradale North fish farm shifted position after its seabed anchors became dislodged during Storm Ellen.
Levels of introgression as measured in simulated first generation (F1) hybrids
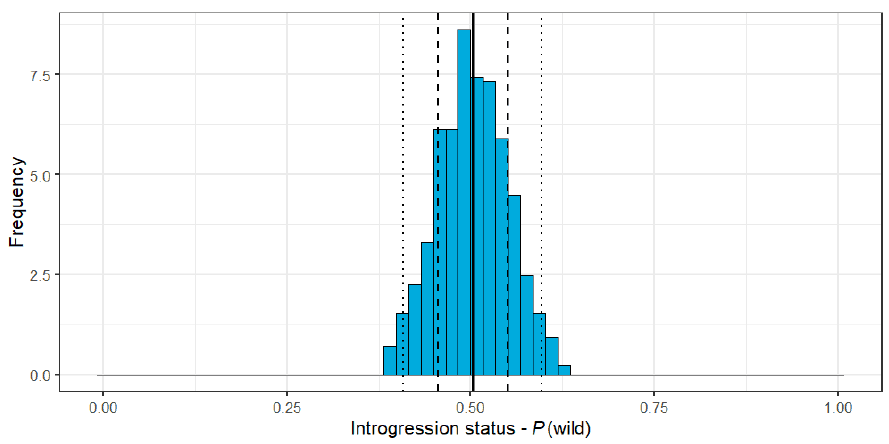
Individual P(wild) values for the 500 in silico generated F1 hybrid fish can be seen to have a distribution with a mean of 0.503 and standard deviation (SD) of 0.047 (Figure 3). Identification of F1 fish in the Scottish wild collected samples was thus undertaken using the mean ± two SD of the simulated F1 fish, which resulted in confidence bounds which spanned from 0.409 to 0.597.
Levels of introgression of wild fish
Introgression in Scotland
Examination of the P(wild) values across both years in Scotland (Figure 4) identified a single F1 fish. This was a fish from 2020 from the river Clyde that had a P(wild) value of 0.5. No F1 fish were detected in 2021.
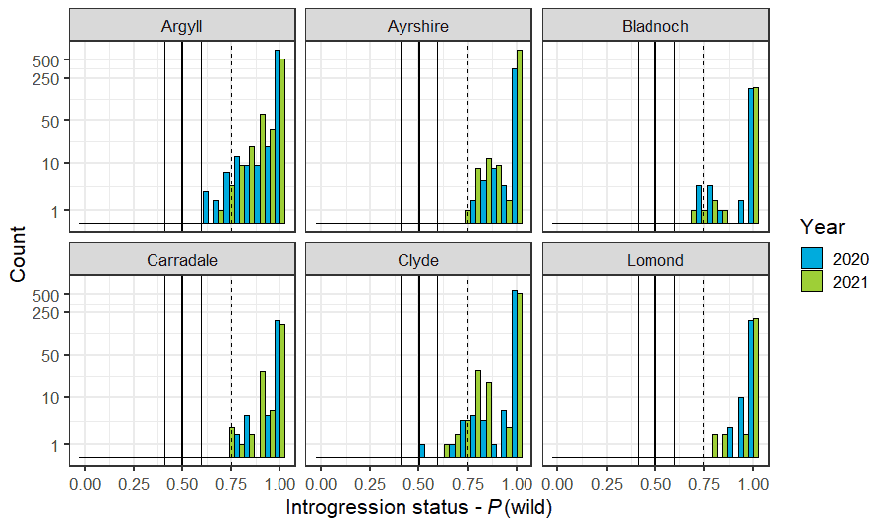
Twelve and fifteen fish in 2020 and 2021, respectively, had P(wild) values below the cut-off used by Gilbey et al. (2021) to identify farm/wild hybrid fish (Table 3). These proportions of hybrid fish are similar to those previously found in the areas under investigation here (Gilbey et al., 2021).
| Area | River | Site | Latitude | Longitude | P(wild) |
|---|---|---|---|---|---|
| 2020 | |||||
| Argyll | Glen Rosa Water | CarGenArgyllAdhoc_001 | 55.59401 | -5.18084 | 0.692 |
| Argyll | Lusragan Burn | CarGen_Argyll_059 | 56.43569 | -5.39851 | 0.609 |
| Argyll | River Creran | CarGenArgyllAdhoc_007 | 56.56396 | -5.23203 | 0.690 |
| Argyll | River Creran | CarGenArgyllAdhoc_007 | 56.56396 | -5.23203 | 0.726 |
| Argyll | River Creran | CarGenArgyllAdhoc_006 | 56.58804 | -5.19216 | 0.744 |
| Argyll | River Fyne | CarGenArgyllAdhoc_005 | 56.28921 | -4.89669 | 0.616 |
| Argyll | River Shira | CarGen_Argyll_076 | 56.29638 | -5.00610 | 0.638 |
| Clyde | River Kelvin | CarGen_Adhoc_Clyde_008 | 55.90655 | -4.31539 | 0.526 |
| Clyde | River Kelvin | CarGen_Clyde_172 | 55.93929 | -4.33814 | 0.676 |
| Clyde | River Kelvin | CarGen_Clyde_170 | 55.98858 | -4.24113 | 0.745 |
| Clyde | River Leven | CarGen_Clyde_161 | 56.02686 | -4.67677 | 0.721 |
| Galloway | River Bladnoch | CarGen_Adhoc_Galloway_001 | 54.8554 | -4.53795 | 0.714 |
| 2021 | |||||
| Galloway | River Bladnoch | CarGen_Adhoc_Galloway_005 | 54.92281 | -4.60209 | 0.719 |
| Argyll | River Eachaig | CarGen_Argyll_047 | 56.14867 | -5.05116 | 0.715 |
| Argyll | River Eachaig | CarGen_Argyll_047 | 56.14867 | -5.05116 | 0.744 |
| Argyll | River Fyne | CarGenArgyllAdhoc_005 | 56.28921 | -4.89669 | 0.679 |
| Argyll | River Ruel | CarGenArgyllAdhoc_009 | 55.99864 | -5.21408 | 0.724 |
| Ayrshire | Water Of Girvan | CarGen_Ayrshire_111 | 55.31707 | -4.57661 | 0.736 |
| Carradale | Machrie Water | CarGen_Carradale_028 | 55.56547 | -5.26877 | 0.747 |
| Clyde | River Clyde | CarGen_Clyde_165 | 55.67757 | -4.02746 | 0.621 |
| Clyde | River Clyde | CarGen_Clyde_165 | 55.67757 | -4.02746 | 0.707 |
| Clyde | River Clyde | CarGen_Clyde_196 | 55.95109 | -4.33743 | 0.713 |
| Clyde | River Clyde | CarGen_Clyde_165 | 55.67757 | -4.02746 | 0.723 |
| Clyde | River Clyde | CarGen_Adhoc_Clyde_010 | 55.73413 | -3.98817 | 0.731 |
| Clyde | River Kelvin | CarGen_Clyde_191 | 55.96901 | -4.19301 | 0.682 |
| Galloway | River Bladnoch | CarGen_Adhoc_Galloway_005 | 54.92281 | -4.60209 | 0.708 |
| Galloway | River Bladnoch | CarGen_Adhoc_Galloway_004 | 54.95613 | -4.72664 | 0.744 |
Introgression in England
The same F1 identification confidence bounds were used for the fish from English rivers as were used for the Scottish sample. However, it must be remembered that all wild reference samples used here were based on individuals collected from Scotland. These represented the most relevant available reference fish and had been chosen such that the influence of any wild phylogeographic structure across the whole country was minimised. Thus, even though there were no wild English fish in the reference samples, there is no reason to expect that the results would be influenced to a significant degree.
There was a single fish whose P(Wild) fell just below the lower bound used to identify F1 fish. The fish was from the Aglionby Crosby site on the river Eden (Lat. 54.923169, Long. -2.8732639) and had a P(wild) value of 0.369. This was also the only fish with a P(wild) value below the cut-off used by Gilbey et al. (2021) to identify farm/wild hybrid fish.
Contact
Email: David.Morris@gov.scot