Third Sector Resilience Fund: evaluation
Findings of an evaluation of the Third Sector Resilience Fund, announced by the Scottish Government in March 2020 and designed to provide emergency funding to third sector organisations which were struggling financially following the outbreak of the COVID-19 pandemic.
2. Distribution of the funding
2.1 Overall funding summary
In total, 3,466 applications were made for TSRF funding, with these applications coming from 2,906 organisations.
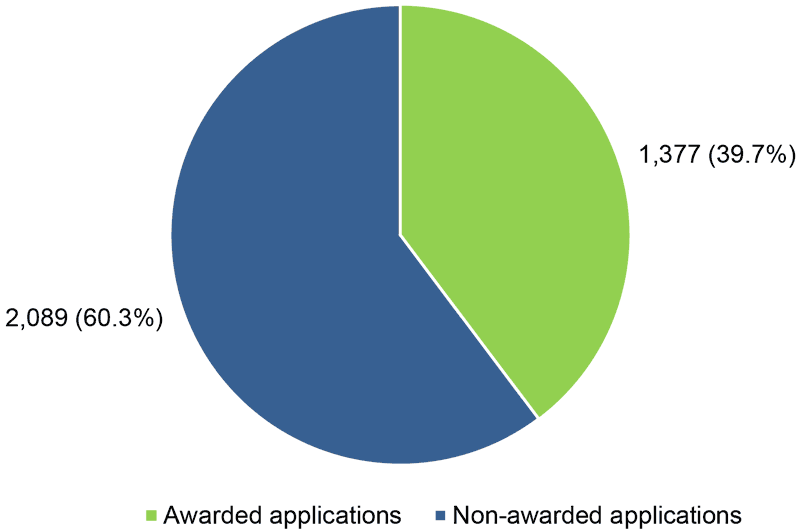
A total of 1,377 applications were approved for funding, with an overall £22,608,610 being distributed amongst 1,371 organisations. Six organisations received two awards.
As Figure 1 illustrates, 39.7% of all applications were approved for funding. While the maximum value of grants awarded was £100,000, the average award size was much lower (£16,419), reflecting the large number of smaller organisations applying to the Fund.
A comparison of the number of organisations applying to the Fund (2,906) with the number that were awarded funding (1,371) indicates that 47.2% of all applicant organisations received funding.
Four hundred and sixty-seven organisations (16.1% of all organisations submitting applications) applied more than once to the Fund, with some submitting subsequent applications on the basis of feedback and support following an initially unsuccessful application. Of these 467 organisations:
- four organisations applied for funding five times
- 11 organisations applied four times
- 59 organisations applied three times
- 393 organisations applied twice.
Three hundred and eleven organisations that submitted multiple applications to the fund had at least one application approved for funding.[4] This represents two thirds (66.6%) of all 467 organisations submitting multiple applications. When compared with the overall success rate for all organisations applying to the Fund (which, as mentioned previously, was 47.2%), it is clear that organisations were more likely to be successful if they applied more than once.
2.2 Grant funding by sector
Applicants were asked to provide details about the sector in which they operate. This data is summarised in Table 1, alongside a breakdown of the applications and awards made within each sector.[5]
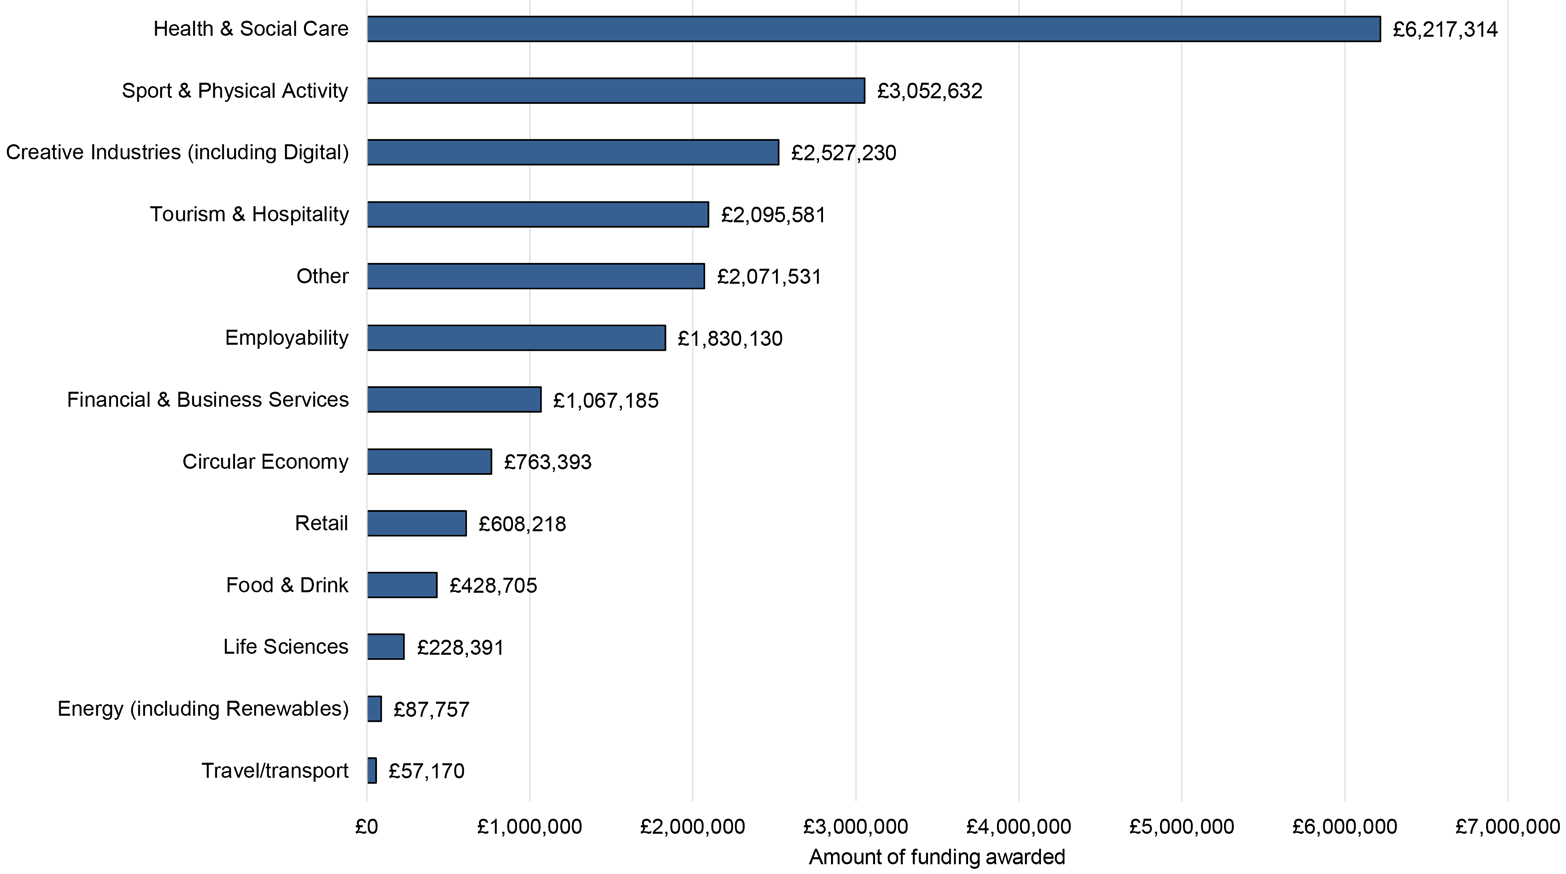
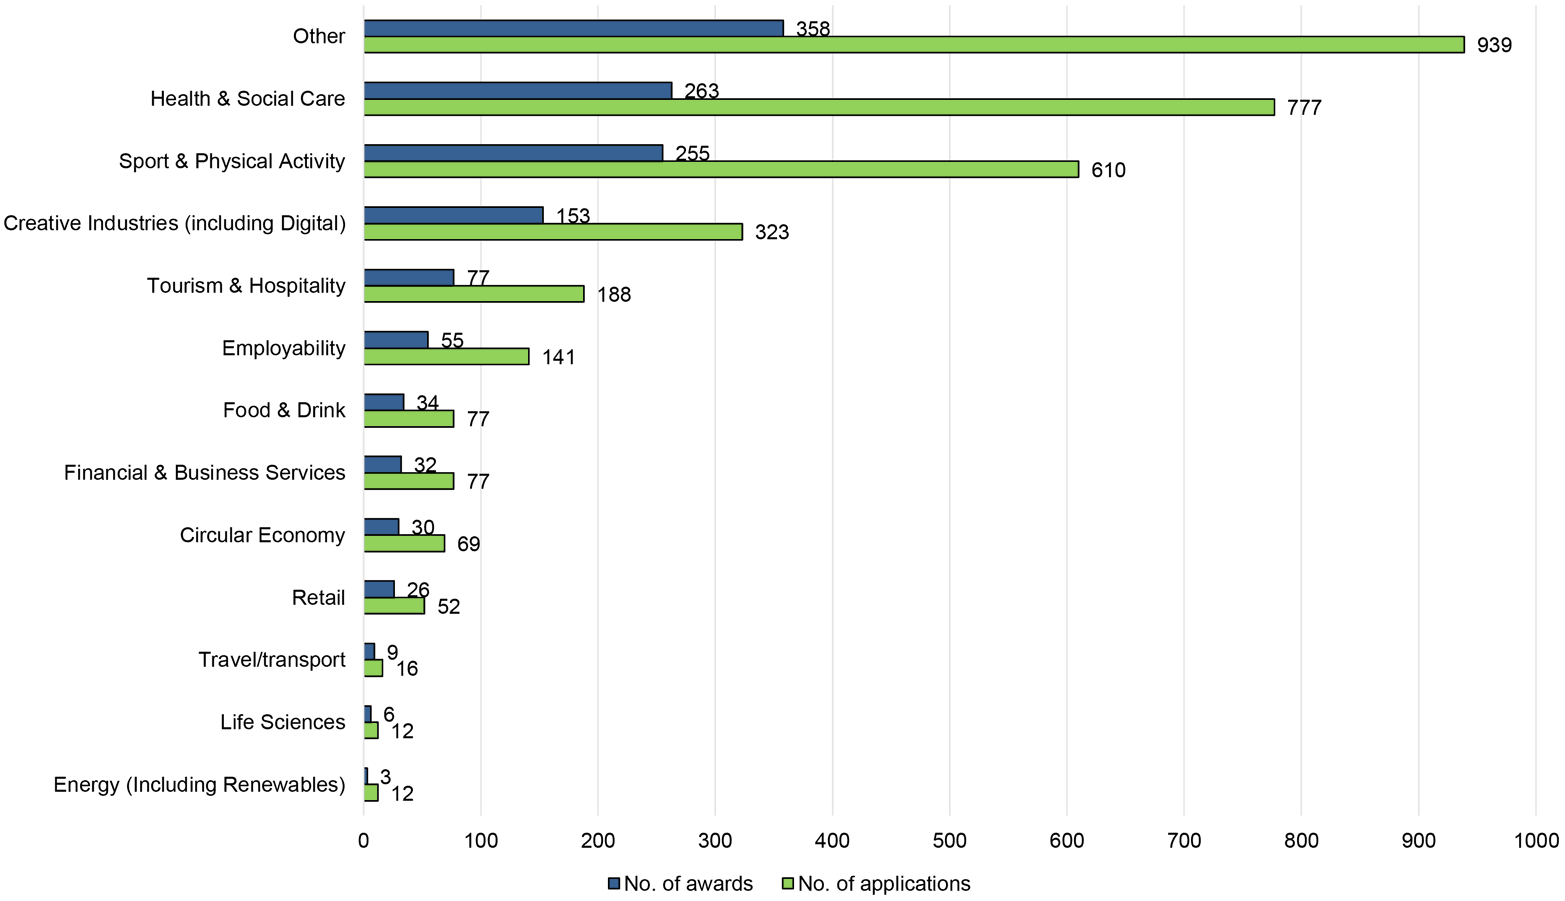
The Health and Social Care sector received the largest share (£6,217,314, or 29.6%) of all TSRF funding awarded. This sector also accounted for the second-largest numbers of applications (777) and awards (263).
The second-largest share of funding (£3,052,632, or 14.5%) was awarded to the Sport and Physical Activity sector. This sector accounted for the third-highest numbers of applications (610) and awards (255).
The largest number of applications (939) and also the largest number of awards approved (358) were from organisations that did not select a specific sector from the options provided in the application form and instead classified their sector as “Other”. These organisations included a significant number of TSOs that defined themselves as working on community development or as community groups and social clubs; other types of organisations that chose the ‘other’ category included some focusing on children’s activities, education, religion/faith, training and animal welfare. “Other” organisations also accounted for the fifth-largest share of the funding (£2,071,531). On average, grants awarded to organisations that said they worked in “other” sectors were for £5,786, significantly smaller than the overall average of £16,169.
The three sectors receiving the smallest shares of funding – Life Sciences, Energy, and Travel/transport – submitted the fewest applications and had the fewest awards approved.
| Sector | No. of applications | No. of awards | % of applications approved | Amount awarded | % of funding awarded | Average award size |
|---|---|---|---|---|---|---|
| Circular Economy | 69 | 30 | 43.5% | £763,393 | 3.6% | £25,446 |
| Creative Industries (incl. Digital) | 323 | 153 | 47.4% | £2,527,230 | 12.0% | £16,518 |
| Employability | 141 | 55 | 39.0% | £1,830,130 | 8.7% | £33,275 |
| Energy (Including Renewables) | 12 | 3 | 25.0% | £87,757 | 0.4% | £29,252 |
| Financial & Business Services | 77 | 32 | 41.6% | £1,067,185 | 5.1% | £33,350 |
| Food & Drink | 77 | 34 | 44.2% | £428,705 | 2.0% | £12,609 |
| Health & Social Care | 777 | 263 | 33.8% | £6,217,314 | 29.6% | £23,640 |
| Life Sciences | 12 | 6 | 50.0% | £228,391 | 1.1% | £38,065 |
| Retail | 52 | 26 | 50.0% | £608,218 | 2.9% | £23,393 |
| Sport & Physical Activity | 610 | 255 | 41.8% | £3,052,632 | 14.5% | £11,971 |
| Tourism & Hospitality | 188 | 77 | 41.0% | £2,095,581 | 10.0% | £27,215 |
| Travel/transport | 16 | 9 | 56.3% | £57,170 | 0.3% | £6,352 |
| Other | 939 | 358 | 38.1% | £2,071,531 | 9.8% | £5,786 |
| Total | 3,293 | 1,301 | 39.5% | £21,035,236 | 100.0% | £16,169 |
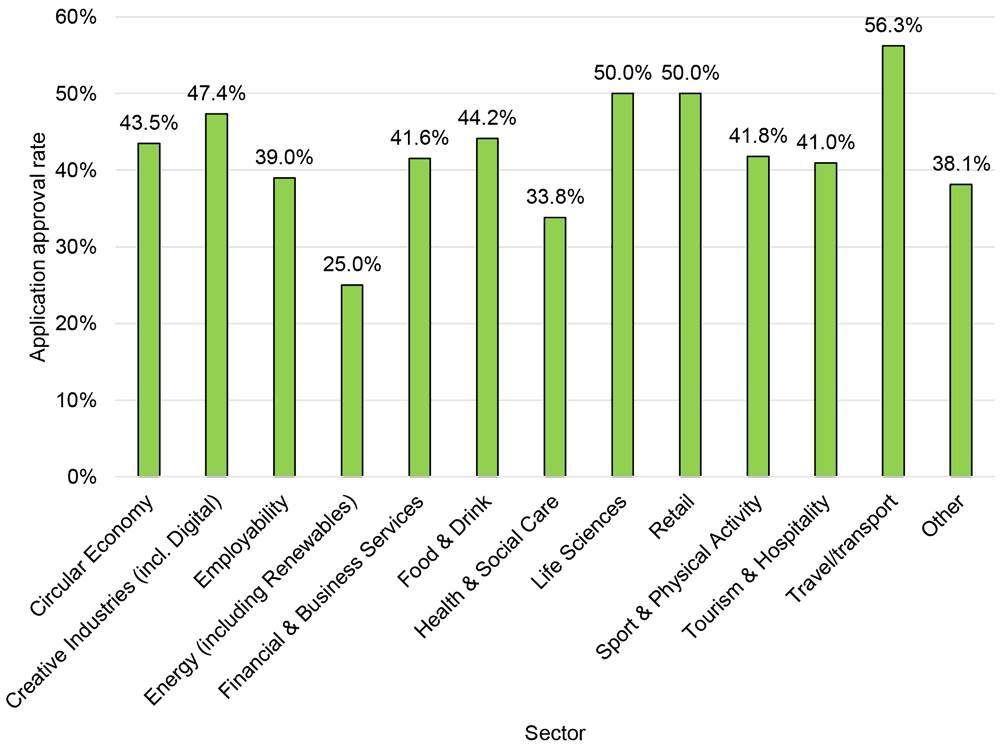
As Figure 4 shows, the application approval rate for organisations working in different sectors ranged from 25.0% of applications approved to 56.3% of applications approved. The sector with the highest application approval rate was Travel/transport with 56.3% of applications approved – however, it is important to note the relatively small numbers of applications (16) and awards (9) within this sector.
Despite accounting for the largest share of funding, the Health and Social Care sector had the second-lowest application approval rating (33.8%), with Energy having the lowest (25.0%).
2.3 Funding by geographical location
As part of the application process, applicants were asked to identify where their organisation predominantly operates; applicants could either identify a single local authority area or indicate that they operated across Scotland. In some cases where applicants did not provide this information, postcode data provided elsewhere on the form was used to assume a primary local authority location.
There may be some error in the location data arising from two factors:
1. The possibility that some organisations operating across more than one local authority area may have specified one particular local authority as their primary location, whereas others will have identified themselves as “Scotland-wide”.
2. For organisations where the analysis has used the postcode of the organisational address to derive the local authority area, this is only an assumption about the area of operations of the organisation.
Accordingly, the data presented in this section should be seen as an indication of the distribution of funding across local authority areas.[6]
The largest share of funding (27.3%) went to organisations that were operating across Scotland (£6,175,942).
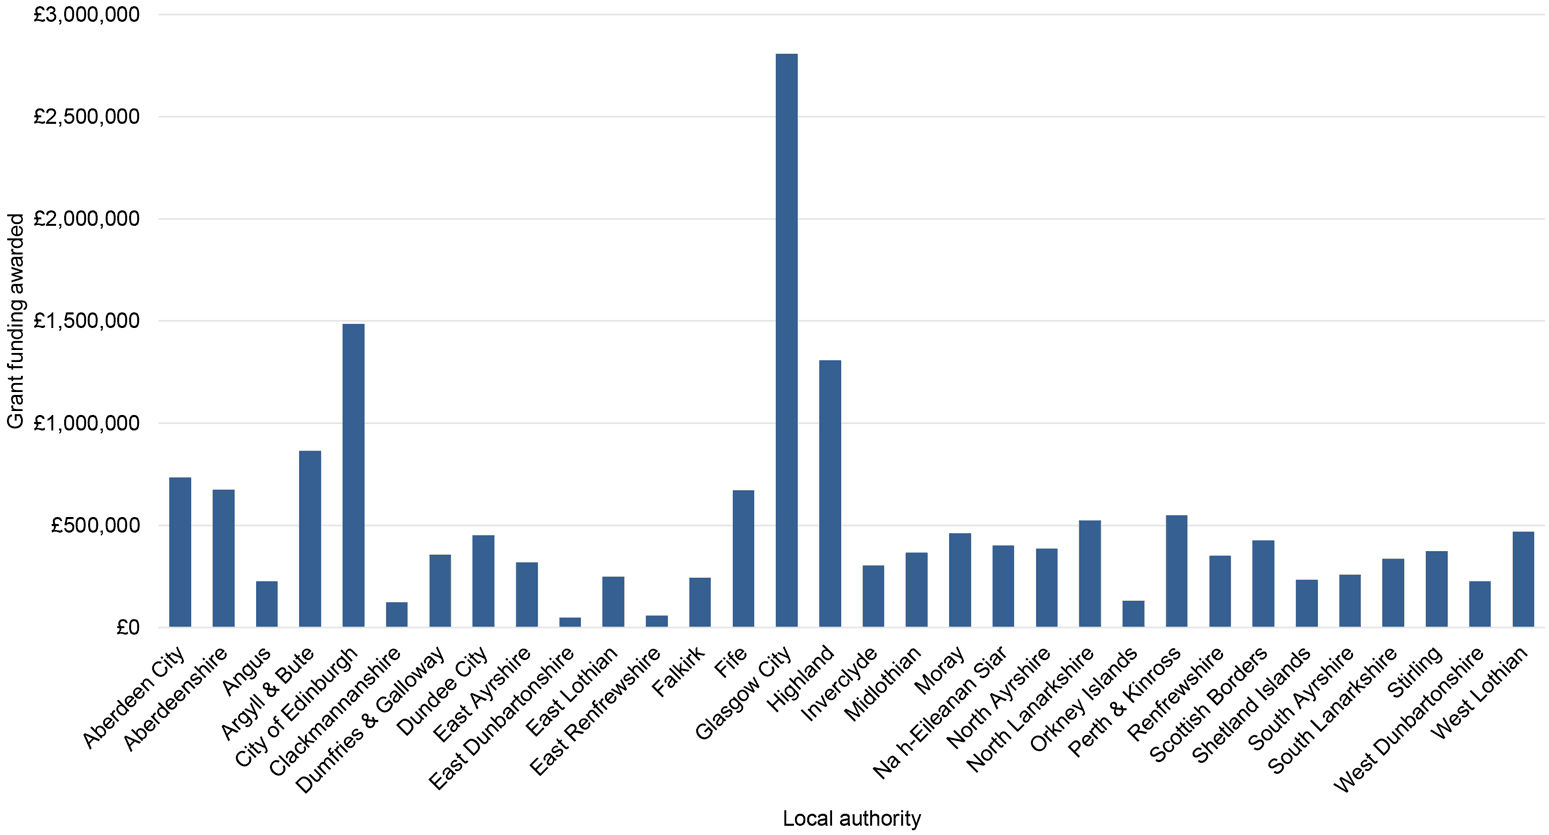
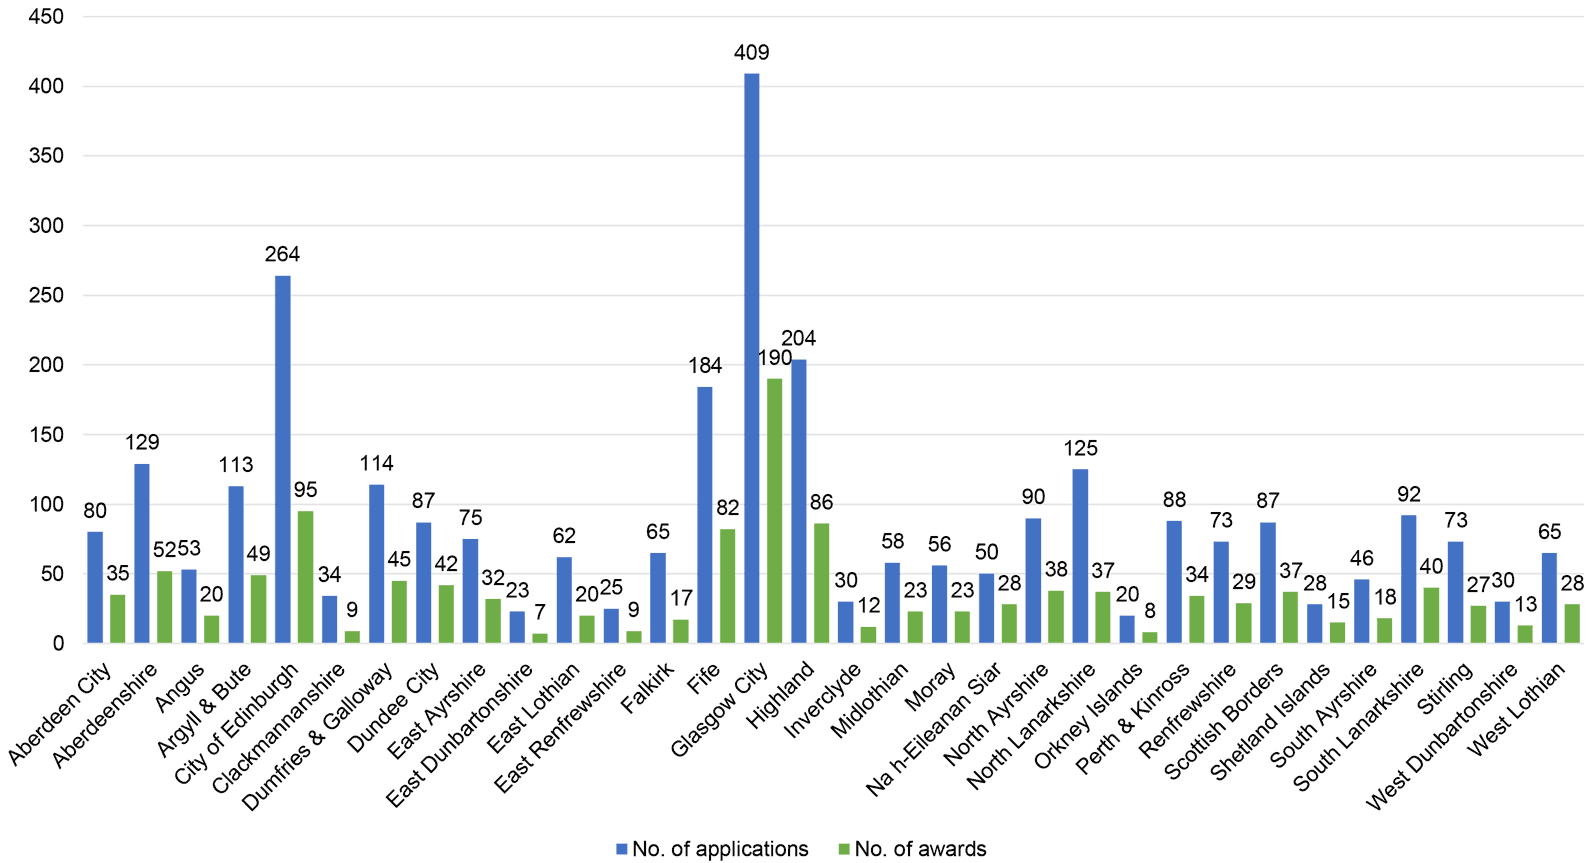
The remaining 72.7% of funding that went to organisations indicating that they operated in a specific local authority area. Figure 5 provides a breakdown of the funding awarded to organisations operating in each local authority. Figure 6 provides similar information in relation to the number of applications and awards in each local authority.
Figures 5 and 6 show that applications from organisations indicating that they operated in Glasgow City (£2,807,451, or 17.1%), City of Edinburgh (£1,486,608; 9.0%), and Highland (£1,308,803; 8.0%) accounted for the largest shares of TSRF funding. These areas also accounted for the highest numbers of applications (409, 264 and 204 applications respectively) and the highest numbers of awards (190, 95 and 86). This is not particularly surprising given that, according to 2018 data from the Scottish Council for Voluntary Organisations (SCVO), these three areas have the highest numbers of TSOs of all local authority areas in Scotland.
Applications from TSOs indicating that they operated in East Dunbartonshire (£48,145, or 0.3%), East Renfrewshire (£58,140; 0.4%), and Clackmannanshire (£123,374; 0.8%) accounted for the smallest shares of grant funding. This reflected the fact that relatively few applications were received from organisations indicating that they operated in these areas (23, 25 and 34 applications respectively). Moreover, according to the SCVO data, relatively few TSOs are based in these three local authority areas compared with the rest of Scotland.
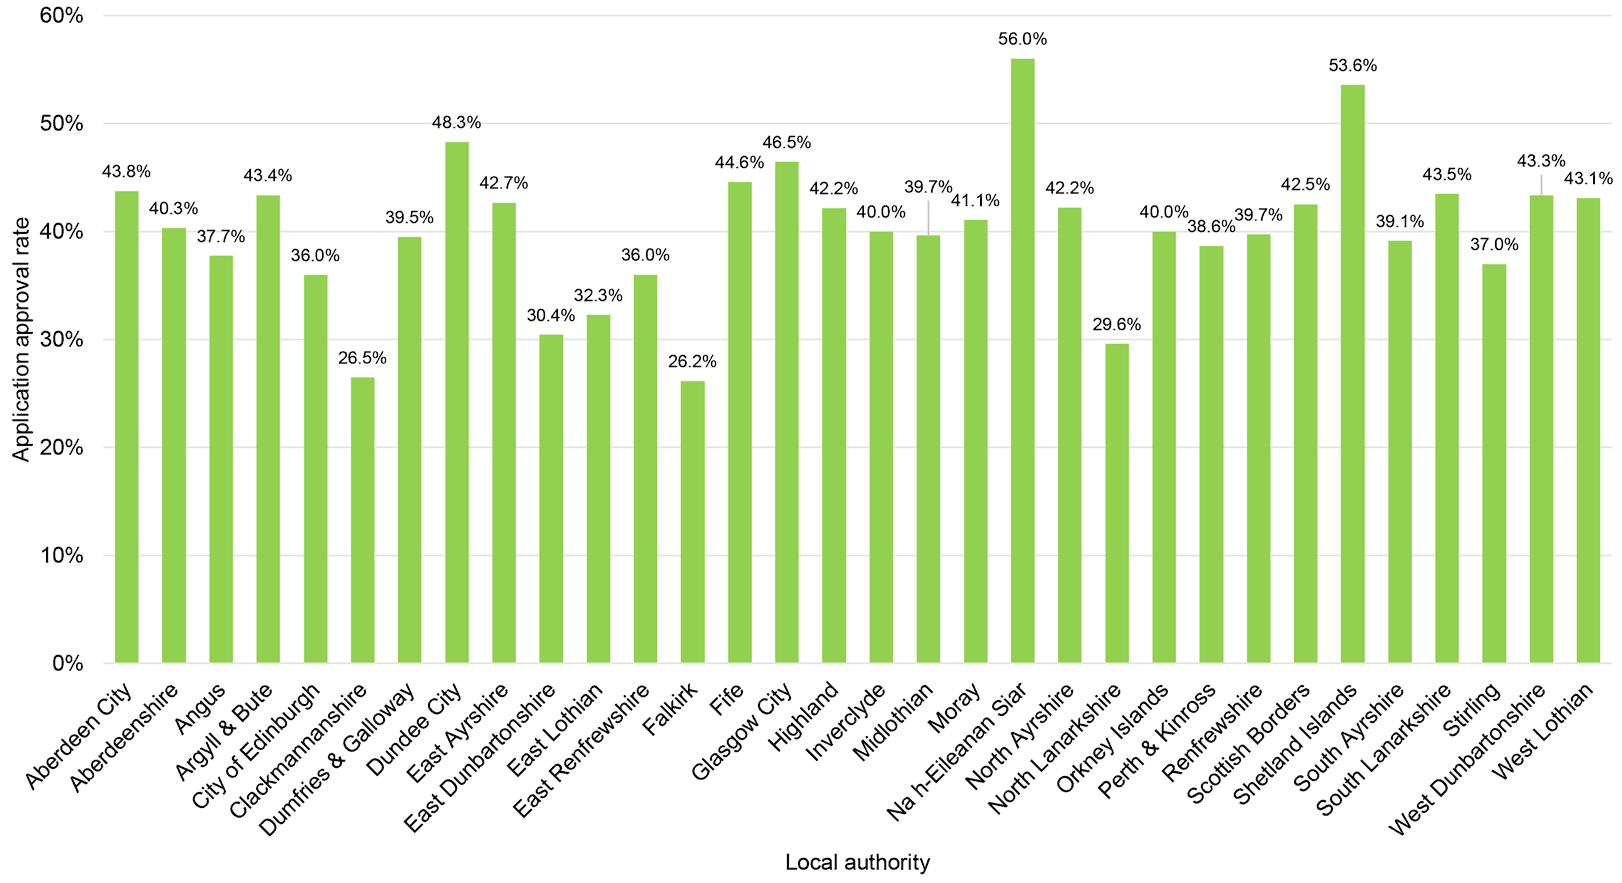
Amongst the organisations indicating that they operated in a particular local authority area, the application approval rate varied significantly across different areas. Approval rates ranged from a 26.2% approval rate for applications from organisations indicating that they operated in Falkirk, to 56.0% for applications from organisations indicating that they operated in Na h-Eileanan Siar (Figure 7).
It is not clear why the application approval rate varied so widely across the country. However, it is important to note that the aim of the TSRF was to assist any eligible TSO in need of financial support to continue operating, regardless of their location. As such, it was not expected that the funds would necessarily be distributed evenly across local authority areas. In any case, possible factors influencing application approval rates in different parts of the country may have included:
- organisations in some areas potentially being disproportionately affected by the pandemic and lockdown;
- the possibility that the fund was more widely or actively promoted in some areas than others meaning that organisations in some areas were more likely to be aware of the Fund;
- relatedly, that there may have been varying levels of support available for organisations seeking to apply in different local areas.
2.4 Funding awarded by Scottish Index of Multiple Deprivation (SIMD) quintile
As part of the application process, all organisations applying for funding were asked to provide their postcode. As part of the analysis, applications were then grouped into one of the five Scottish Index of Multiple Deprivation (SIMD) quintiles.[7]
As with the local authority analysis, there are some inherent limitations in the SIMD analysis since it is based on the postcode given by the organisation on the application form. In cases where organisations mainly deliver their services in areas which are not in close proximity to their main base, the organisation’s SIMD quintile may not reflect the areas that they predominantly work in. Nevertheless, the SIMD analysis provides some insight into the extent to which funded organisations were based in areas of deprivation.
Table 2 provides a breakdown of the applications and grants awarded by SIMD quintile. Figure 8 breaks down the funding awarded to organisations based in each SIMD quintile as a percentage of the total funding awarded.[8]
| SIMD quintile | No. of applications | No. of awards | % of applications approved | Amount awarded | % of funding awarded |
|---|---|---|---|---|---|
| 1 (20% most deprived areas) | 740 | 324 | 43.8% | £5,144,658 | 22.8% |
| 2 | 687 | 285 | 41.5% | £4,730,983 | 20.9% |
| 3 | 864 | 329 | 38.1% | £4,427,160 | 19.6% |
| 4 | 703 | 287 | 40.8% | £5,104,764 | 22.6% |
| 5 (20% least deprived areas) | 471 | 152 | 32.3% | £3,201,045 | 14.2% |
| Total | 3,465 | 1,377 | 39.7% | £22,608,610 | 100.0% |
With the exception of applications from organisations operating in SIMD 4 areas, as the level of deprivation increases, the amount of funding awarded to organisations in each quintile also increases. The largest share of funding (£5,144,658, or 22.8% of the funding awarded) went to organisations based in SIMD 1 (i.e. the 20% most deprived areas in Scotland). The smallest share of funding (£3,201,045, 14.2%) was awarded to organisations based in SIMD 5 (i.e. the 20% least deprived areas in Scotland).
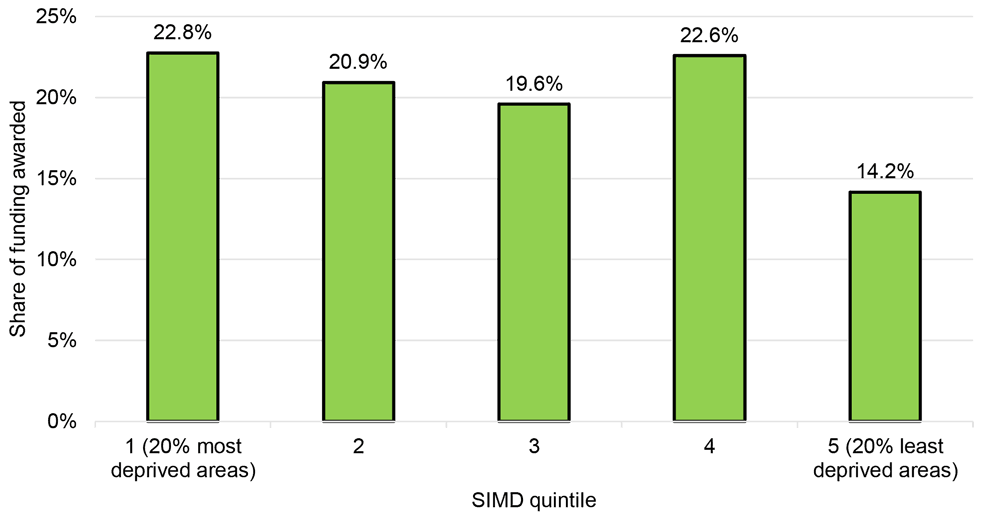
Organisations based in the fourth SIMD quintile were awarded a combined £5,104,764, amounting to 22.6% of all funding awarded. That organisations in this quintile were awarded a relatively high level of funding can likely be explained in two ways. First, as SCVO’s State of the Sector 2020 data shows, the largest share of charities (24.9%) are based in the fourth SIMD quintile. Second, it is likely that many larger charities will have their main headquarters in central urban areas, with postcodes that will often be in higher SIMD quintiles than the areas where their services are generally targeted. Indeed, the SCVO data shows that the largest share of charities (34.5%) are based in large urban areas.
Applications from organisations based in the most deprived quintile (SIMD 1) had the highest application approval rate (43.8%), while applications from organisations based in the least deprived quintile (SIMD 5) had the lowest approval rate (32.3%). The largest number of applications came from organisations based in SIMD 3 (864 applications) while the smallest number came from those based in SIMD 5 (471).
Overall, the data suggest that the Funding was successful in reaching and supporting organisations working in more deprived areas of Scotland.
2.5 Funding awarded by organisation size (expenditure/turnover)
Depending on the amount of funding that organisations were applying for, applicant organisations were asked to provide information on either their turnover or expenditure during the previous financial year.[9] This information can be used as a proxy for the size of the applicant organisations.
Table 3 summarises the data on the applications from (and awards to) organisations of different sizes, when using expenditure or turnover as an indicator of size. Breakdowns of the total value of grants awarded to – and the total numbers of applications from and awarded to – organisations of different sizes are also provided in Figures 9 and 10 respectively.[10]
| Annual expenditure/ turnover | No. of applications | No. of awards | % of applications approved | Amount awarded | Average amount awarded | % of funding awarded |
|---|---|---|---|---|---|---|
| Under £10,000 | 297 | 93 | 31.3% | £899,891 | £9,676 | 4.2% |
| £10,000 - £49,999 | 876 | 342 | 39.0% | £1,517,173 | £4,436 | 7.0% |
| £50,000 - £99,999 | 590 | 243 | 41.2% | £1,737,835 | £7,152 | 8.1% |
| £100,000 - £249,999 | 688 | 279 | 40.6% | £3,693,786 | £13,239 | 17.1% |
| £250,000 - £499,999 | 462 | 203 | 43.9% | £5,312,389 | £26,169 | 24.7% |
| £500,000 - £749,999 | 131 | 52 | 39.7% | £1,960,810 | £37,708 | 9.1% |
| £750,000 - £999,999 | 69 | 31 | 44.9% | £1,489,622 | £48,052 | 6.9% |
| £1,000,000 -£2,499,999 | 124 | 57 | 46.0% | £2,770,069 | £48,598 | 12.9% |
| £2,500,000 or more | 115 | 34 | 29.6% | £2,158,583 | £63,488 | 10.0% |
| Total | 3,352 | 1,334 | 39.8% | £21,540,159 | £16,147 | 100.0% |
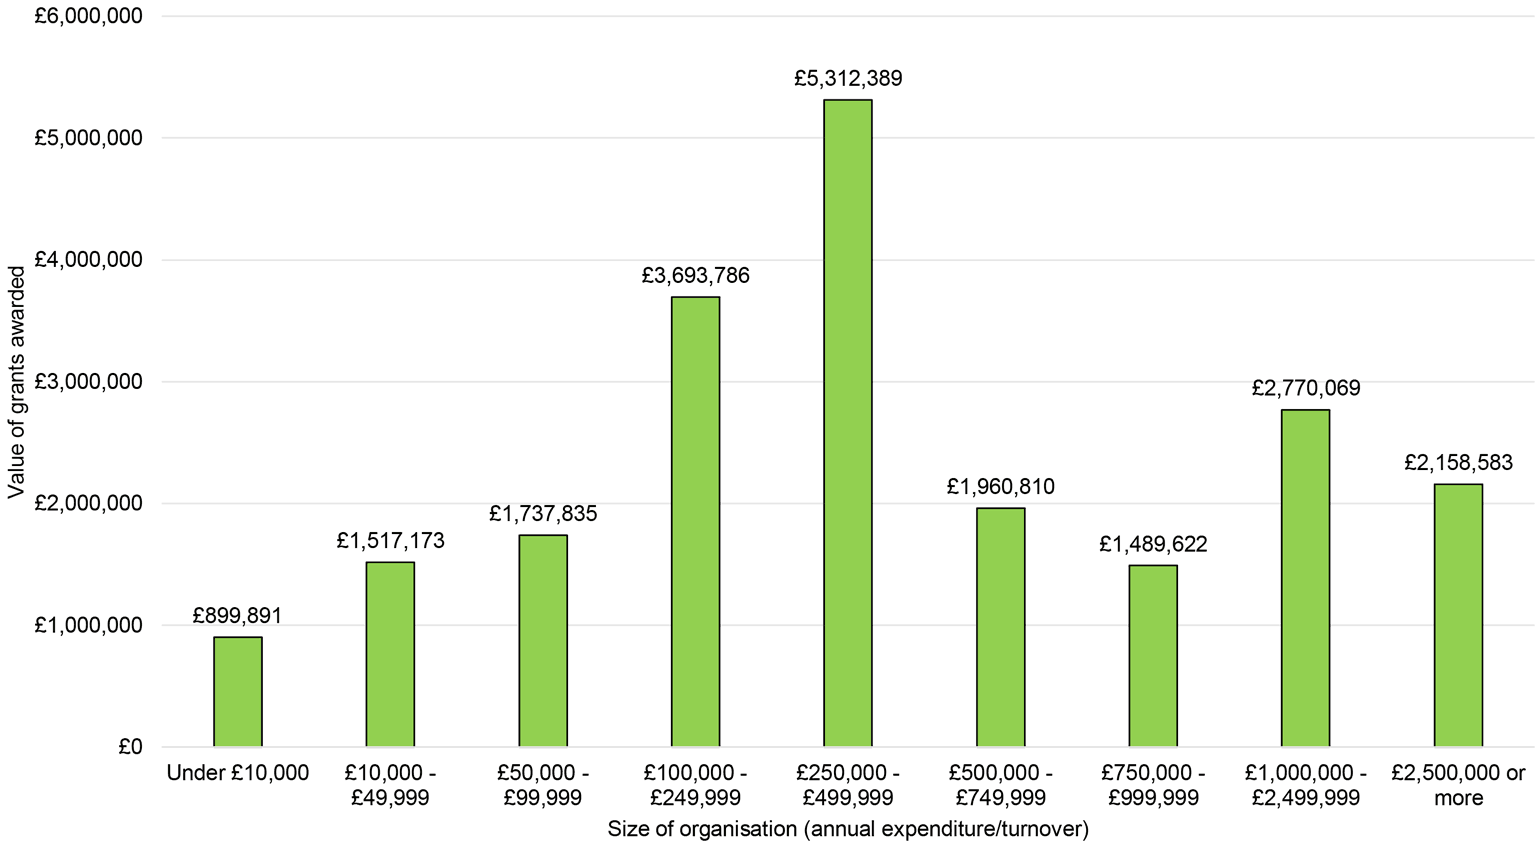
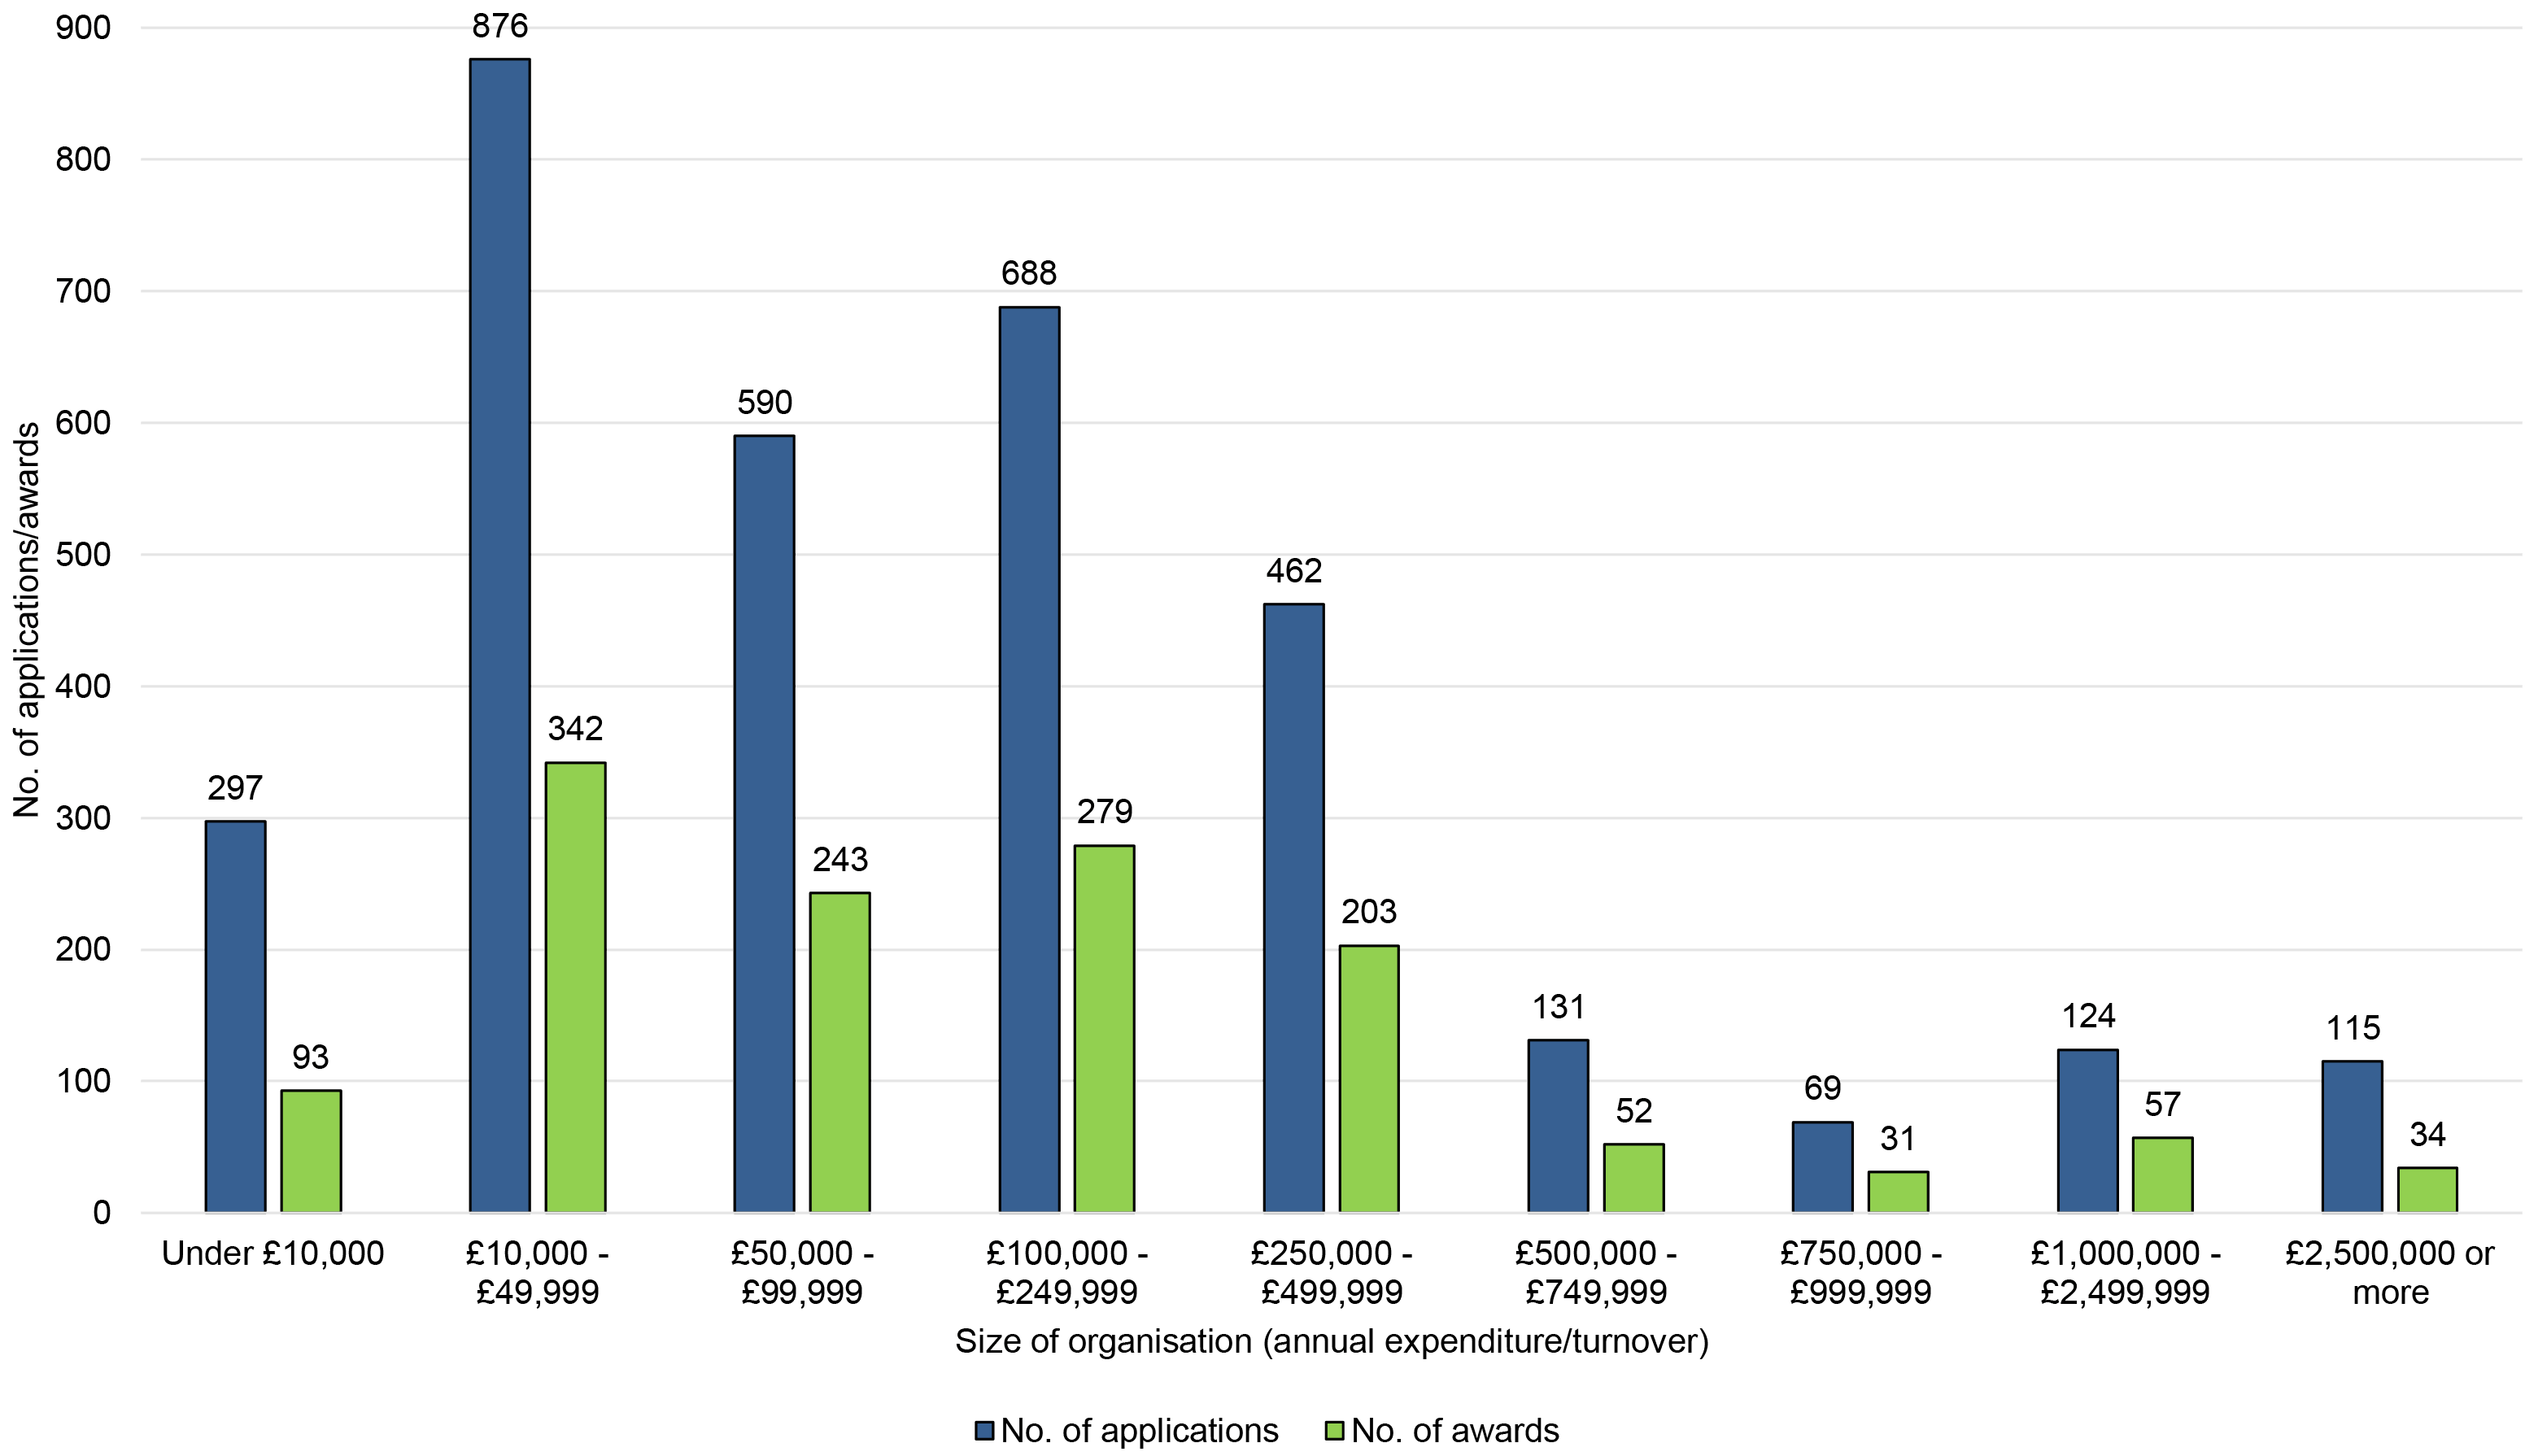
As the data show, the majority of grants went to relatively small organisations. Just over half (50.8%) of all awards were made to organisations with annual expenditure or turnover of less than £100,000. The second-smallest organisations represented in the data – those with an annual expenditure/turnover of between £10,000 and £49,999 – accounted for the largest number of applications (876) and awards (342), and received a combined total of £1,517,173.
However, the largest share of funding (£5,312,389, or 24.7% of the funding awarded) was distributed to organisations with annual expenditure/turnover of between £250,000 and £499,999. This was followed by organisations with an annual expenditure/turnover of between £100,000 and £249,999 (£3,693,786, or 17.1% of all funding awarded).
While the majority of awards were made to smaller organisations, larger organisations typically received larger grants, as might be expected given their higher liabilities and operating costs. With the exception of the awards made to organisations with an expenditure/turnover of less than £10,000 (which received £9,676 each, on average), the average amount of funding awarded rose in line with the size of the applicant organisation. The average award size for organisations with an annual expenditure/turnover of £2.5 million or more was £63,488.
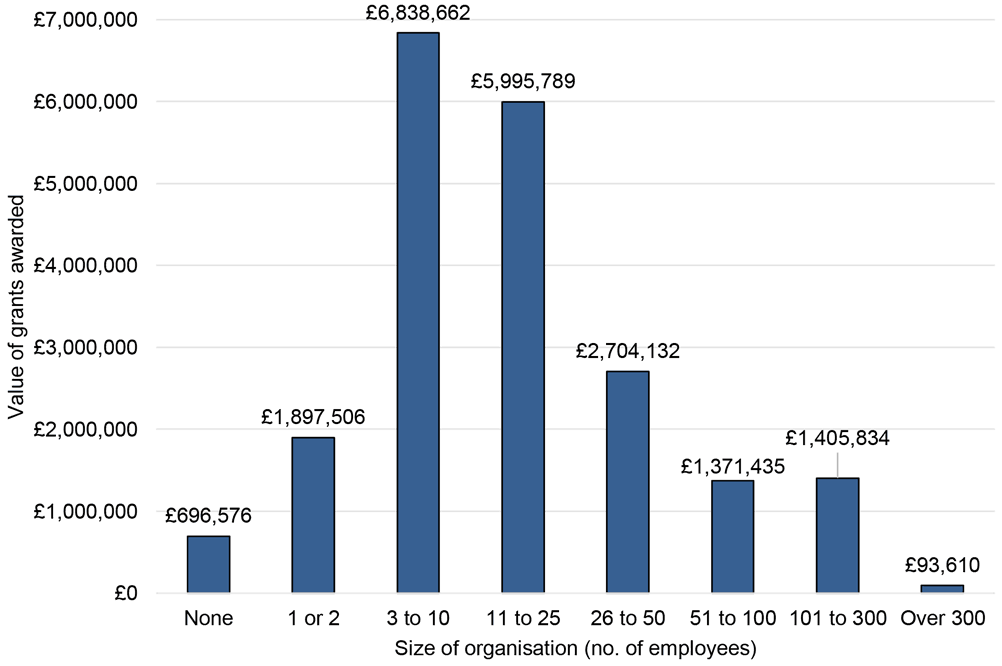
2.6 Funding awarded by organisation size (number of employees)
Employee numbers are another way of measuring the size of an organisation. In addition to gathering information on annual expenditure and turnover, organisations applying for TSRF grants were also asked how many staff members they employed. These figures were provided as total number of staff members, rather than number of full-time equivalent staff.
Table 4 provides an overview of the number of applications from – and awards to – organisations of different sizes, when using employee numbers as an indicator of size. Breakdowns of the total value of grants awarded to – and the total numbers of applications from and awarded to – organisations of different sizes are also provided in Figures 11 and 12 respectively.[11]
| No. of employees | No. of applications | No. of awards | % of applications awarded | Amount awarded | Average amount awarded | % of funding awarded |
|---|---|---|---|---|---|---|
| None | 537 | 191 | 35.6% | £696,576 | £3,647 | 3.3% |
| 1 or 2 | 725 | 280 | 38.6% | £1,897,506 | £6,777 | 9.0% |
| 3 to 10 | 1,268 | 523 | 41.2% | £6,838,662 | £13,076 | 32.6% |
| 11 to 25 | 492 | 213 | 43.3% | £5,995,789 | £28,149 | 28.5% |
| 26 to 50 | 140 | 60 | 42.9% | £2,704,132 | £45,069 | 12.9% |
| 51 to 100 | 64 | 27 | 42.2% | £1,371,435 | £50,794 | 6.5% |
| 101 to 300 | 61 | 20 | 32.8% | £1,405,834 | £70,292 | 6.7% |
| Over 300 | 12 | 2 | 16.7% | £93,610 | £46,805 | 0.4% |
| Total | 3,299 | 1,316 | 39.9% | £21,003,545 | £15,960 | 100.0% |
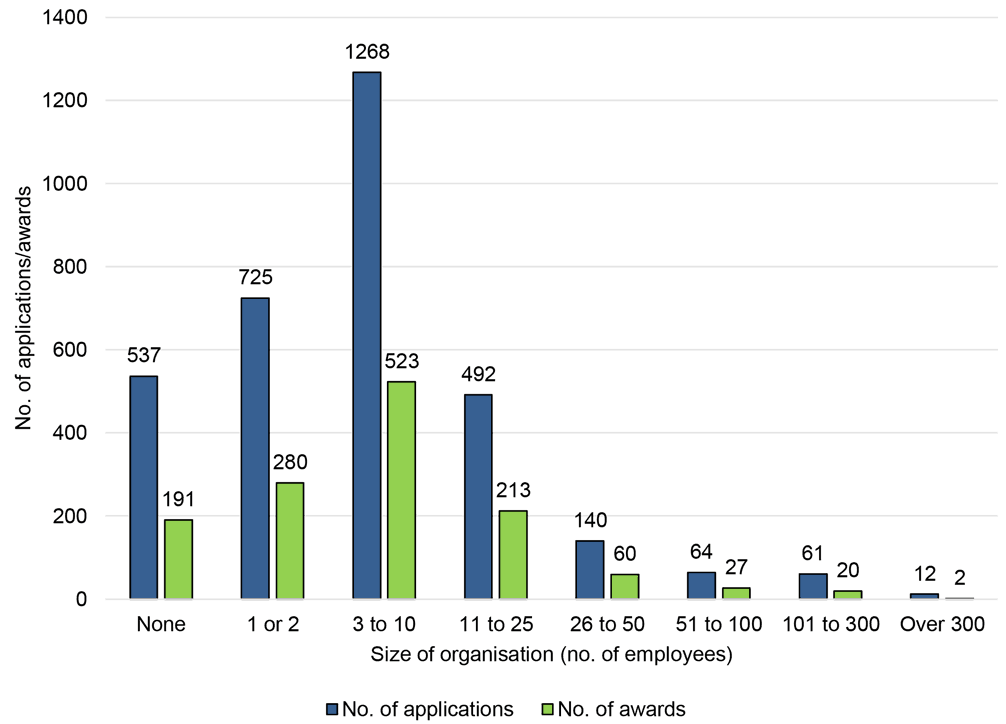
Overall, 1,125 awards were made to organisations with at least one employee (amounting to 85.5% of all awards). One hundred and ninety-one awards were made to organisations which did not employ any staff (representing 14.5% of awards).
As the data show, the largest share of funding (£6,838,662, or 32.6% of all funding awarded) was awarded to small organisations with three to 10 employees. Organisations of this size submitted the largest number of applications (1,268) and received the largest number of awards (523), with an application success rate of 41.2%.
The smallest share of funding (0.4%) was provided to organisations with over 300 employees. Organisations of this size submitted the fewest applications (12) and received the smallest number of awards (2). Given the upper limit on awards that could be made via the TSRF, it was designed to be more relevant to smaller and medium-sized organisations rather than larger ones.
2.7 Financial resilience
The TSRF application process asked organisations to submit data about their accounts and financial status. For the purposes of the evaluation, this information was used to examine the financial situation of TSOs seeking emergency funding through the TSRF by focusing on applicants’ levels of reserves and their reserve levels in relation to operating costs.[12] As noted above, the level of organisational reserves was one of the main eligibility criteria for the Fund, with organisations only being eligible if their current reserves would not cover more than four months (during Phase One) or 12 weeks (Phase Two) of operating costs.
Again, there are limitations to the data in question. The quality of the data varied. The financial data submitted by some organisations did not appear to be realistic, but it was not possible to check the data that organisations had provided. Organisations were asked to provide slightly different financial information depending on the application route they used. Full data was not available for all organisations. Accordingly findings presented here should therefore only be seen as a broad or approximate indicator the financial resilience of organisations applying for TSRF funding.
Finally, these results are not representative of the third sector more widely as organisations with current reserves above the thresholds set within the eligibility criteria were not eligible for funding. TSRF applicants were therefore likely to be organisations with lower reserve levels than average for the sector as a whole.[13]
2.7.1 Reserve levels of TSRF applicants and awarded organisations
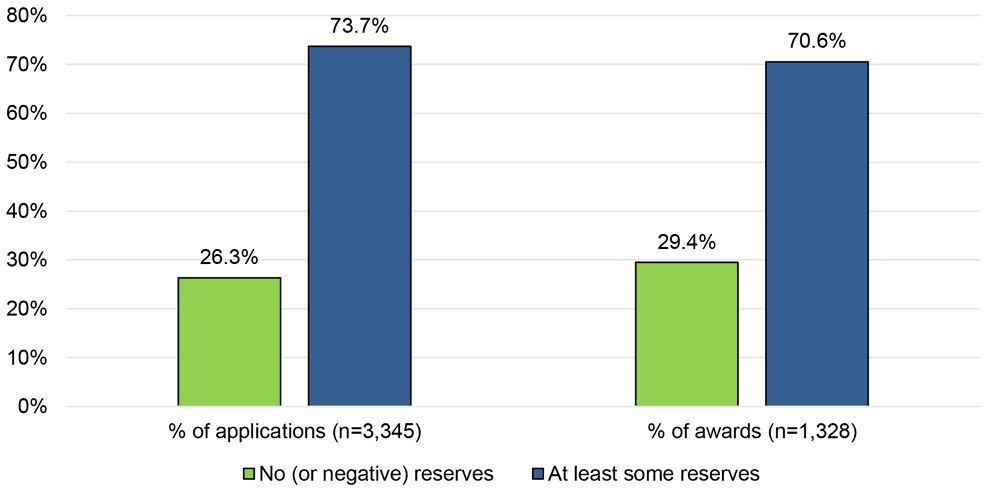
As shown in Figure 13, around one quarter of all applications (26.3%, or 881 applications) were from organisations which said they had zero reserves; in some cases, applicants reported having negative reserves. Conversely, almost three quarters of applications (73.7%, or 2,464) were from organisations which had at least some reserves. Overall, the data suggest that the majority of third sector organisations represented here were operating with a minimal financial buffer at the outset of the pandemic.
Figure 13 shows that 70.6% of awards went to organisations which had at least some reserves. Nevertheless, the overall level of reserves among awarded organisations was low, with 29.4% of awards going to organisations which stated that they had no reserves at all.[14]
2.7.2 Reserves in relation to operating costs
Reserves alone are a limited indication of the financial resilience of an organisation. The amount of reserves that an organisation requires depends on its size and operational costs. Reserves can also be influenced by the business model of the organisation (for example, its throughput rate), or by seasonal fluctuations (particularly in the tourism and hospitality sector).
The available data on organisational expenditure/turnover was used to derive daily expenditure rates – the average cost of an operating day based on reported annual expenditure. These rates of expenditure were then compared with reported data on reserves to give an understanding of reserves in relation to operating costs.[15] The results are shown in Figure 14.
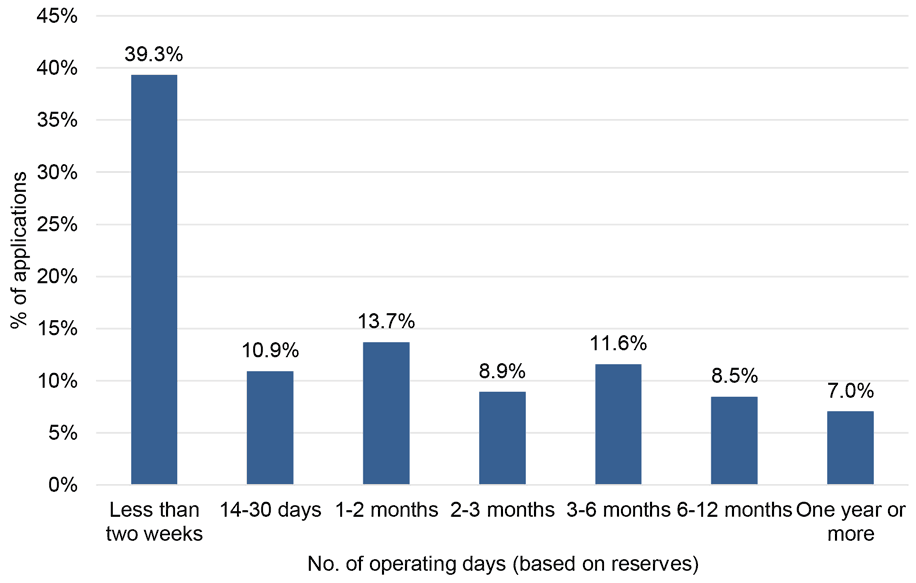
Based on the reserves data submitted by applicant organisations, 1,268 applications (39.3% of all applications) were from organisations which had reserves sufficient for less than two weeks of (notional) expenditure costs at the time of application. Around half (1,620, or 50.2%) of applications were from organisations which had reserves sufficient for less than one month of expenditure. When combined, almost three quarters (2,350, or 72.9%) of applications were from organisations which had reserves sufficient for no more than 3 months of expenditure.
While this picture does not take into account the levels of cash that organisations held in their accounts, it does suggest that many of the applicant organisations would have been unable to operate for more than a few days or weeks in the absence of their normal income stream, and that the TSRF may have played an essential role in helping organisations to remain operational. In this sense, the TSRF generally succeeded in attracting applications from organisations which were in greatest need of support given their limited financial reserves.
Contact
Email: socialresearch@gov.scot