Renewable and zero emissions heating systems in affordable housing projects: evaluation
An evaluation of renewable and zero emissions heating systems in 21 Scottish affordable housing projects. This study assesses the estimated, actual, and counterfactual costs of the projects’ heating systems and determines the drivers behind decision making.
6. Low carbon heating system costs
In this section and in the associated Appendix B, the 13 projects for which cost data is available are grouped firstly by technology type, and then alphabetically. A summary of the data is presented first, followed by individual project data and then programme-averaged cost estimates for each technology and unit archetype, which have been inferred from the individual data.
Capex definition
Throughout this section and the associated appendices, capex (capital expenditure) is defined as the combined equipment and installation costs of the heat generation and storage system of a given affordable housing unit. Notably, this definition excludes heating distribution capex such as the costs installing underfloor heating or radiators.
6.1. Chapter summary
The key findings from our analysis of the projects LZCGT cost data are:
Capex
There is a vast range in capex, even for the same technologies (particularly ASHPs), but less variation within projects across unit sizes. Shared systems, including DHNs, are more expensive than individual ones.
LZCGT equipment and installation capex ranges from £5,000 to £11,500 per unit. For counterfactual systems, capex ranges from £3,000 to £11,850.
Opex
GSHPs have the lowest operational cost, followed by ASHPs, then Solar-PV based systems. Due to the standing charge for gas, gas boiler systems are more expensive to operate than any of the LZCGTs considered (aside from biomass DHNs, which aimed to be cost-competitive with gas).
Based on programme-averaged heat estimates, annual LZCGT opex costs ranged from £121 to £216 for one-bed homes and from £199 to £294 for four-bed homes. For counterfactual systems, opex ranged from £216 to 433 for one-bed homes and from £294 to £710 for four-bed homes
LZCGTs versus counterfactuals
Gas, LPG and direct electric heating systems generally require solar PV in order to pass SAP, so PV costs have been included within capex figures for these counterfactuals.
LZCGTs cost around £2,000 to £5,000 more than gas boilers with PV. Data for off-gas counterfactuals was less conclusive, as few projects considered these because their high opex negatively impacts tenants.
Costing approach
Several Councils and RSLs did not cost counterfactual systems because other objectives or requirements narrowed down the choice of technologies.
Most opex estimates were based on SAP calculations, which are broadly noted to be inaccurate predictions but useful to enable cost comparison between units, technologies and building fabric specifications.
Limitations of data
Due to the limited data collected for most LZCGTs (except ASHPs) and high variation in the projects themselves (sustainability levels, locations, sizes, unit types, procurement process), trends and programme-averaged values are presented with low confidence and are highly caveated.
6.2. Individual project cost data
6.2.1. Summary
The average heating system capex for each project (that was able to provide data) is shown in Figure 11. The two projects that achieve Aspects 1 and 2 of the Gold sustainability standard are shown separately at the top at the figure, given that these projects have lower average heating demands per unit than the others. Having a lower heat demand would imply lower LZCGT capex, but this cannot be verified in this case as these two Gold standard projects both incorporate the same technology and are the only projects to do so within this study.
The heating system capex of the projects meeting Silver standard are then presented, arranged by technology type. 'Extra capex' in the figure captures the costs of additional components that form the heating systems. For Project 15, this represents solar thermal water heating and MVHR (incorporated to meet other Aspects of Silver standard), and for Project 13 it represents heat batteries and PV on top of ASHPs.
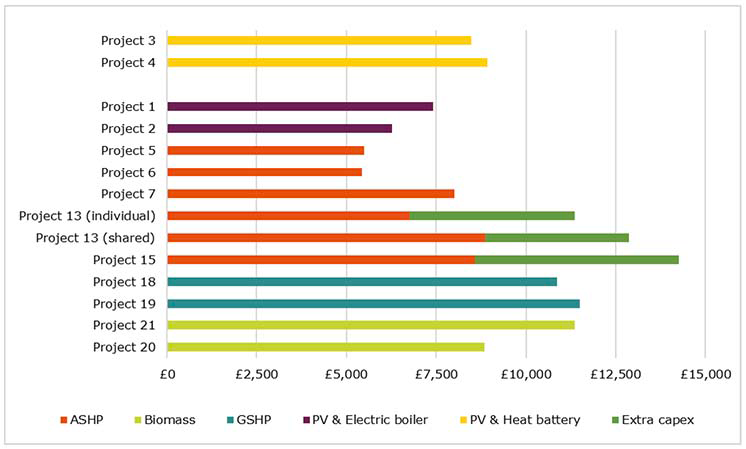
Figure 11 demonstrates several trends. Firstly, shared heating systems (Biomass, GSHPs and communal ASHPs) are more expensive than most individual systems. Secondly, for the projects that meet the same (Silver) sustainability standard, there is a vast range in heating system capex. Notably GSHPs and multi-component heating systems (both of which have significantly lower opex than ASHPs), cost more than double some of the ASHP systems. The variation between capex for a given technology is also evident from Figure 11, and most notably for ASHPs as there are more than two examples of this technology.
Lastly, it is evident that – despite the two Gold standard projects having lower annual heating demands than most project-averages and most individual units – a higher standard does not guarantee lower heating system capex. Of course, data from more projects achieving Gold standard would be needed to confirm or invalidate this across more technologies, but it holds true for the two examples above. Therefore, it highlights the premium that these two projects are paying for their heat batteries and solar PV, compared to the other individual technologies, on top of the premium they already encounter to meet Gold standard heat demands through building fabric specification.
6.2.2. Considerations
As Figure 11 separates projects only by technology type and sustainability standards, it fails to capture several other factors that have the potential to influence project capex. For example, in showing project-averaged values, it does not demonstrate variations in LZCGT capex across different unit types, sizes and occupancies, which was observed for some but not all projects. Most notably from the stakeholder interviews, rural and remote projects experience higher capex, mainly due to a less competitive supply chain. However, there is not sufficient data to verify this trend, given that this could only be attempted for ASHPs, but all ASHP projects in this study are in rural areas. The exception to this is Project 13, which is classified as an 'Other Urban' location due to its size, despite being highly isolated from the Central Belt and other large towns or cities. This project is also distinguished from the others which incorporate ASHPs in that it required high-temperature heat pumps to be specified as these are more compatible with heat batteries than standard ASHPs, but at a cost premium.
As with any element of built environment developments, the size of the project impacts its costs, with large projects experiencing economies of scale. A weak relationship between project size and capex for ASHPs is shown below in Figure 12. The key outlier against the trend of larger projects experiencing economies of scale is a development of four affordable homes which has the lowest ASHP capex. A potential explanation for this is the fact that it is a Section 75 requirement of a larger development.
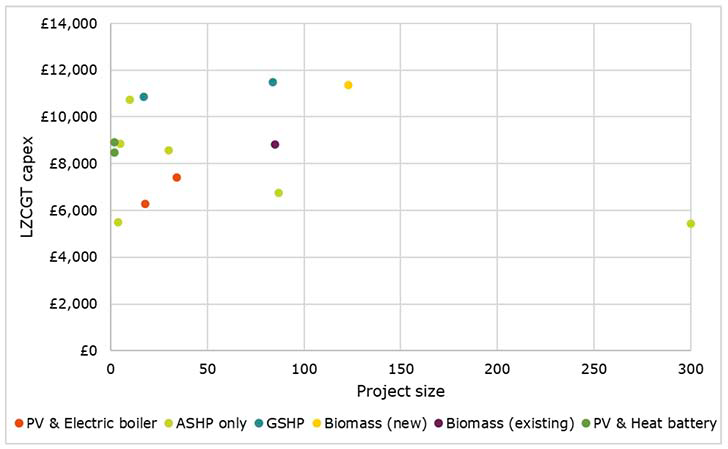
Table 9 indicates that this project is one of two of the Section 75 projects across this study that incorporates the same heating system as the wider housing development. These two projects benefit from further economies of scale for their heating systems than the others, given that they tie into larger, private developments. This also raises another potential reason for varying costs – as these projects are linked to private developments which are understood to experience lower unit costs in general, as they often have better links with the supply chain and tend to have more buying power.
| Project | Technology | Same technology/contract as rest of development? |
|---|---|---|
| Project 4 | PV & heat battery | No |
| Project 5 | ASHP | Yes |
| Project 7 | ASHP | No |
| Project 19 | GSHP | Yes |
| Project 20 | Biomass DHN | No |
Whilst a few key trends have been demonstrated or inferred from the project capex data collected, all of the above considerations demonstrate that further data would be required to validate any and all of the quantitative trends identified within this study.
6.2.3. Solar PV heating systems (individual)
In Appendix B, section B1, costs are presented for the four projects that have rooftop solar PV arrays as the primary source of power for their heating systems. There are two variants, depending on whether the electricity produced by the solar PV is converted to heat via an electric boiler and hot water storage cylinder system or via a heat battery. The boiler/cylinder systems represent a more conventional hot water storage set-up that is long-established in domestic buildings. The heat batteries are a novel, proprietary technology from Sunamp which utilise a phase-change material to store heat and can be charged either by electricity or a thermal source. In this case, they would be charged from the PV arrays or by grid electricity, as would the electric boilers. Given that these two variants serve a similar purpose and are broadly cost-comparable, it has been deemed appropriate to group them for the purposes of this evaluation.
| Project | Heating system | Sustainability Standard | Heat capex per unit | Number of units | Project total heat capex |
|---|---|---|---|---|---|
| Project 1 | Solar PV & boiler | Aspect Silver Level 1 and 2 | £7,408 | 34 | £251,872 |
| Project 2 | Solar PV & boiler | Aspect Silver Level 1 and 2 | £6,278 | 18 | £112,004 |
| Project 3 | Solar PV & Heat battery | Gold | £8,470 | 2 | £16,940 |
| Project 4 | Solar PV & Heat battery | Gold | £8,926 | 2 | £17,852 |
6.2.4. Air source heat pumps (individual)
In Appendix B, section B2, costs are presented for the five out of eight projects that have individual ASHPs as the primary component of their heating systems and were able to provide costs. The first three projects listed in Table 11 have ASHPs as the sole component of their heating systems. This applies to the Kilbeg project too, but the project costs were not received in this case. The final two have ASHPs along with one to three additional technologies, including MVHR, Solar PV, heat batteries and solar thermal hot water generation. Two further projects fit in this category, but one has not been designed to the point of costing yet and the project contact for the other was not able to get a breakdown of heating system costs from their contractor. Notably, of these four systems, no two use the same combination of additional technologies.
| Project | Heating system | Sustainability Standard | Heat capex per unit | Number of units | Project total heat capex |
|---|---|---|---|---|---|
| Project 5 | ASHP only | Aspect Silver Level 1 and 2 | £5,500 | 4 | £22,000 |
| Project 6 | ASHP only | Aspect Silver Level 1 and 2 | £4,944 – £5,933 | 300 | £1,654,211 |
| Project 7 | ASHP only | Aspect Silver Level 1 and 2 | £10,738 | 10 | £107,380 |
| Project 13 (individual systems) | ASHP, Heat battery & PV |
Aspect Silver Level 1 and2 | £11,700– £13,119 | 87 | £1,034,576 |
| Project 15 | ASHP, MVHR, Solar thermal | Silver | £14,137– £14,357 | 5 | £71,125 |
6.2.5. Air source heat pumps (shared)
In Appendix B, section B3, information is presented for the only project that had costed shared ASHP heating systems. These systems are comprised of several large ASHPs located in a communal 'energy centre' room or building, which supply heat to multiple flats via insulated hot water pipes. As such, they represent a form of district heating. Two further projects employing shared ASHPs are at early pre-construction stages, so have no cost or energy demand data nor unit schedules yet.
| Project | Heating system | Sustainability Standard | Heat capex per unit | Number of units | Project total heat capex |
|---|---|---|---|---|---|
| Project 13 (shared systems) | Communal ASHP, Heat battery and PV | Aspect Silver Level 1 and 2 | £11,015 | 30 | £330,436 |
6.2.6. Ground source heat pumps (shared)
In Appendix B, section B4, costs are presented for the two projects which have shared GSHP heating systems. These are made up of a ground loop which extracts ambient heat from the earth via pipework installed in deep boreholes, and individual heat pumps in each property which use electricity to 'upgrade' the ambient heat collected from the ground to temperatures required for heating and hot water systems.
| Project | Heating system | Sustainability Standard | Heat capex per unit | Number of units | Project total heat capex |
|---|---|---|---|---|---|
| Project 18 | Communal GSHP | Aspect Silver Level 1 and 2 | £10,871 | 17 (inc. 1x staff unit) | £184,800 |
| Project 19 | Communal GSHP | Aspect Silver Level 1 and 2 | £11,500 | 84 | £966,000 |
6.2.7. Biomass (shared)
In Appendix B, section B5, costs are presented for the two projects which have shared biomass heating systems. These are comprised of a large, centralised biomass boiler which provides heat to each property via insulated hot water pipes in the ground. These two projects notably differ, in that one taps into an existing industrial scale DHN, whereas the other's biomass plant is purpose-built.
| Project | Heating system | Sustainability Standard | Heat capex per unit | Number of units | Project total heat capex |
|---|---|---|---|---|---|
| Project 20 | Biomass DHN (existing) | Aspect Silver Level 1 and 2 | £8,837 | 85 | £751,106 |
| Project 21 | Biomass DHN (new) | Aspect Silver Level 1 and 2 | £11,355 | 123 | £1,396,665 |
6.3. Programme-averaged data
The heating system costs were collected across the affordable housing projects have been utilised to provide programme-averaged costs. For each technology and each unit archetype, programme-averaged capex has been calculated from the average equipment and installation cost based on the projects' costs for these systems and across different unit sizes. Similarly, programme-averaged opex values have been calculated for each technology and unit archetype, based on the estimated annual energy demands of each project's units and assumptions on the unit cost and performance of each technology type. Four archetypes have been defined on the basis of occupancy and range from one-bed to four-bed units, each with a defined floor area and annual heat demand. In Appendix A, the archetype definition process is explained, and an overview of the LZCGTs and counterfactual technologies considered is given.
6.3.1. Summary
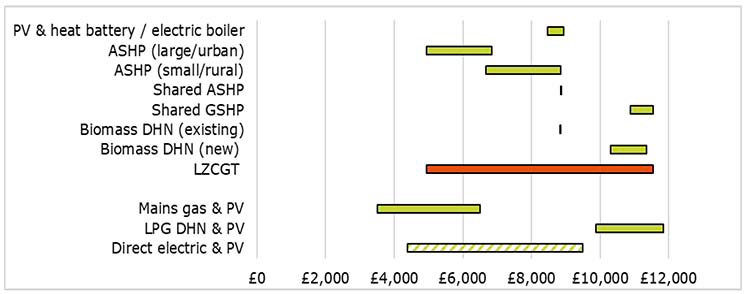
The ranges of capex for each LZCGT and the three counterfactuals considered are presented below in Figure 13. The figure shows a very broad range in LZCGT capex, with shared systems being more expensive than individual ones in almost all cases. Table 15 demonstrates that LZCGTs are being installed at a premium of £2,000 to £5,000 compared with counterfactual systems. However, the counterfactual system capex values include solar PV installation capex as PV would be required for these systems to pass SAP. In addition, the off-gas counterfactuals are presented with a lower degree of confidence, given that most off-gas projects did not cost these systems. One explanation for this is that, owning to their high opex compared to LZCGTs, they are not considered viable systems due to high costs encountered by tenants.
Where gas is an option, it is actually more expensive to operate than the LZCGTs considered. GSHPs are cheapest to run, followed by ASHPs. Solar PV-based systems are slightly more expensive (although less so than direct electric or LPG systems) but there is more uncertainty around these costs as they are linked to the capacity and generation of solar PV. As with the individual projects' cost data, there are numerous limitations and caveats to the data programme-averaged presented within this section.
| LZCGT | Gas counterfactual | Off-gas counterfactuals | |
|---|---|---|---|
| Capex range | £5,000 - £11,500 | £3,000 - £6,500 | £4,400 - £11,800 |
| 1-bed opex | £121 - £216 | £216 | £274 - £433 |
| 4-bed opex | £199 - £294 | £294 | £409 - £710 |
(The range in LZCGT capex is shown in orange, based on the values above it; the range for direct electric and PV systems is shown partially shaded as its definition of capex contravenes that of the other technologies.)
6.3.2. Programme-averaged capex
Capex values for each LZCGT and the three counterfactuals, split by archetype, are presented in Table 16. Although several projects have defined capex in different ways, we have normalised costs where necessary to present values that can be compared across the range of technologies. Therefore, capex has been defined as the supply and installation of the heat generation and storage system, excluding heat distribution systems such as radiators and underfloor heating. Network costs are not included in the definition unless a network is inherent to the system design, as with GSHP, biomass, and LPG DHNs.
Given the varied availability of capex data, cells are marked in terms of the level of confidence that we have in the values presented. (R) represents low confidence, meaning that the values are based on costs data for a single project and/or are specific to a narrow project context; (G) represents high confidence, meaning that cost data is based on multiple projects and/or are much less context-specific; and (Y) represents medium confidence. All costs have been sense-checked, so even 'low confidence' values are considered reasonable if not universally applicable.
| Archetype | 1 | 2 | 3 | 4 |
|---|---|---|---|---|
| Description | 1-bed flat / terrace | 2-bed flat/ terrace/ semi | 3-bed terrace/ semi/ detached | 4-bed semi/ detached |
| Footprint (m2) | 50 | 85 | 100 | 120 |
| PV & Heat battery / Electric boiler capex | Not applicable | £8,470– £8,925 (G) | £9,000– £11,000 (Y) | £9,000– £11,000 (Y) |
| ASHP capex (large/ urban)[4] |
£4,950– £6,680 (G) | £4,950– £6,680 (G) | £5,500– £6,840 (G) | £5,500– £6,840 (G) |
| ASHP capex (small/ rural) |
£6,680– £8,460 (Y) | £6,680– £8,460 (Y) | £6,840– £8,680 (Y) | £6,840– £8,680 (Y) |
| Shared ASHP capex | £8,860 (R) | Not applicable | ||
| Shared GSHP capex | £10,870– £11,500 (Y) | £10,870– £11,500 (Y) | £10,870– £11,500 (Y) | £10,870– £11,500 (Y) |
| Shared (existing) biomass capex | £8,835 (R) | £8,835 (R) | £8,835 (R) | £8,835 (R) |
| Shared (new plant) biomass capex | £10,300– £11,350 (Y) | £10,300– £11,350 (Y) | £10,300– £11,350 (Y) | £10,300– £11,350 (Y) |
| Mains gas boiler and PV capex |
£3,000– £4,000 (Y) | £3,500– £4,500 (G) | £4,500– £6,000 (Y) | £5,000– £6,500 (Y) |
| LPG DHN and PV capex |
£11,015 (R) | £9,875 (R) | £10,375 (R) | £11,835 (R) |
| Direct electric heat and PV capex (inc. heat distribution) | £4,385 (Y) | £5,500– £6,500 (R) |
£7,000– £8,000 (R) |
£8,500– £9,500 (R) |
As in section 6.2, there is broad variation in capex costs across LZCGTs. Costs vary much less across the different archetypes, particularly for the shared systems. This indicates that the size and cost of equipment installed in a development does not scale linearly with unit sizes, which is broadly as expected, particularly in relation to shared systems. The costs presented for the counterfactual systems, whilst generally lower (with the exception of the LPG DHN option) are done so with lower confidence, predominantly because most projects did not cost a counterfactual system, and many of these were gas boiler cost estimates without corresponding solar PV requirements and costs.
For on-gas grid locations, RSLs and Councils appear to be paying a premium of £2,000 to £5,000 per unit to install an LZCGT with solar PV. In some cases, this equates to more than doubling the heating system cost. For off-gas grid locations, Table 16 shows significant variation in costs between the two options presented. However, the direct electric option includes distribution system costs inherently, which means that it cannot be directly compared to the other values presented. For all other systems, heat distribution costs are likely to range from £1,000 to £3,000 per property. As such (and as indicated during stakeholder interviews), we believe direct electric systems to be cheaper than LZCGTs in most cases. On the other hand, the costs presented for LPG DHNs indicate that this option is more expensive than the individual system options and comparable to the shared systems. Both counterfactuals were noted in the stakeholder interviews to lead to very high opex costs, which meant that they were not considered to be feasible alternatives for tenants in the way that gas boiler and PV systems were.
6.3.3. Programme-averaged opex
Programme-averaged opex values have been calculated for each technology and unit archetype, based on the estimated annual energy demands of each project's units and assumptions on the unit cost and performance of each technology type. This does not include maintenance costs.
In Table 17, the estimated annual heat demand for each archetype (inclusive of hot water demand) is taken from the average of the values of each unit with the same occupancy. Almost all the estimated heat demands are based on SAP calculations, which provides a degree of consistency between them, despite the fact that SAP is acknowledged among the stakeholders to generate estimates that do not translate into real-world demands. Therefore, it is stressed that the values in the table are not guaranteed to match real-world costs.
The operation costs within Table 17 are based on the Energy Saving Trust's (EST's) current rates for electricity (16.36p/kWh), gas (4.17p/kWh) and LPG (7.19p/kWh). Standing charges, also from EST, have been applied to gas (£93.93/year) and LPG (£62.41/year). Electricity does have a standing charge (£91.55/year) but this has been excluded below because it would apply to any home regardless of its heating system. The cost for biomass is taken to be equal to gas, as this is the benchmark that both of the biomass DHN projects had committed to deliver (although this was essentially a coincidence, as stakeholders from both projects stated they were not sure of a general approach to costing biomass DHNs fairly).
Lastly, the impact of solar PV has only been accounted for in the case where this has been defined as part of the heating system, for example where PV is linked to a heat battery or electric boiler. Although PV will be present in the gas, LPG and direct electric scenarios, it will not be linked to the heating systems and, as such, cannot be guaranteed to directly impact heating system costs. For Solar PV opex cost we have assumed that the PV system provides 40% of the energy demand, but the remaining 60% must be imported from the grid.
| Archetype | 1 | 2 | 3 | 4 |
|---|---|---|---|---|
| Description | 1-bed flat / terrace | 2-bed flat/ terrace/ semi | 3-bed terrace/ semi/ detached | 4-bed semi/ detached |
| Footprint (m2) | 50 | 85 | 100 | 120 |
| Annual heat demand (kWh/year) | 2,645 | 3,150 | 3,155 | 4,340 |
| Heat demand per m2 | 52.9 | 37.1 | 31.6 | 36.2 |
| Solar PV opex | Not applicable | £206 | £206 | £284 |
| ASHP opex | £144 | £172 | £172 | £237 |
| GSHP opex | £124 | £147 | £147 | £203 |
| Biomass / gas opex | £216 | £239 | £240 | £294 |
| LPG DHN opex | £274 | £314 | £314 | £409 |
| Direct electric opex | £433 | £515 | £516 | £710 |
It's clear that the heat demands for two-bed and three-bed units are very similar among the units represented within the project. This is partly due to the way that SAP estimates occupany for hot water demand calculations. This is calculated non-linearly and on a floor area basis, meaning that an 85m2 home is assumed to have an occupancy of 2.44 people, versus 2.61 for a 100m2 home. This means that the two-bed and three-bed archetypes units are assumed to have very similar hot water demands. Accordingly, the key differences in annual heat demand from the SAPs of these units would arise from heat loss through building fabric. Therefore, the footprints, locations and fabric specifcation of the units inform the heat demand, and the variation of the projects within the study appears to have resulted in similar programme-averaged demands. This highlights the need to collect real-world heat demand and system usage data over relying on averaged values based on SAP assumptions.
For ease of comparison, the values from Table 17 are also presented in Figure 14. Evidently, direct electric heating systems are by far the most expensive operationally, which explains why many of the stakeholders do not consider them to be a suitable option in the context of affordable housing where fuel poverty is a major concern. Similarly, LPG opex is higher than gas and LZCGT system opex. Stakeholders also indicated that they did not want their tenants to be tied into long-term LPG supply contracts, and suggested actual unit costs were considerably inflated compared to the EST values used in the study.
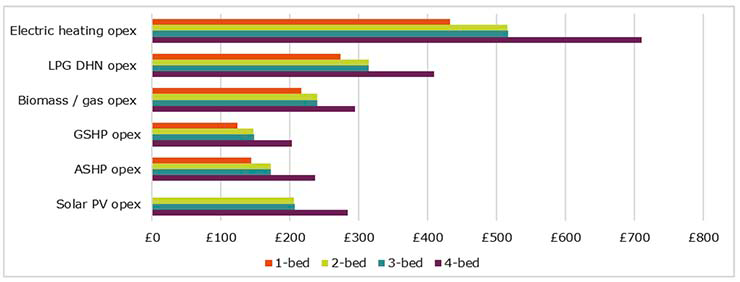
Compared to the LZCGT systems, gas is more expensive heat source, and so therefore is biomass, so long as biomass costs are equal to those of gas. This is due to the standing charge applicable to gas, without which, it would be the cheapest option across all archetypes. Figure 14 also demonstrates that GSHPs are the cheapest LZCGT to operate, with GSHP running costs being lower by approximately 15% than those of ASHPs. Lastly, the solar PV-based systems are assumed to have the same running costs regardless of whether they include electric boilers or heat batteries. These sysems are estimated to be roughly 20% more expensive to operate than ASHPs, but this depends greatly on the contribution of solar PV generation to meeting heat demand.
Often, opex is defined to include maintenance costs as well as the fuel/electricity costs needed to run a heating system. This is not the case within this study, as costs to tenants are the main concern and maintence is arranged (and paid for) by the RSLs/Councils rather than the tennants themselves. Therefore, it is important to caveat that the opex costs presented above do not capture the full extent of the ongoing costs of operating each of these systems.
6.3.4. Discussion
Data availability and limitations
There are several discrepancies between the cost information requested by the Scottish Government and what has been presented above. This is primarily due to the approach of RSLs and Councils and the structure of their respective projects. For example, capex was requested to be separated into equipment and installation costs. However, no capex was provided in this way. This is because these costs are largely determined by contactors, who tend not to itemise equipment and installation separately.
Additionally, electricity network costs were requested for all projects but only one had determined that their heating system would trigger additional network costs, as an additional substation was required to handle the start-up power of the project's 97 ASHPs. Across the other projects, network costs were either not impacted by the choice of heating system, or the additional costs were not borne by the RSLs or Councils. Reasons for this are discussed in section 5.3.6. Therefore, network costs have not been estimated for the programme-averaged capex ranges.
In terms of counterfactuals, many have not costed any alternative systems, and those who did were more likely to compare costs of different LZCGTs to each other, rather than the cost of the chosen LZCGT heating system to an equivalent gas boiler system. One reason for this is that it is harder to define this 'equivalent' as e.g. gas systems would need additional measures, (namely solar PV) in order to meet the same sustainability standard (i.e. to achieve an equivalent rating in SAP).
SAP also appears to be relied on to provide annual energy demands and opex estimates, and only a handful of projects supplied data of this type that was not derived from SAP. Whilst SAP opex estimates are useful to allow the relative costs of different LZCGTs to be compared, they are widely acknowledged to be vastly different from (and unreliable measures of) real-life costs.
The analysis within this section is highly dependent on the assumptions made by the projects' teams, by SAP and by Locogen. As such, real-life systems may vary widely from estimates, and it is important that in the coming years a shared knowledge base of actual operational costs for low and zero carbon heating systems is developed through data obtained from monitoring occupied homes.
Cost-effectiveness of LZCGT heating systems
It is inherently difficult to gauge which projects are more cost effective than others, given that they do not all aim for the same sustainability standards and they have a broad range of underpinning motivations. There is consensus across stakeholders that a cost-effective system is one that strikes an appropriate balance between capex and opex, and other non-cost aspects. However, given that the return on investment of these systems is not directed back to the RSLs or Councils but indirectly to their tenants, there is no clear metric for this balance, and it is essentially subjective.
ASHPs have been established in the stakeholder interviews as a 'go to' option because they are perceived to be the most cost effective LZCGT. The cost tables show that this perception holds true, as they are the second cheapest system to operate and the cheapest to install after gas. The fact that the capex figures vary so widely indicates that not all of the projects are experiencing this value to the same degree. In particular, the small or rural developments are paying more for ASHP installations, which appears to be due to the premium that they pay for suppliers to travel out to site. The larger developments are seeing lower capex due to economies of scale, and the urban developments have more competitive supply options. The exception to this trend is a rural project and only has four homes, but has the second lowest ASHP capex after the 300-unit project. This is likely because this project is developer-led as it constitutes the Section 75 requirement for a larger development.
Regarding the projects that include other technologies with ASHPs, they will benefit from significantly lower running costs (not captured in the programme-averaged values in Table 17) but these technologies do not necessarily allow for decreased ASHP capex. This was confirmed for one project, which added solar thermal water heating and MVHR in order to meet a higher sustainability standard (full Silver level), but did not switch to a smaller (i.e. cheaper) ASHP model after these additions. Similarly, one project incorporates heat batteries with PV and ASHP across all its homes, but its ASHP costs were significantly increased to accommodate the heat batteries, as these require heat pumps to operate at higher temperatures than is standard. Therefore, it was only possible for this project to include heat batteries because of the funding that it secured.
Arguably, the capex tables suggest that any projects using technologies other than or in addition to ASHPs will not achieve as good a balance between capex and opex. However, although significantly more expensive to install, GSHPs and biomass DHNs are shown to have lower operating costs, making them the most cost-effective options for tenants. The two biomass projects within this study were also strongly driven towards this option by planning policy and therefore had less choice in discerning value for money for these systems.
Lastly, trialling any LZCGT for the first time allows for Councils and RSLs to build their experience with new technologies, which offers value in other ways. This has been observed with two projects which used heat batteries for the first time – both in intentionally small projects (in both cases, two homes within a larger affordable development). These heating systems are not inherently cost effective, as they require sufficient solar electricity to be converted to heat to run at a cost that is competitive with the other LZCGTs considered.
Contact
Email: 2024heatstandard@gov.scot