Energy Efficient Scotland Transition Programme Survey Evaluation
This report presents the social evaluation of the Energy Efficient Scotland Transition Programme, which aimed to support local authorities’ engagement with households and businesses expected to self-fund energy efficiency improvements.
Appendix 1: Transition Programme Engagement Survey Design
Design and administration of the survey
Survey design followed Dilman's (2008) tailored design method:
- 3 point mail-out with pre-letter; survey letter; and reminder postcard
- Design included logos and branding specific to the different projects (coloured images) (see Table 1 for project label used)
- Named address letters where mail merge has been used
- Survey printed as A5 booklet – easy to interpret, appears short
- Survey clearly labelled, and questions ordered with easier ones at beginning, harder ones in the middle and participant information at the end
- Simple and attractive questionnaire design
- Persuasive communication to encourage participation
- Incentive provided in all cases – usually entry into a prize draw for £50 or £100 voucher (see Table 1)
- The survey was developed in collaboration with all project teams, who commented on at least two drafts of the survey and associated materials. This has helped to ensure that questions and response options were applicable to all projects.
Survey distribution
Distribution was via multiple modes of communication to increase sample coverage. The survey was distributed via both email and post (depending on information that project teams had available about participants; participant contact preferences; and ensuring that all of those that have been part of engagement strategies had the opportunity to take part) (see Table 1 for use of email & post across the different projects). The use of email, where possible reduced survey mail-out costs and the need for using resources for print materials.
| Project | Sample population | Survey distribution mode | Incentive | Project label |
|---|---|---|---|---|
| Fife (Burntisland) | Agreed to be contacted | Email + post | £100 shopping voucher | Change Works in Burntisland |
| Fife (Levenmouth) | Agreed to be contacted | Email + post | ||
| Highland | Agreed to be contacted | Email + post | An energy goodie bag | EES, managed by The Highland Council |
| Renfrewshire | Post | £50 Morrisons voucher | Wise Group's Wise About Energy project | |
| Scottish Borders | Agreed to be contacted | £100 shopping voucher | Change Works in Peebles | |
| Energy Agency (East Ayrs) | Project contacted | Post | £100 shopping voucher | EES, delivered by the Energy Agency |
| Energy Agency (D&G) | Project contacted | Post | £100 shopping voucher | EES, delivered by the Energy Agency |
| Scarf (Ellon) | Project contacted | Post | £100 Amazon voucher | Energy Efficient Ellon |
| Scarf (Aberdeen) | Project contacted | Post | £100 Amazon voucher | Energy Efficient Aberdeen |
Sampling
In this case, the population is either those contacted or those that have agreed to be contacted (and provided contact details) subsequent to engagement (dependent on processes used in each project) (see Table for different populations used). "…a population size of 100,000 or greater can be considered large, and populations of fewer than 100,000 could be considered small" (Rea & Parker, 2014: 171). Sample size calculations were for a small population.
Sample size was calculated using equations for surveys that seek to explore proportional scale variables (e.g. proportion of respondents who took action following energy advice) (see Rae & Parker, 2014: 175). Survey sample size was determined with the aim of achieving a 95% level of confidence with a 5% confidence interval (or margin of error), using the equation:
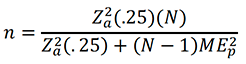
from (Rae & Parker, 2014:169)
Where:
n = sample size; N = population size; Za = Z score for various levels of confidence (95% level = 1.96); MEp= margin of error in terms of proportions (.05)
The target sample size was doubled (or sent to whole population, depending on which is smaller) to account for anticipated 50% response rate (aiming to ensure that the achieved sample was sufficient to make statements at 95% confidence level and +/- 5% confidence interval). This only applies to those populations large enough to enable descriptive statistics; all non-domestic cases were small numbers and the survey was sent to the whole group.
Targeting a larger population than needed for the survey is one way to tackle non-response which is problematic for two reasons: 1) reduction in sample size; 2) response bias (those not responding may share particular characteristics so you miss a portion of the population in the sample).
The Transition Programme survey was sent to 3468 households, and 277 businesses.
| Domestic | Population (Able To Contact) | Sample Size | Sample Size Assuming 50% Response Rate |
|---|---|---|---|
| Fife (Burntisland) | 310 | 172 | 310 |
| Highland | 75 | 63 | 75 |
| Renfrewshire - Wise Group | 544 | 225 | 451 |
| Scottish Borders (Peebles) | 552 | 227 | 454 |
| Energy Agency - East Ayrs | 880 | 268 | 535 |
| Energy Agency - D&G | 435 | 204 | 409 |
| SCARF - Aberdeenshire (Ellon) | 845 | 264 | 529 |
| SCARF - Aberdeen City | 1561 | 308 | 617 |
| Non-domestic | Population (able to contact) | ||
| Fife (Burntisland) | 14 | 13 | 14 |
| Fife (Levenmouth) | 161 | 113 | 161 |
| Highland | 4 | 4 | 4 |
| Scottish Borders (Peebles) | 25 | 23 | 25 |
| Energy Agency - D&G | 63 | 54 | 63 |
| SCARF - Aberdeen City | 10 | 10 | 10 |
A sampling frame is as complete a list as possible of the individuals or elements in the survey population (Pike, p.413). Here, the sampling frame is those individuals approached by a (or who approached) a local authority. Those included in the survey have to have been approached only once. Where possible, the sample included both those that sought subsequent information and those that did not. This was not possible if project teams did not have data for every person that approached the project, for example where a hub-type model was used and people 'dropped-in' without leaving their details.
Sample selection followed simple random sampling. Sampled participants were determined by project teams; requested that this was done randomly.
"In SRS designs, the sample mean is an unbiased estimator of the population mean. That is, if a researcher were to select an infinite number of sufficiently large random samples (i.e., at least 20 elements in each sample), the sample means would be normally distributed and the mean of the sample means would be the population mean." (Pike, 416)
References
De Leeuw, E., Hox, J., Dillman, D. 2008. International Handbook of Survey Methodology. Routledge. New York.
De Vaus, D. 2013. Surveys in Social Research. Routledge. New York.
Pike, G. 2007. Adjusting for nonresponse in surveys. In Smart, J. (Ed.) Higher Education: Handbook of Theory and Research: Volume XXII.
Rea, Louis M., and Richard A. Parker. Designing and Conducting Survey Research : A Comprehensive Guide, John Wiley & Sons, Incorporated, 2014. ProQuest Ebook Central, http://ebookcentral.proquest.com/lib/ed/detail.action?docID=1757959.
Created from ed on 2019-10-16 01:24:47.
Toepoel, V & Schonlau, M (2017) Dealing with nonresponse: Strategies to increase participation and methods for postsurvey adjustments, Mathematical Population Studies, 24:2, 79-83, DOI: 10.1080/08898480.2017.129998
Contact
Email: HeatInBuildings@gov.scot