Energy Efficient Scotland Transition Programme Survey Evaluation
This report presents the social evaluation of the Energy Efficient Scotland Transition Programme, which aimed to support local authorities’ engagement with households and businesses expected to self-fund energy efficiency improvements.
Results and Discussion
The results presented in this section investigate:
- Respondents' engagement with energy efficiency in their property before engaging with the Energy Efficient Scotland programme;
- Respondents' engagement with energy efficiency after the Energy Efficient Scotland programme;
- The impact of engagement on planned and installed measures in respondents' property;
- Opinions on local and national government engagement in domestic energy efficiency improvements at present and in the future;
By way of introduction, the participant demographics and property characteristics are discussed next.
Participant demographics and property characteristics
Age
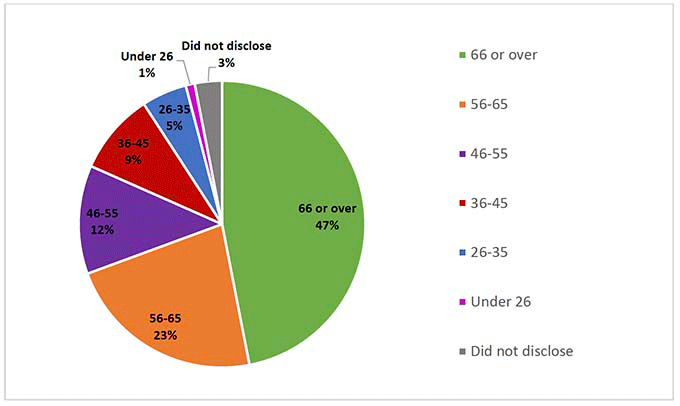
Almost three-quarters of survey respondents were aged 56 or over. The largest age group were 66 years or over (47%), followed by respondents aged between 56-65 years (22%). Respondents aged between 46-55 years comprised 12% of the total; those aged 36-45 years totalled 9%, and those 35 years or under and those that did not disclose comprised 9% of the total (Figure 2). The proportion of older respondents is significant (with Scotland having 19% of population aged 65 and over in 2019[6]) and may explain differences in behaviour and engagement in energy efficiency. There are variations in respondent age groups between local authorities, with East Ayrshire Council having the highest proportion of respondents aged 66 or over, and Highland Council having the highest proportion of those aged 26-35 (Appendix 3, Figure 1). These results are not representative of age differences between Scottish local authorities[7].
Gender
Overall, the survey was largely equal in terms of gender, with 54% of respondents identifying as male, 42% of respondents identifying as female; 4% did not disclose information.
Income
Of those respondents who did disclose annual household income, the highest number of respondents stated they were in the £0-£29,999 category, which is in line with the general statistics for Scotland[8]. The number of respondents decreased as income increased, with the exception of those in the £80,000 and above category who comprised 6% of the total (Appendix 3, Figure 2). This general pattern is repeated across local authorities, with the exception of the Highland Council having a larger proportion of those with a household income of £40,000-£49,999 per annum, and the highest proportion of those earning £80,000-£89,999 (Appendix 3, Figure 2).
Location
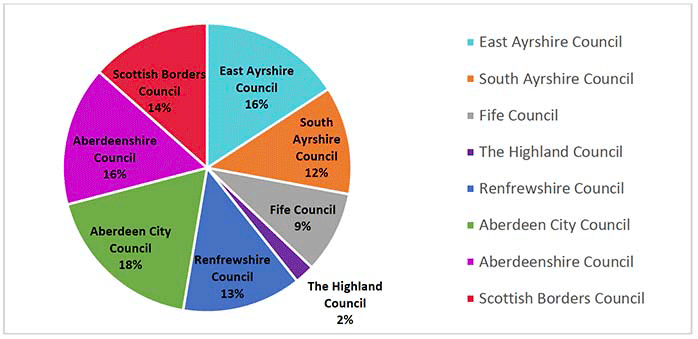
In total, 490 domestic surveys were returned for analysis, which amounts to a 14% response rate across eight local authority areas (Table 2). The response rate varied across authorities; in terms of the sample size, the highest percentage of responses were from the Highland Council (24%, n=18), and the lowest percentage were from Aberdeenshire Council (10%, n=55). Overall the highest number of responses were from East Ayrshire (18%, n=89), and the lowest number from the Highlands (n=18, 4%) (Figure 3).
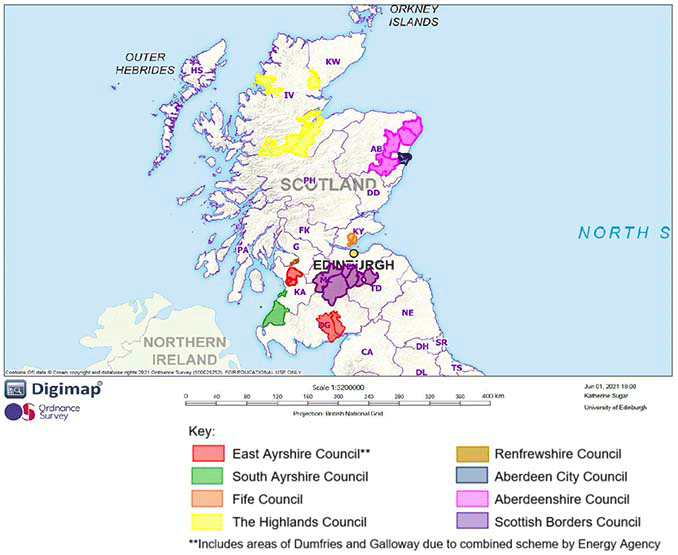
Regarding type of locality[9], more than half of respondents identified as living in a town (63%) and 14% of respondents identified as living in a city; with the exception of Aberdeen City, the local authorities included in the survey were out-with Scotland's main city conurbations (e.g. Glasgow City, Dundee City, Edinburgh City). There were 14% of respondents who identified as living in a village; 5% of respondents stated that they lived in a dispersed rural area and 3% did not disclose this information (Appendix 3, Figure 3). Respondents also provided postcode information and therefore their location is represented in Figure 4. This map indicates only the location of respondents and not the proportion of respondents from that location.
| Local authority | Delivery partner | Sample size (number of surveys sent out) | No. of surveys returned | Response rate of survey per local authority (%) | Proportion of all survey responses received (%) |
|---|---|---|---|---|---|
| East Ayrshire Council | Energy Agency | 535 | 89 | 17% | 18% |
| South Ayrshire Council | Energy Agency | 409 | 54 | 13% | 11% |
| Fife Council | Changeworks | 310 | 67 | 22% | 14% |
| The Highland Council | None | 75 | 18 | 24% | 4% |
| Renfrewshire Council | Wise Group | 451 | 50 | 11% | 10% |
| Aberdeen City Council | SCARF | 617 | 79 | 13% | 16% |
| Aberdeenshire Council | SCARF | 529 | 55 | 10% | 11% |
| Scottish Borders Council | Changeworks | 454 | 78 | 17% | 16% |
| Total | 3380 | 490 | 14% | 100% | |
The majority of respondents (91%) lived in owner-occupied properties. This was the primary target group for the household survey as they were considered most likely to be in a position to self-fund energy efficiency measures (tenants are unlikely to have responsibility for the fabric of the property) (Appendix 3, Figure 5). Responses correlated with data from the Scottish Household Survey, which shows that the largest proportion of owner occupiers is in East Renfrewshire, followed by East Dunbartonshire and Aberdeenshire - some of these local authorities were included in this survey. Of the remaining respondents, 2% were private-renters, 2% were social-renters, 1% were owners of property-to-let (i.e. landlords), and 1% classified as other (e.g. lived with another family member who owned the property)[10].
Property Characteristics
The most common form of existing energy efficiency measure in respondents' homes was double glazing (93%), followed by loft insulation (82%). Only a quarter of respondents had cavity wall insulation, and the least common forms were solid wall insulation (13%) and renewable technologies (e.g. solar PV) (11%) (Appendix 3, Figure 6). The differences in energy efficiency measures may be due to the age of the property (e.g. older versus newer buildings), the tenure type (e.g. semi-detached versus terraced), tenancy type (e.g. rented versus owner-occupied), or a general lack of respondent knowledge about energy efficiency.
The type of heating used most frequently was gas central heating with radiators (76%) (Appendix 3, Figure 7). No respondents used portable gas heaters (calor gas or paraffin heaters), and warm air central heating, fixed gas fire/gas convector and heat pump systems were also rarely used (1%). These results are expected as the majority of UK households use mains gas as their primary source of heat.
Scotland has a higher proportion of domestic properties that do not use mains gas as primary heating source (22%), than the average in Britain (16%)[11]. As expected, the most frequent forms of heating vary between Scottish local authorities (Appendix 3, Figure 8). Whilst most respondents used gas central heating, the Highlands Council respondents are an exception, with higher rates of electric, oil, LPG or biomass central heating, and solid fuel. In addition to the Highlands, a higher proportion of respondents in the Scottish Borders and Aberdeenshire used these forms of heating. These results are in line with studies showing that non-gas dependent households (i.e. using high carbon fuels like oil, LPG and coal) are more common in remote and rural areas[12].
Energy efficiency knowledge
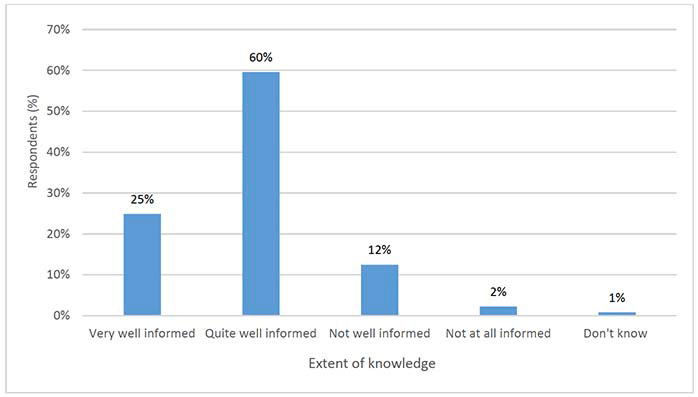
Overall, respondents felt adequately informed about energy efficiency; with 85% stating that, they were either 'quite well informed' (60%) or 'very well informed' (25%), in comparison to those who felt they had limited knowledge (15%) (Figure 5). Across local authorities, the highest proportion of respondents who felt well informed were in the Scottish Borders (38%), Fife (31%) and South Ayrshire (30%) (Appendix 3, Figure 9). The highest proportion of respondents who felt uninformed were in the Highlands (6%) and Aberdeenshire (4%).
Respondents were asked whether they have ever purposely sought advice for improving efficiency in their homes. Sixty-three per cent of respondents said they had deliberately sought advice; 7% said they had received advice by chance, and 29% said they had not sought such advice (Appendix 3, Figure 10).
The high proportion of respondents who had deliberately sought advice demonstrates proactive engagement and is evidence of the kind of positive behaviour required for net-zero targets. The fact that over a quarter of respondents had not sought advice is conversely indicative of the challenges faced by governments.
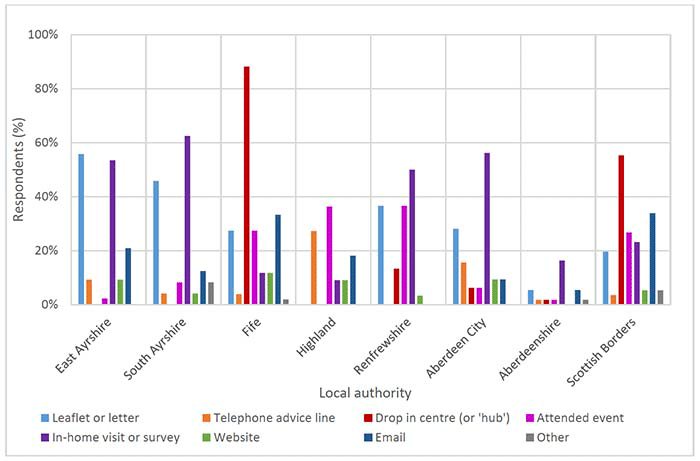
There was variability between local authorities in the proportion of respondents who deliberately sought energy efficiency advice (Appendix 3, Figure 11) with Fife and the Highlands having the largest proportions who had deliberately sought advice (84% and 83% respectively) in comparison to Aberdeenshire, which had the lowest proportion (44%). Most respondents who found advice by chance were in Aberdeen City (11%).
Engagement with Energy Efficient Scotland
As stated previously, surveys were sent only to households who had some initial engagement with their local authority and had consented to follow-up research.
Just over half of survey respondents (54%) recalled receiving energy efficiency advice in the last 12 months, although 40% did not, and 6% answered that they could not remember whether they had or had not received advice.
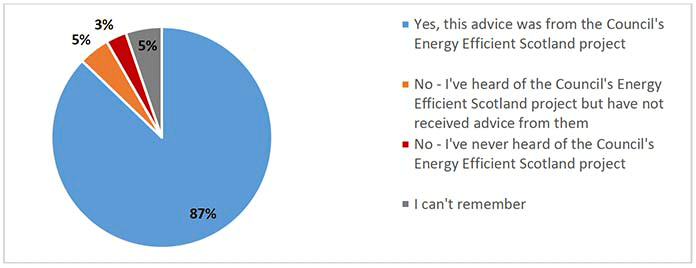
Those that recalled receiving advice were asked whether this was from the council's Energy Efficient Scotland project. As shown in Figure 6, more than three-quarters (87%) of these respondents recalled that the advice was from the project. This demonstrates a strong presence, memorable engagement and strong public awareness of the Council's Energy Efficient Scotland programme across all local authority areas. Comparatively, the highest proportion of people recalling advice were from Fife and the Scottish Borders (Table 3).
Lack of recollection of engagement with Energy Efficient Scotland is likely to stem from multiple, inter-related factors. These include the differential strategies adopted by Councils, the different geographies, housing types and population demographics, and the interactions between Councils, delivery partners and the local population, all influencing capacity to promote the project, and to create a memorable, material impact. Understanding the differential impact of strategies, and their material consequences, hence needs more research.
| Local authority | Delivery partner | Proportion of respondents who recalled receiving advice from Energy Efficient Scotland |
|---|---|---|
| Fife Council | Changeworks | 98% |
| Scottish Borders Council | Changeworks | 93% |
| South Ayrshire Council | Energy Agency | 88% |
| Renfrewshire Council | Wise Group | 87% |
| East Ayrshire Council | Energy Agency | 86% |
| Aberdeen City Council | Scarf | 84% |
| The Highland Council | None | 78% |
| Aberdeenshire Council | Scarf | 57% |
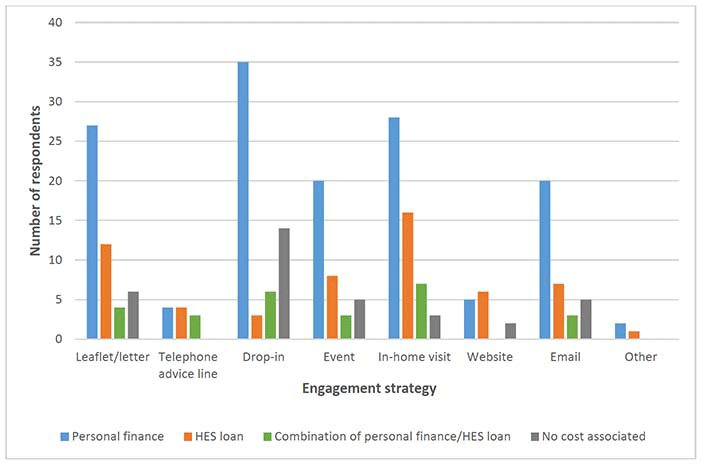
Those respondents who did recall advice from the local authority's Energy Efficient Scotland project, were asked what form this took (Figure 7). This question was open to multiple responses, because multiple engagement strategies were used in each pilot. For all local authorities, the most common engagement strategy recalled by respondents was in-home visit and/or home energy survey (38%), followed by drop-in centre (or 'hub') (31%), and leaflet or letter (31%). Engagement methods such as drop-in centres and in-home visits require in person interaction, which may be more memorable. In this sample however, recall of leaflet or letter contact was equal to recall of drop-in centre contact. Website and advice lines were far less commonly recalled[13]. Strategies that do not require face-to-face contact, such as telephone advice lines or websites may therefore be less memorable.
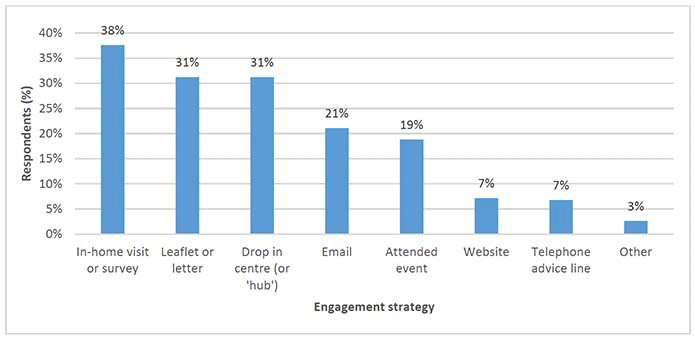
N.B. For this question, respondents had the option to select more than one option from the list provided, therefore the total does not add up to 100%.
N.B. For this question, respondents had the option to select more than one option from the list provided, therefore the total does not add up to 100%.
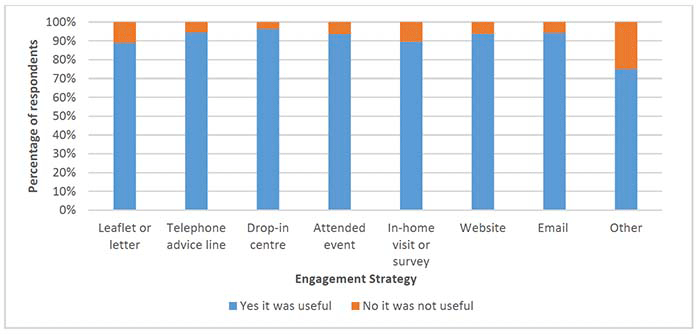
Respondents who did recall advice from the council's Energy Efficient Scotland programme were asked to reflect on whether the advice was useful[14]; this can be used as an indicator of how effective the advice was, and its likely potential to stimulate change.
The majority of respondents (89%) stated that the advice was useful, indicating the positive impact of the programme. When the data are ranked according to type of engagement which is perceived most useful (Figure 9), the drop-in centres had the highest percentage of respondents who thought the advice received was useful (n=80). This was followed by telephone advice line and website. Of those respondents stating that the advice was not useful, the 'other' category' scored highest (e.g. social media, referral from a friend), but in-home surveys and visits, leaflets and letters were also perceived as unhelpful in some cases. The reasons behind this are discussed later (Figure 17).
As noted previously, the different engagement strategies require different levels and types of contact, from in person to web page. This may result in different levels of trust and momentum. For example, those who engaged via in-home visit or survey were most likely to recall receiving advice. Advice received via a drop-in centre was, however, marginally more likely to be regarded as useful than other methods. Multiple methods of contact were used in each project, which excludes the possibility of testing the impacts of each method in isolation. In practice, reinforcing the messages and advice via multiple methods seems likely to be required to create and sustain momentum to act on home energy efficiency.
Impact of Energy Efficient Scotland engagement
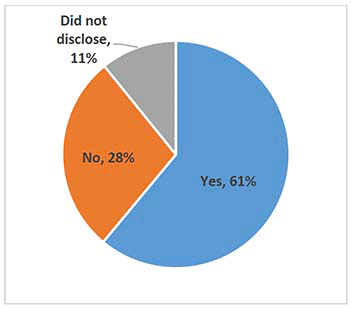
Respondents were asked whether they had installed, or planned, any measures to improve energy efficiency of their homes. Overall all types of advice had a positive impact, with 61% of respondents taking action, while 28% did not, and 11% did not disclose (Figure 10). We cannot however compare action following advice with action in similar households who had not received advice, because of lack of a matched control group.
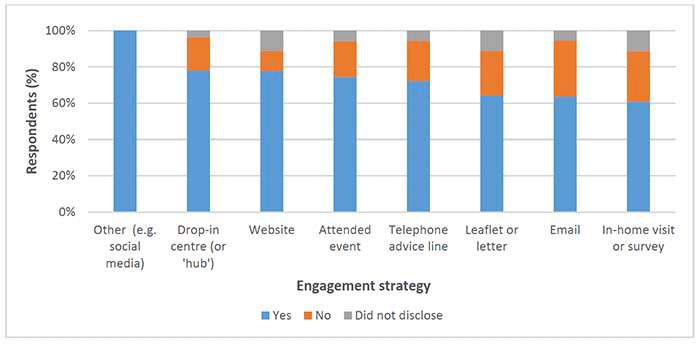
Examining the interaction between engagement strategy and actions taken (Figure 11) suggests that uptake varied to some extent according to engagement. Respondents engaged by 'other' strategies (such as social media or referral from a friend) appeared most likely to act; however the small number in this group (n=3) make these findings unreliable; this was followed by drop-in centre or 'hub' (78%) and website (78%), event (73%) and phone contact (72%). Given the small differences between each of these, further research would be needed to provide a robust test of effectiveness.
Respondents also planned further home energy efficiency measures, following advice, relative to those installed. Local authority projects had different start and end dates, and there were gaps between the end of each project and collection of survey data. This may have affected measures of action taken and planned. Notably respondents who received advice earlier had more time to install measures.
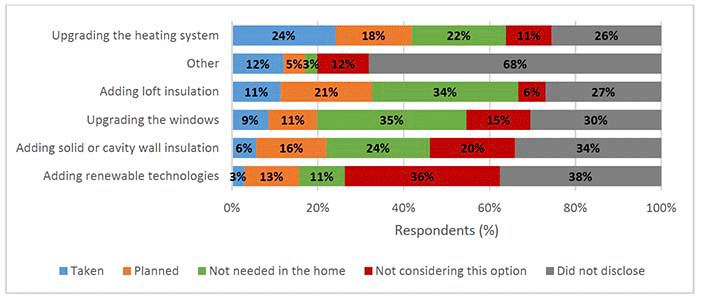
Most frequent changes reported were upgrades to heating systems (24%). With regard to planned actions, most respondents were planning to add loft insulation (21%). Very few respondents were considering renewable technologies (Figure 12). These findings are expected, since 76% of respondents used gas central heating, which was likely to be the biggest opportunity for improvements.
Financing energy efficiency improvements
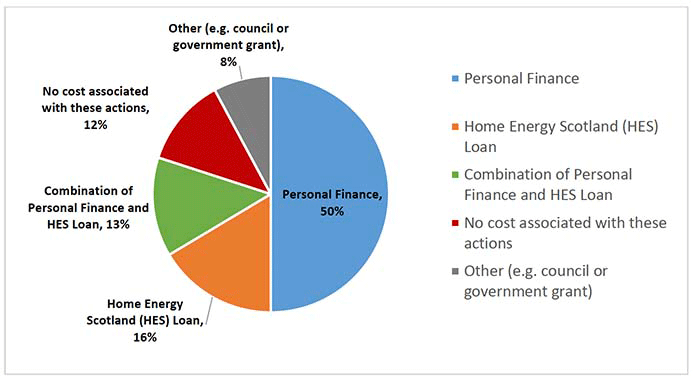
Respondents were asked how they financed these measures. Half stated they used personal finance; 16% used Home Energy Scotland (HES) loans, and 13% used (or planned to use) a combination of personal finance and HES loan (Figure 13). These results correlate with results from the Phase 2 evaluation which found that householders relied mainly on personal finance; the HES loan requirement for an upfront payment also tended to deter householders from proceeding with measures[15].
Personal finance and Home Energy Scotland loans were used most frequently for upgrading the heating system (Figure 14). For future measures, personal finance was most frequently planned for loft insulation, and Home Energy Scotland loans were most frequently planned for solid or cavity wall insulation.
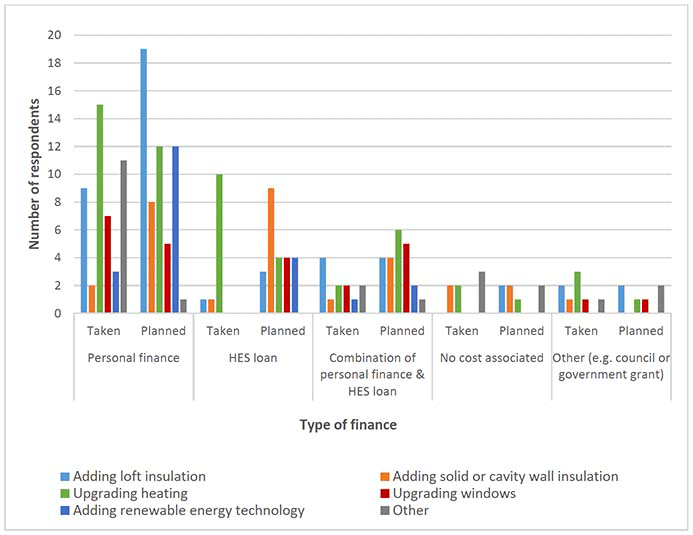
We can also investigate the different types of finance by engagement strategy (Figure 15). Personal finance was used most by those engaged via drop-in centre and in-home visit, whereas HES loans were used most by those engaged by in-home visit. Combined personal finance and loan was also used most by those engaged by an in-home visit, whereas actions with no additional cost were mostly associated with drop-in centre engagement.
Tentative interpretation of findings suggests that drop-in centres were most likely to stimulate action (specially heating upgrade), resulting particularly in use of personal finance, and respondents considered this method of engagement to be particularly useful (Figure 9). Drop-in centres also appeared to be the most effective for prompting respondents to implement measures with no additional costs, such as turning down thermostats where possible.
On the other hand, in-home surveys were most likely to prompt planned actions, specifically solid or cavity wall insulation, which would be funded by HES loans. This is despite respondents commenting that in-home surveys had limited impact (Figure 11), and suggests that such surveys could stimulate planned change, including through promotion of HES loans.
Barriers to energy efficiency engagement
Despite 89% of respondents finding the Energy Efficient Scotland advice useful, 28% of these had not installed, and did not plan to install, any measures to improve energy efficiency in their homes (Figure 10).
Almost half of these not taking any action[16] stated that cost was the primary factor (Figure 16). Cost is a well-documented barrier to energy efficiency upgrades, and this finding reinforces arguments for accessible incentives and financial support[17]. Furthermore, the finding correlates with information about household income, with most respondents in the £0-£29,999 yearly income bracket.
Respondents also commonly stated that there were 'other' factors stalling energy efficiency measures; for example, projects were perceived as time consuming; unlikely to provide a suitable return on investment, and respondents were considering several options. On the other hand, only 2% of respondents thought that the process was too complicated, suggesting that 'the hassle' factor blocking action on energy efficiency may be over-stated[18].
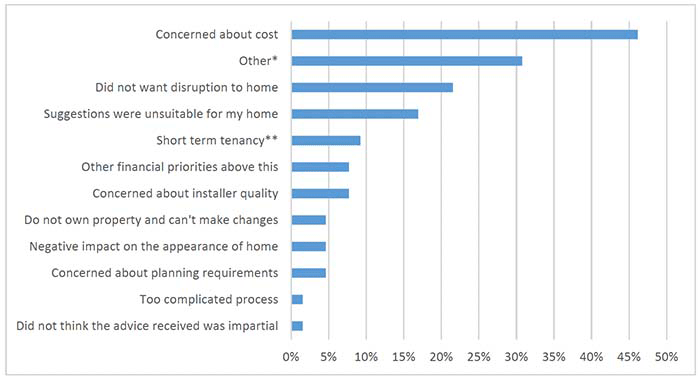
*'Other' reasons stated by respondents varied, but included time-consuming elements, age, and considering several options. **Short term tenancy and will not be here long enough to see full benefits.
Among the small proportion of respondents who did not find the advice useful (11%), 62% stated that this was because they already knew the advice; 35% answered 'other', and 19% stated that the advice was not relevant (Figure 17). This corresponds with previous findings (Figure 5) that respondents had good knowledge of energy efficiency measures, with 75% of respondents 'very well informed' or 'quite well informed'. All respondents understood the advice, and none said that they did not trust it. This positive finding indicates that there were no problems with trust or perceived bias, reinforcing earlier findings (Figure 16).
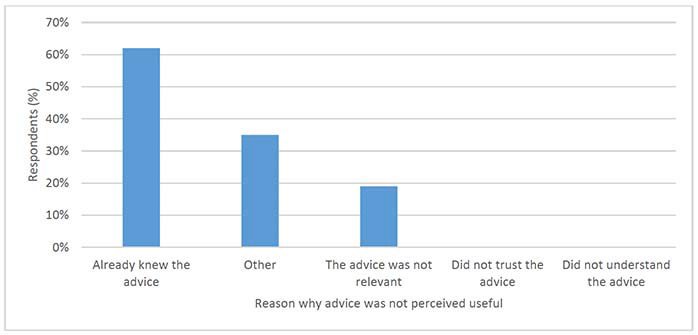
*'Other' reasons stated by respondents were related to cost implications of projects, respondents waiting a long time for information, and properties in conservation area did not have tailored information
Future energy efficiency engagement
To aid learning and development for future energy efficiency programmes, respondents were asked hypothetical questions regarding engagement and future schemes.
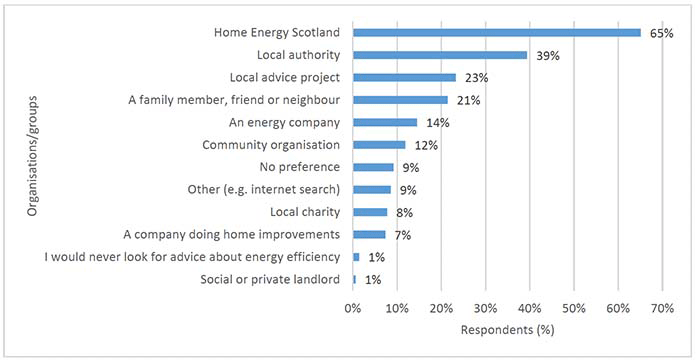
Respondents were asked, if they were looking for energy efficiency advice, which organisations or groups they would trust to provide it[19]. The findings show that the most common organisation/group that respondents would trust is Home Energy Scotland (65%), followed by their Local Authority (39%) (Figure 18); there is also reasonable household trust in local authorities, although not perfect[20]. Only 1% of respondents answered that they would never look for advice about energy efficiency, demonstrating broad willingness to engage.
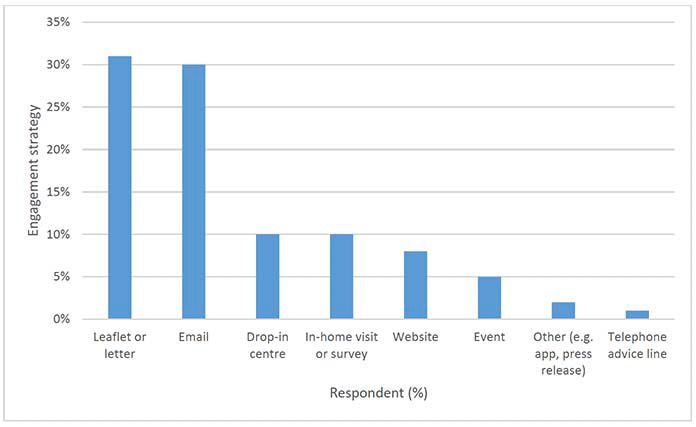
The engagement strategy most preferred for future engagement was leaflet or letter, followed by email (Figure 19). These methods did not however score as highly in terms of improvements done or planned (Figure 11), or 'usefulness' (Figure 9), or recall (Figure 7). This finding is therefore ambiguous.
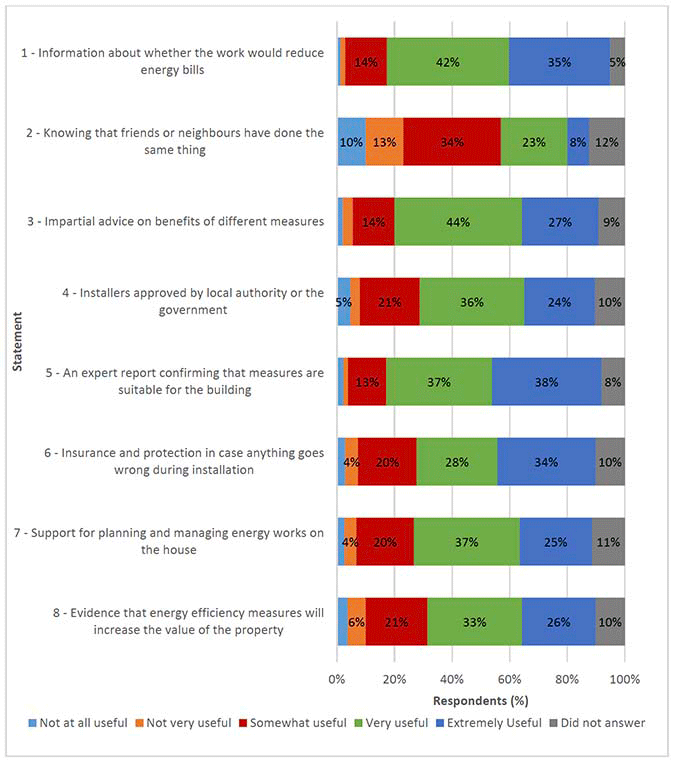
The subsequent question asked respondents what they would find most useful when deciding about energy efficiency improvements (Figure 20). Most said 'information about whether the work would reduce my energy bills' (78% combined total of 'very useful' and 'extremely useful'). This was closely followed by 'an expert report confirming that measures are suitable for the building' (75% combined total of 'very useful' and 'extremely useful'). This corresponds with views about costs of energy efficiency and indicates the need for more detailed advice tailored to the property.
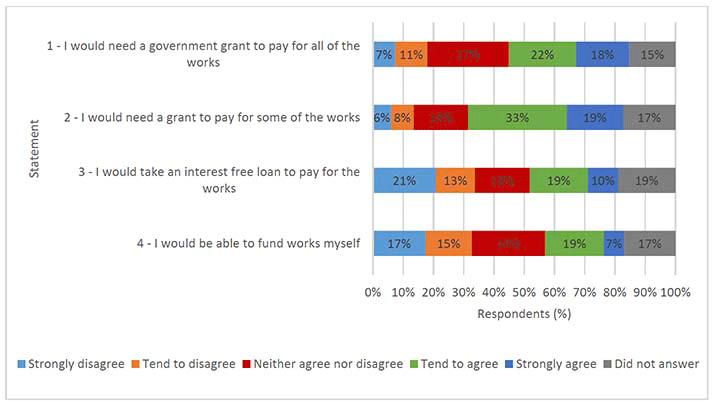
Respondents were also asked how they would expect to pay for any future energy efficiency improvements (Figure 21). Most agreed with the statement that they would need a grant to pay for at least some of the works (19% strongly agreed; 33% tended to agree). In addition, just over a third disagreed with the statement that they would use an interest-free loan (21% strongly disagreed; 13% tended to disagree), although close to a third (29%) indicated agreement, indicating the diversity of reactions to borrowing to finance improvements. This corresponds with results showing that 50% of respondents paid, or were planning to pay, using personal finance (Figure 13), and 46% did not proceed with improvements due to concern about costs (Figure 16).
Finally, when asked whether they required more information about improving energy efficiency in their homes, two thirds (67%) answered no; 25% answered yes and 9% did not answer, suggesting that despite apparent general willingness to engage, there is a high degree of inertia over household retrofit.
Contact
Email: HeatInBuildings@gov.scot