Deferred entry to primary school: statistics
Analysis to inform the understanding of trends and variations in deferral rates and the characteristics of pupils identified as having deferred entry to primary school.
Characteristics of children who deferred entry to primary school
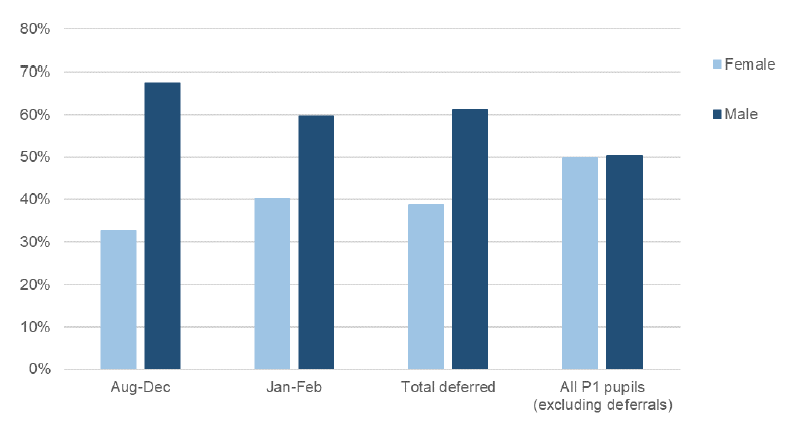
Sex
Figure 8 shows that P1 pupils who deferred entry to primary school were more likely than other P1 pupils to be male.
In 2018, 61% of deferred pupils were male, compared with 50% of all P1 pupils excluding deferrals A higher proportion of pupils who were born from August to December and who deferred were male (67%) than those born in January and February (60%).
Additional Support Needs
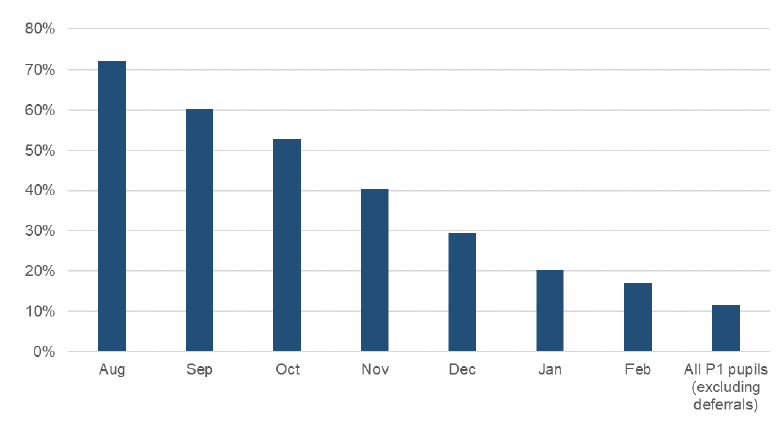
The proportion of P1 pupils with ASN is higher for deferred pupils than other P1 pupils (Figure 9). The rate of pupils with ASN varies from 72% for the oldest deferred pupils born in August, decreasing for each month of birth to 17% for deferred pupils born in February. This compares with 12% of all P1 pupils excluding deferrals.
Disability
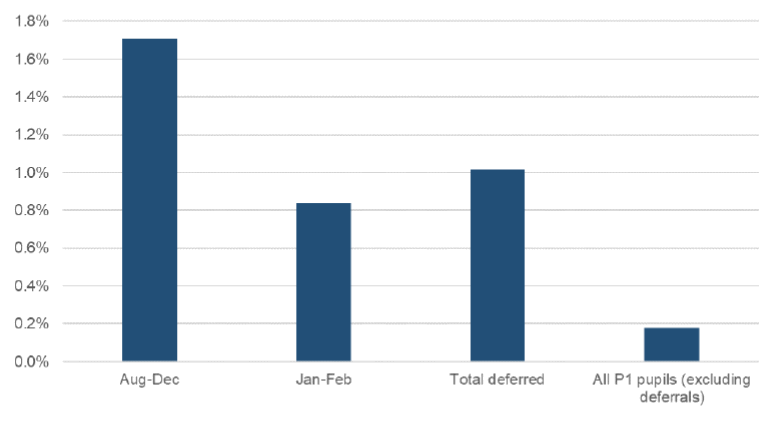
Deferred pupils are more likely to have a disability than other P1 pupils. 1.0% of all deferred pupils in P1 have a disability (Figure 10). The rate of disability in this group is around six times as high compared to all P1 pupils excluding deferrals, of whom 0.2% have a disability.
Among deferred pupils born in January and February, 0.8% have a disability. While for those born from August to December, 1.7% have a disability.
The number of P1 pupils with a disability is relatively small, so the figures have not been broken down by month of birth.
Scottish Index of Multiple Deprivation (SIMD)
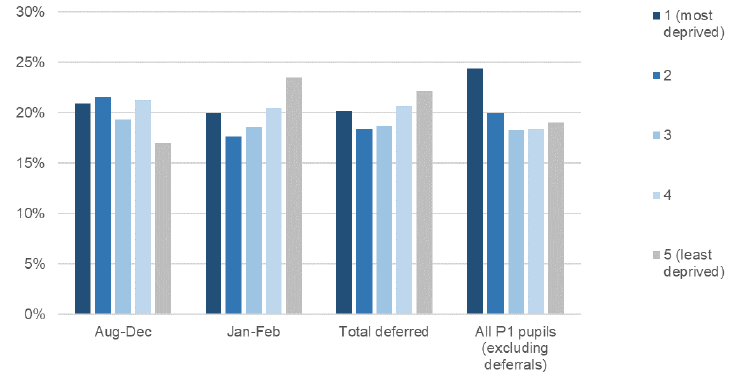
Figure 11 shows 20% of deferred pupils are from the 20% most deprived areas of Scotland. This is lower than the 24% of all P1 pupils excluding deferrals from the 20% most deprived areas. There was a similar proportion of P1 pupils to have deferred from the 20% most deprived areas born in January and February (20%) and August to December (21%).
This is in contrast to pupils from the 20% least deprived areas of Scotland. A higher proportion of deferred pupils were from the 20% least deprived areas (22%) than for all P1 pupils excluding deferrals (19%).
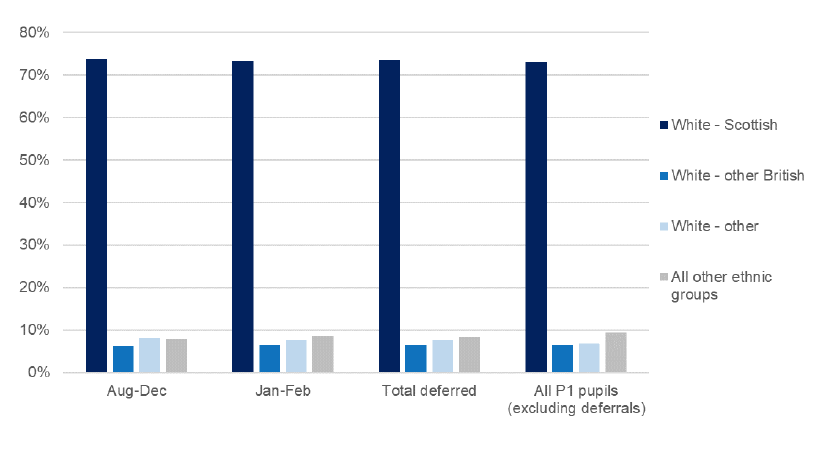
Ethnicity
The same proportion (73%) of deferred pupils and all pupils excluding deferrals were recorded as White-Scottish ethnicity in 2018 (Figure 12).
The proportion is also very similar by age group for deferred pupils; 74% of those born from August to December and 73% of those born in January and February were White-Scottish.
How to access background or source data:
Crown Copyright
You may use or re-use this information (not including logos) free of charge in any format or medium, under the terms of the Open Government Licence. See: www.nationalarchives.gov.uk/doc/open-government-licence/