Deferred entry to primary school: statistics
Analysis to inform the understanding of trends and variations in deferral rates and the characteristics of pupils identified as having deferred entry to primary school.
Estimated rates of deferred entry to primary school
Rates of deferred entry to primary school have been estimated by comparing the number of pupils born in the same month and year in P1 over two years.
For example, to estimate the rate of deferral for February in 2018, the number of pupils born in February 2013 and in P1 in 2018 was taken as the number of deferred pupils. The number of pupils born in February 2013 and in P1 in 2017 was taken as the number of pupils who did not defer. The deferral rate was then calculated as the number of deferred pupils divided by the total number of deferred and non-deferred pupils combined.
This method does not account for migration or deaths occuring between the two years, so it only provides an estimate of the rate of deferral.
A much higher rate of deferral for those born in January and February is expected due to children born in those months being the youngest in their stage if they don't defer. The statutory entitlement to an additional year of funded ELC for children who defer and are born in January and February might also affect the decision on whether to defer.
Rate of deferral over time
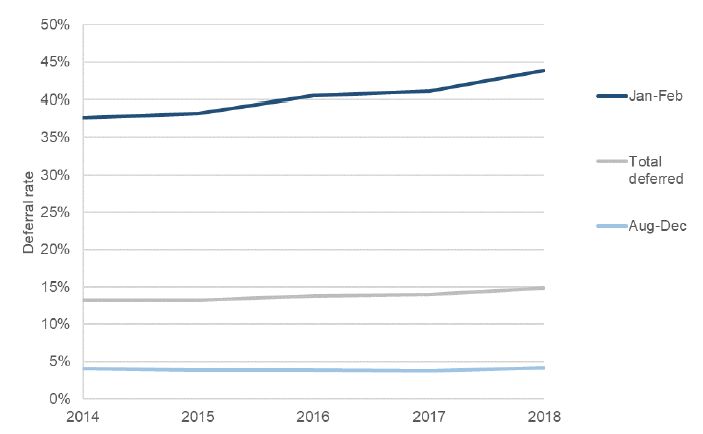
Figure 1 shows the estimated rate of deferred entry to primary school has increased over the last five years. In 2018 the total estimated rate of deferral was 15%, up from 13% in 2017.
This increase has been driven by deferrals in the January and February age group, for which the estimated rate increased from 38% in 2014 to 44% in 2018. The deferral rate for those born from August to December remained broady stable at around 4% over the period.
Sex
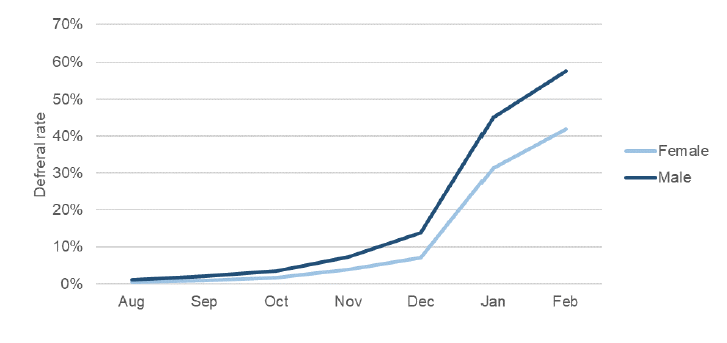
Figure 2 shows that male pupils had a higher estimated rate of deferred entry to primary school than females across all eligible months of birth in 2018.
For males, the deferral rate increases from 1% for those born in August to 14% for December births, before increasing to 45% and 58% for those born in January and February respectively.
For females, the rate of deferral follows a similar pattern by month of birth, but always at a lower rate than for males. 0% of females born in August defer, increasing to 7% for those born in December, 31% for January and 42% for February.
Additional Support Needs (ASN)
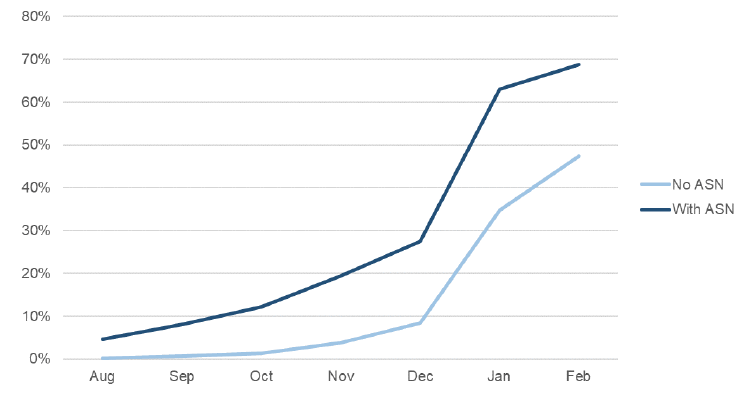
The rate of deferral for pupils with an ASN recorded was much higher than for pupils without an ASN in 2018 (Figure 3).
The largest gap in the rate of deferral between pupils with and without an ASN was for those born in January. The rate of deferral for those born in this month with an ASN was 63%, compared with 35% for pupils without an ASN, a gap of 28 percentage points.
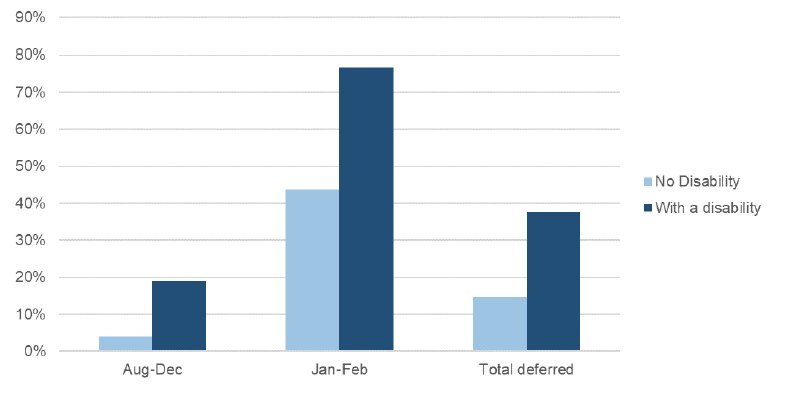
Disability
The estimated rate of deferral for pupils is around two and a half times as high among pupils with a declared or assessed disability compared to pupils without a disability (Figure 4). For all pupils eligible to defer entry to primary school, 38% of those with a recorded disability deferred in 2018, compared with 15% without a recorded disability.
For pupils born from August to December, the estimated rate of deferral was 19% for pupils with a disability recorded compared with only 4% for pupils with no recorded disability.
Pupils born in January and February with a recorded disability have an estimated deferral rate of 77%. This compares with a deferral rate of 44% for pupils with no recorded disability.
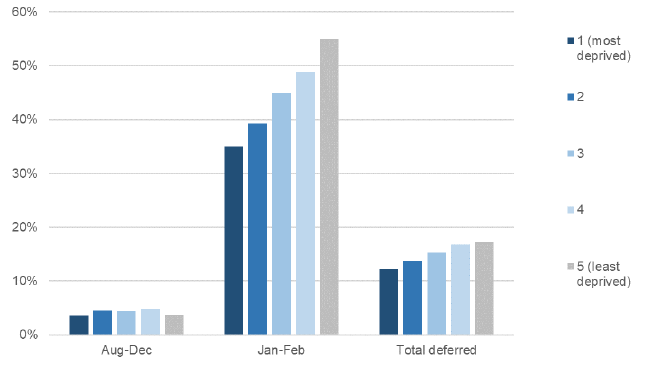
SIMD
Figure 5 shows that the estimated rate of deferred entry to primary school increases as the area deprivation of a pupil's home postcode decreases for those born in January and February. 35% of pupils born in January and February living in SIMD quintile 1 (the 20% most deprived areas of Scotland) deferred entry to primary school, compared with 55% of those living in SIMD qunitile 5 (the 20% least deprived areas).
For pupils born from August to December, the estimated rate of deferral is much more consistent, varying slightly from a low of 4% for pupils from SIMD quintile 1 to a high of 5% for those living in SIMD quintile 4 (the 21% to 40% least deprived areas in Scotland), decreasing again to 4% for pupils in SIMD quintile 5.
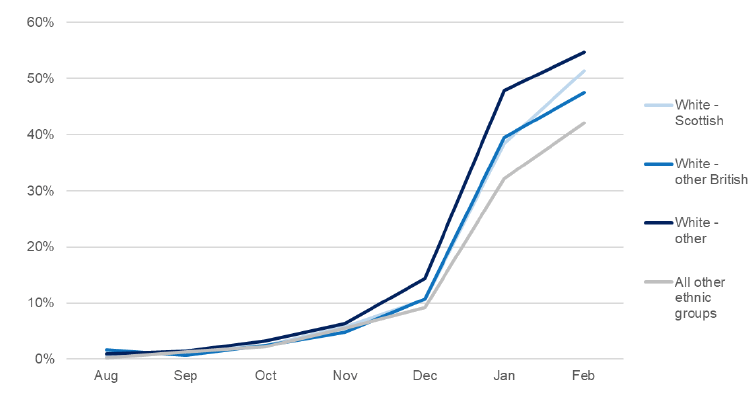
Ethnicity
The estimated overall rate of deferral for P1 pupils is equal (14.9%) among White-Scottish and White-other British pupils (Figure 6), and followed a similar pattern by month of birth across each ethnicity grouping.
Local authority
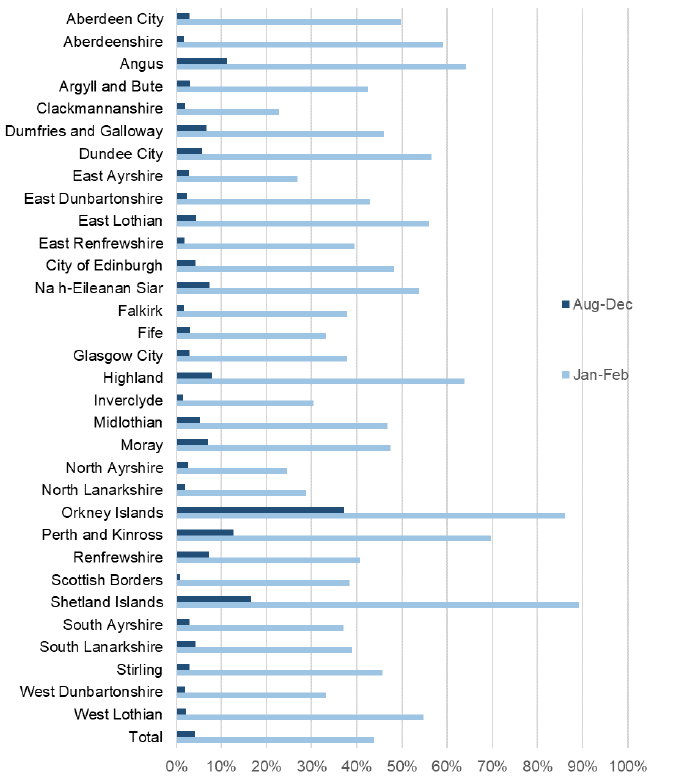
The estimated rate of deferred entry to primary school for pupils born in the August to December, and January and February age groups are shown in Figure 7. There is considerable variation in the rate of deferral across local authorities
For pupils born in January and February, by far the highest deferral rates were found in Shetland Islands (89%), and Orkney Islands (86%). Perth and Kinross (70%), Angus (64%), and Highland (64%) also have relatively high rates of deferral for this age group in 2018. The lowest rates of deferral for pupils born in January and February were found in Clackmannanshire (23%), North Ayrshire (25%), and East Ayrshire (27%).
For pupils born from August to December, the highest deferral rates were found in Orkney Islands (37%), Shetland Islands (17%), and Perth and Kinross (13%), the same authorities that had the highest rates for January and February birthdays. The lowest rates of deferral for pupils born from August to December were in Scottish Borders, (1%), Inverclyde (1%), and Aberdeenshire (2%).