Crab and lobster fisheries - stock assessments: results 2016 to 2019

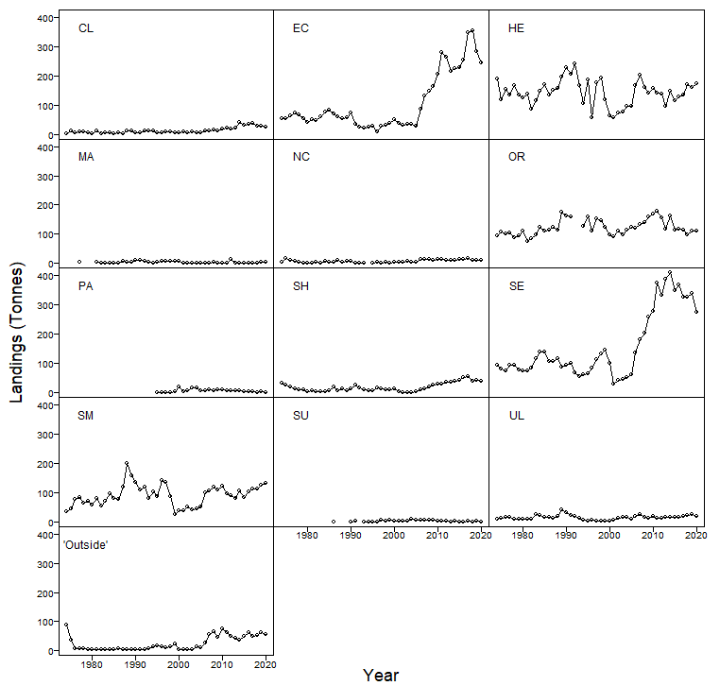
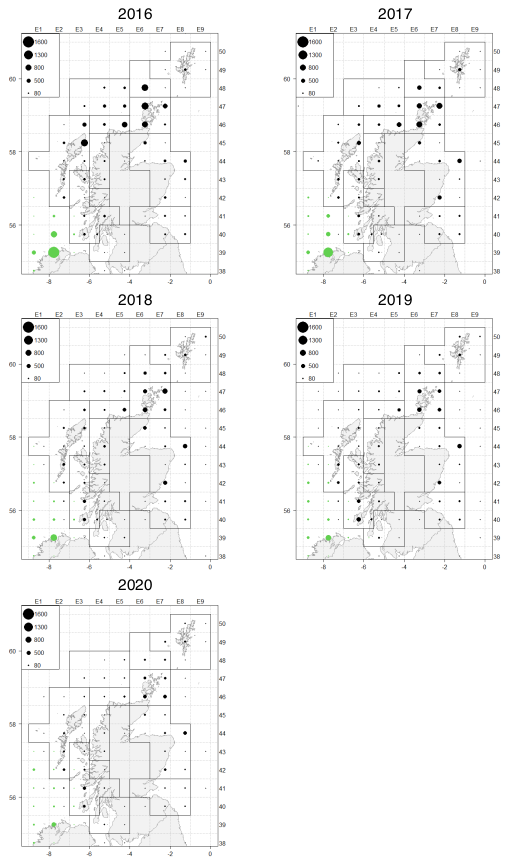
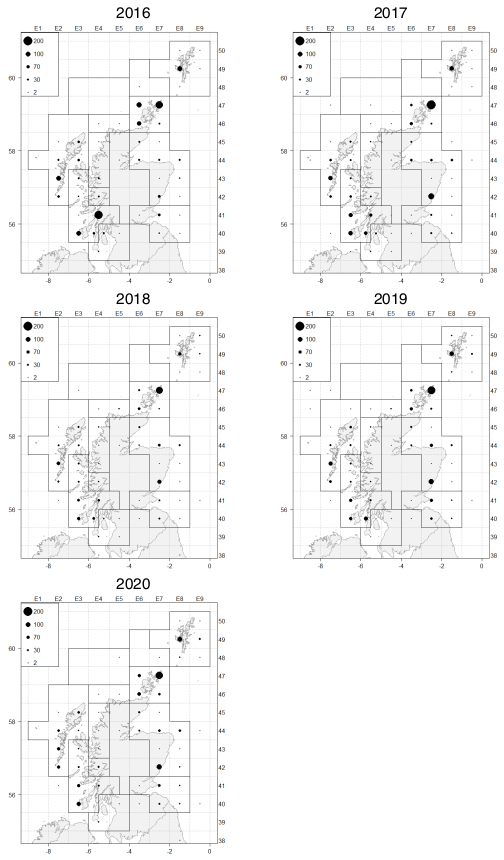
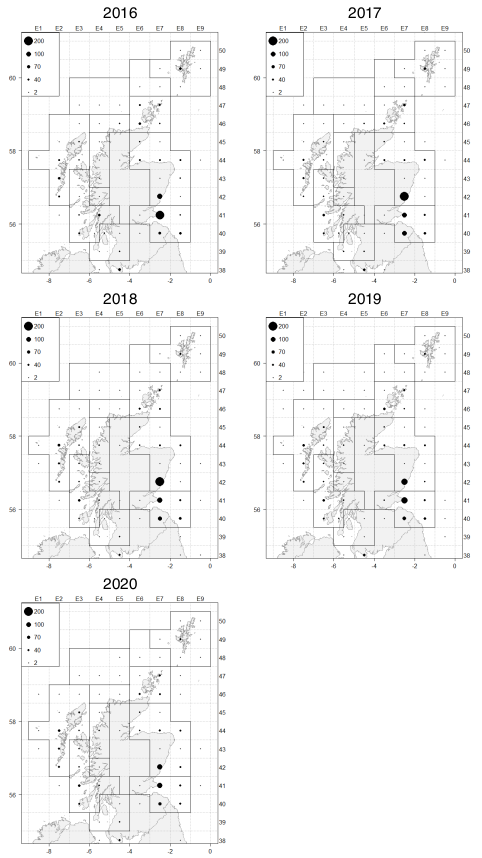
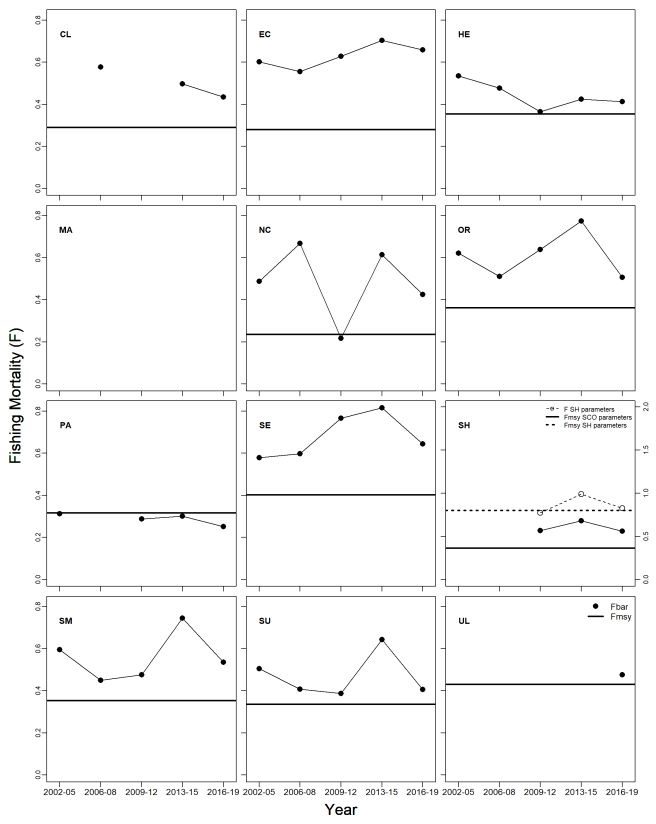
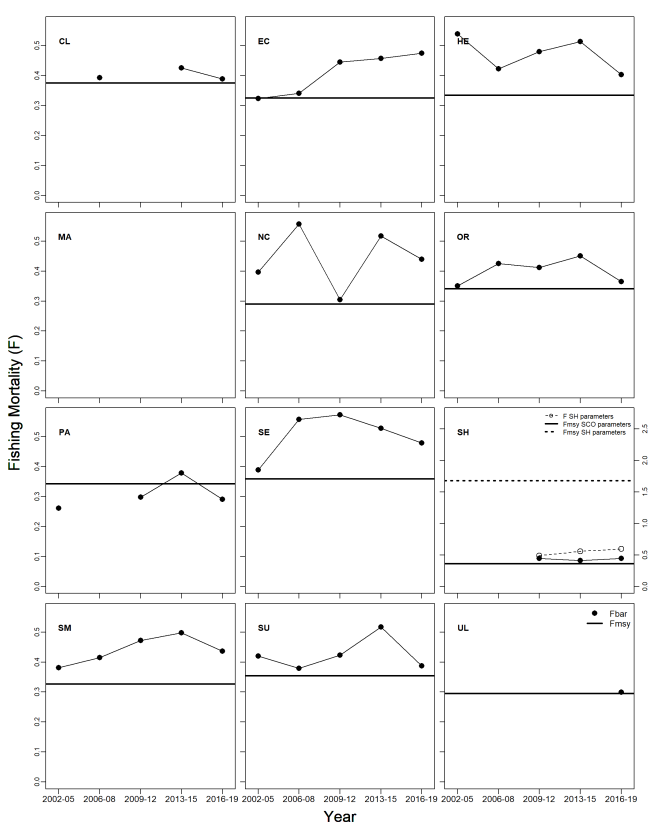
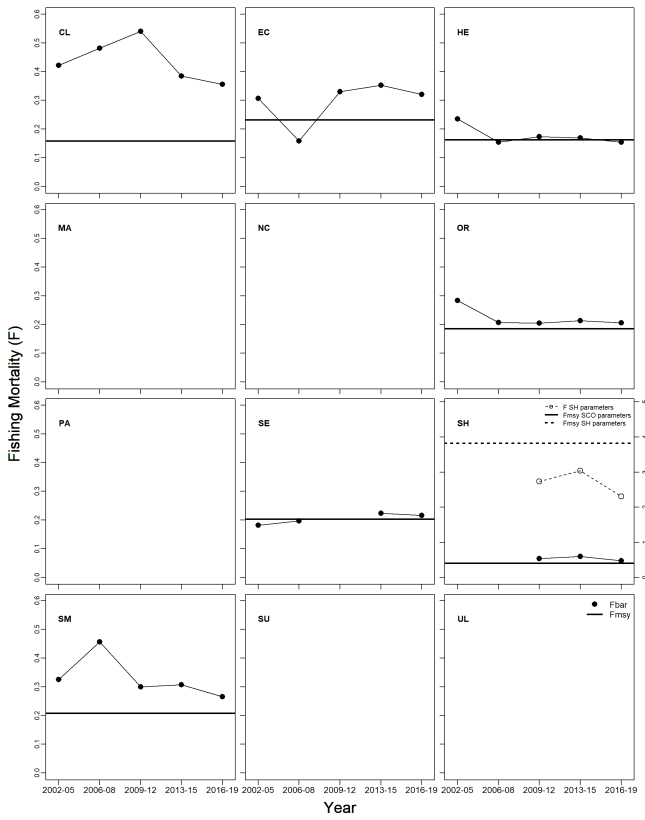
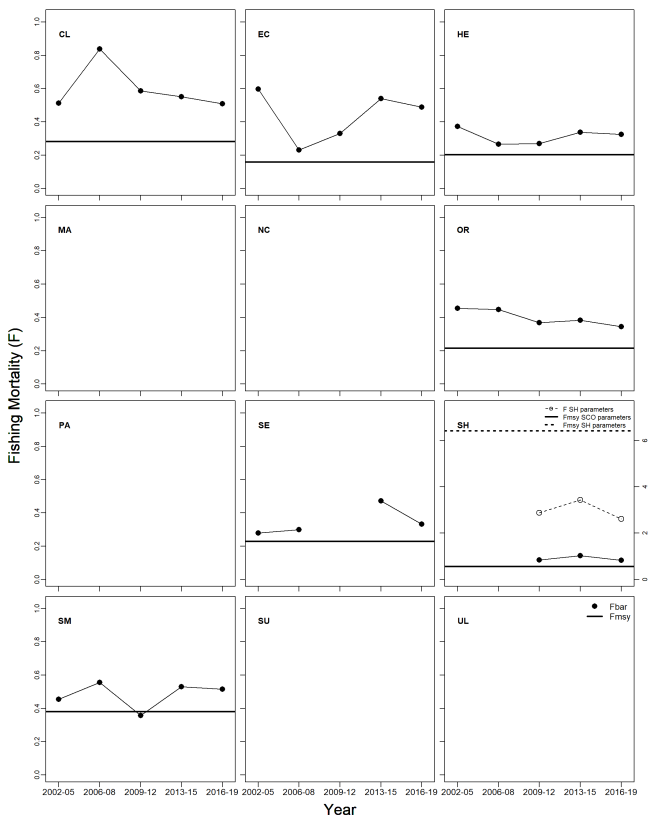
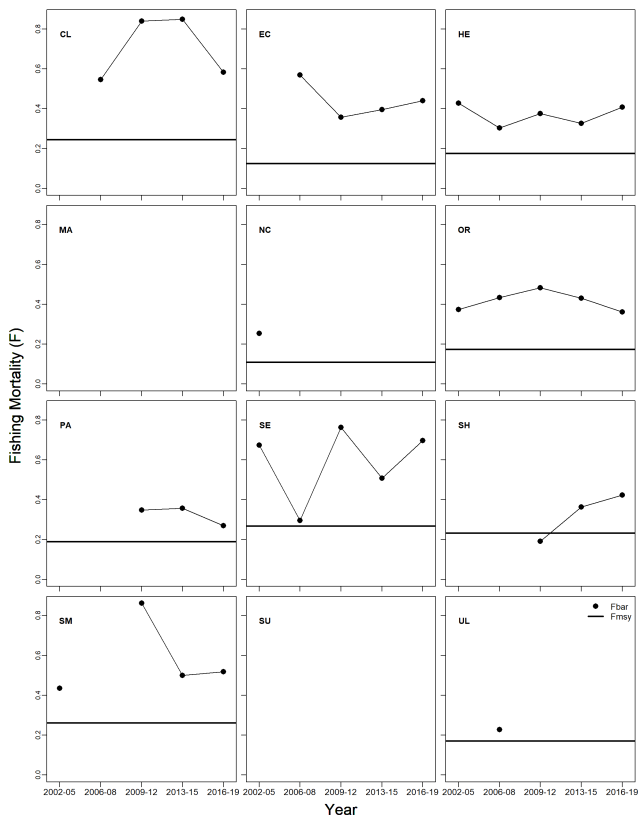
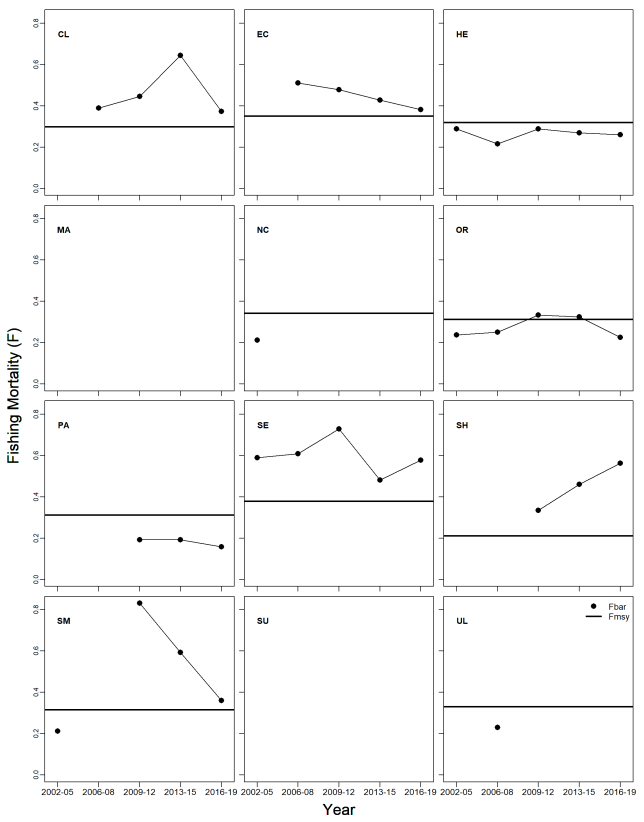
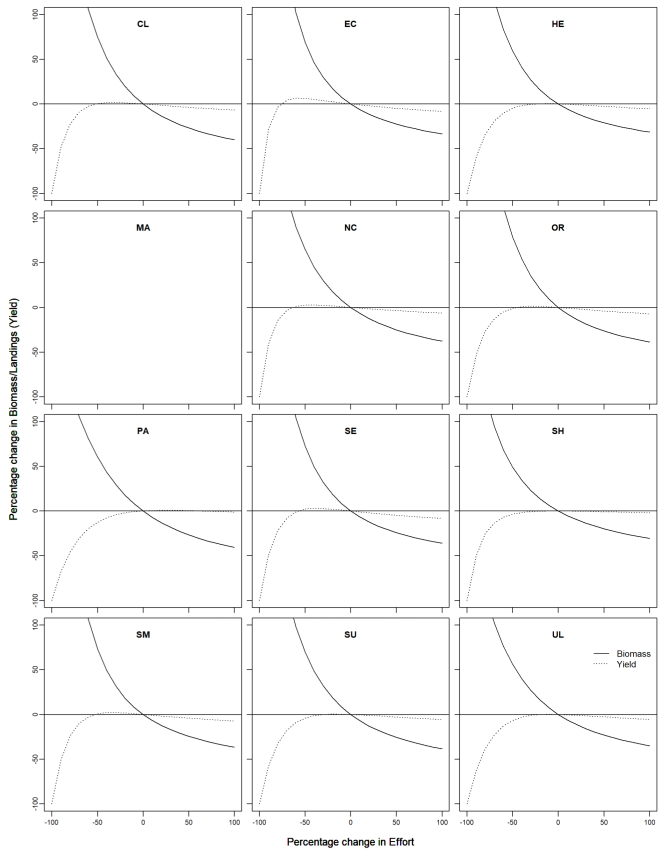
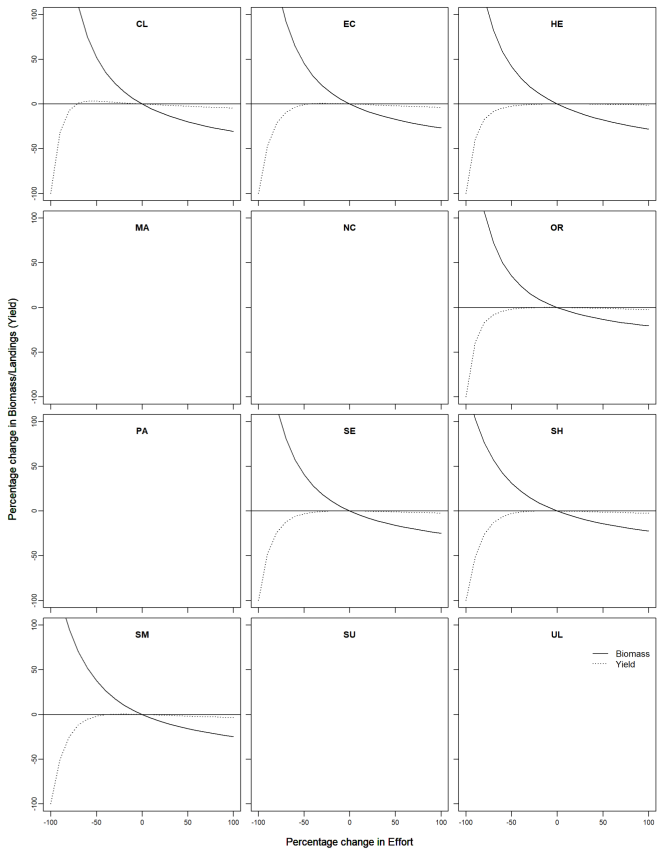
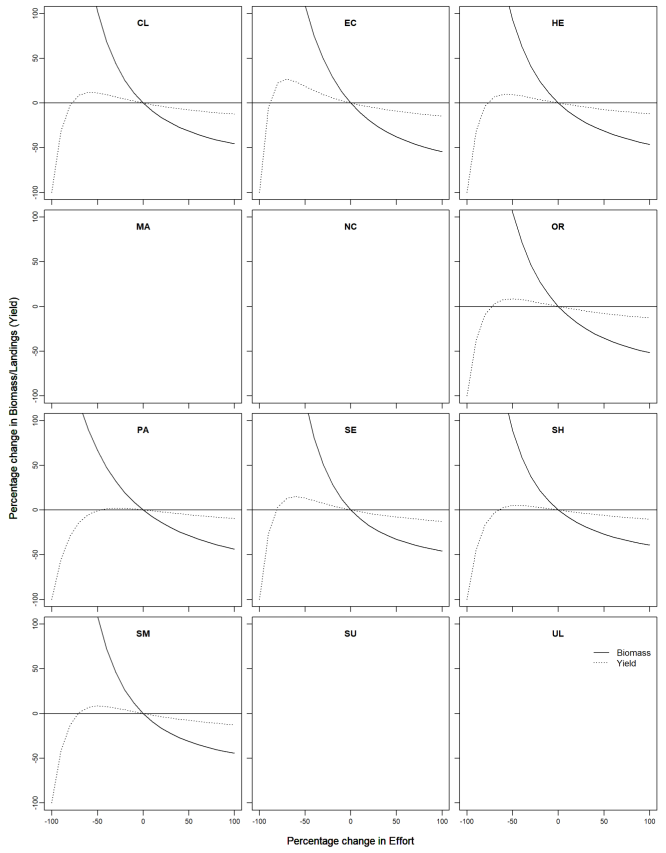
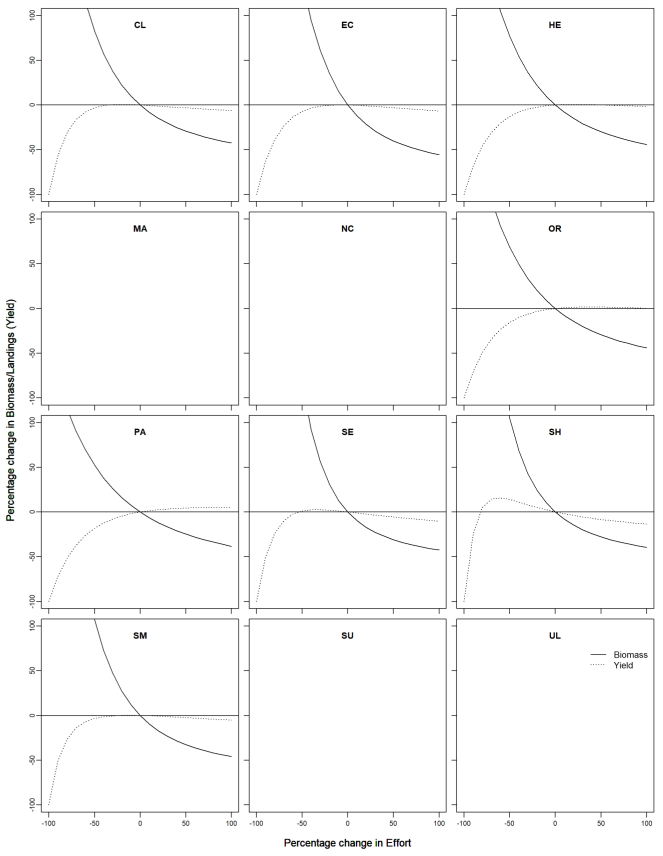
Results of Scottish regional brown crab (Cancer pagurus), velvet crab (Necora puber) and lobster (Homarus gammarus) stock assessments carried out by Marine Scotland Science (MSS) for the period 2016 to 2019.
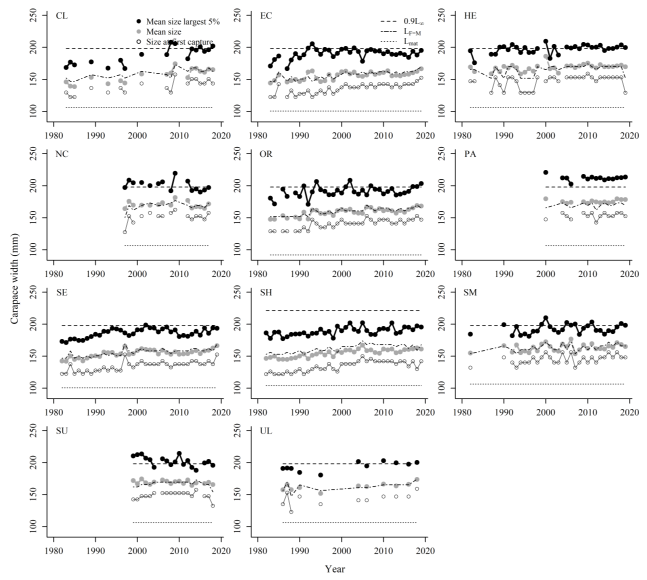
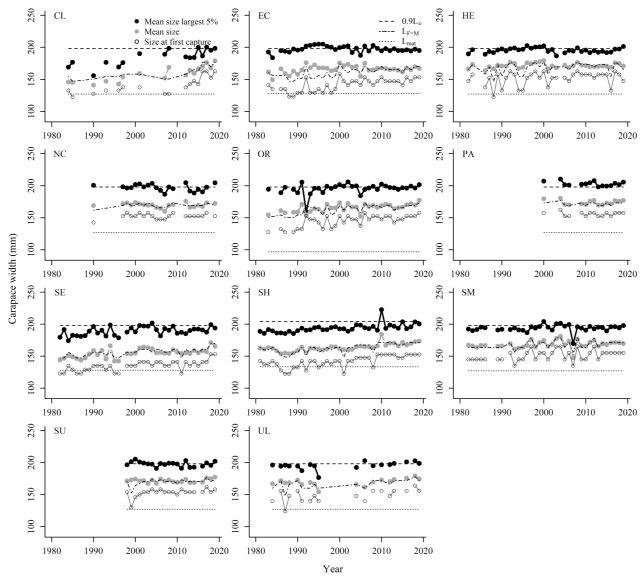
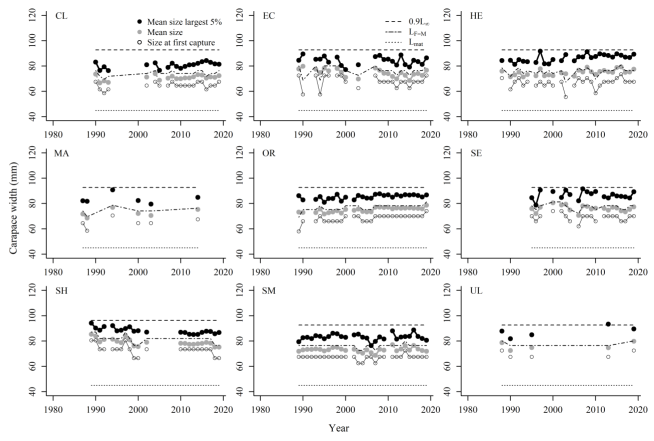
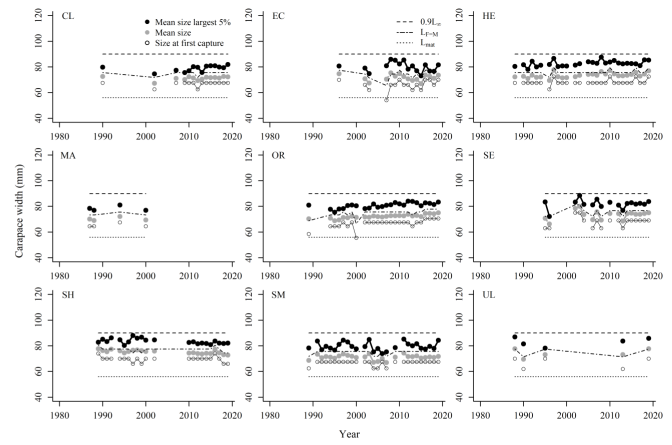
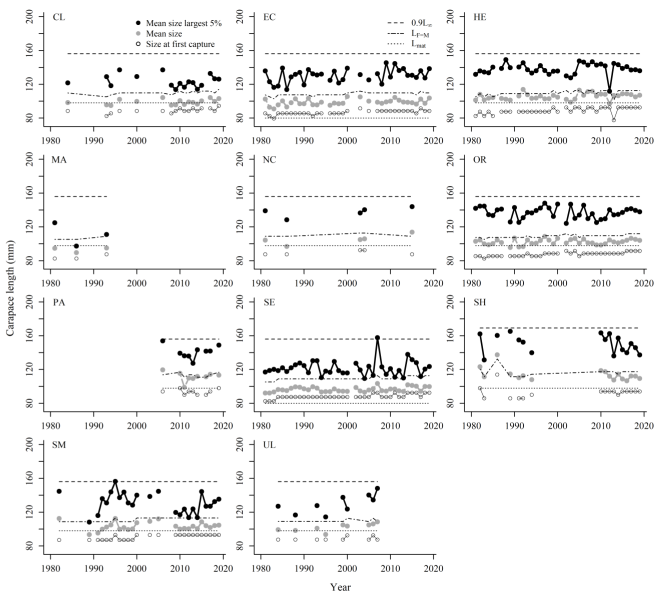
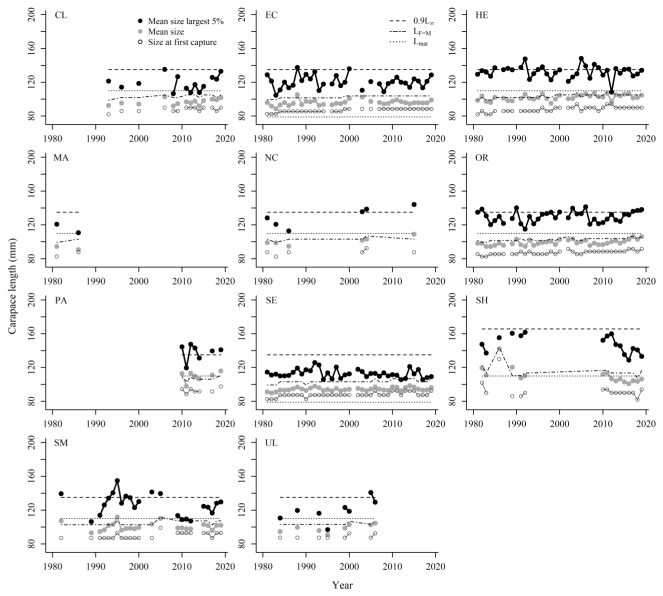
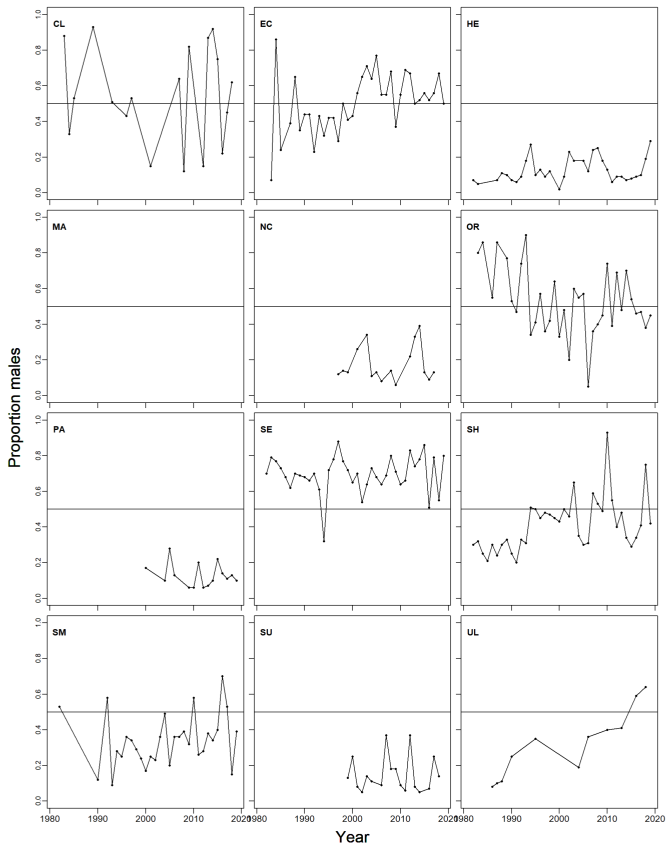
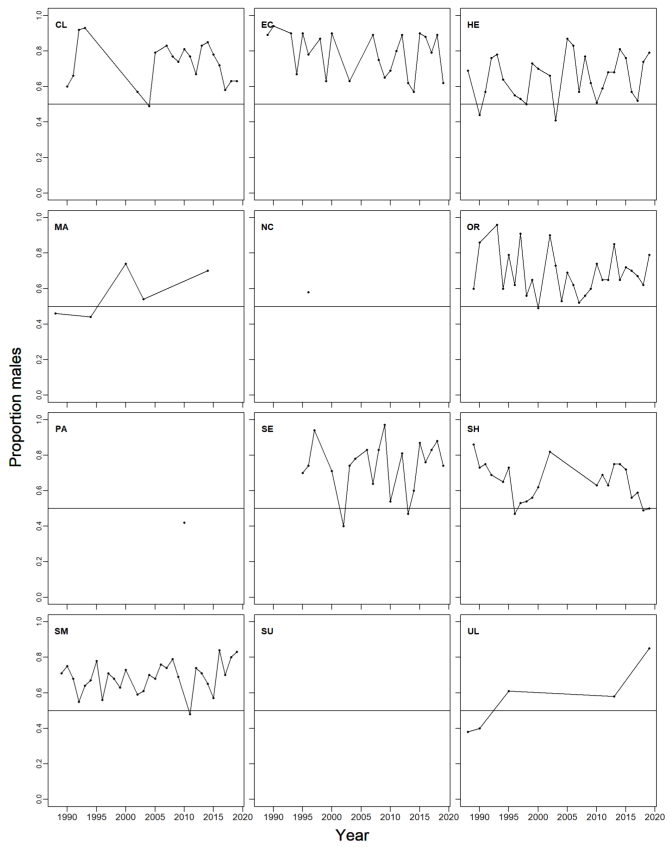
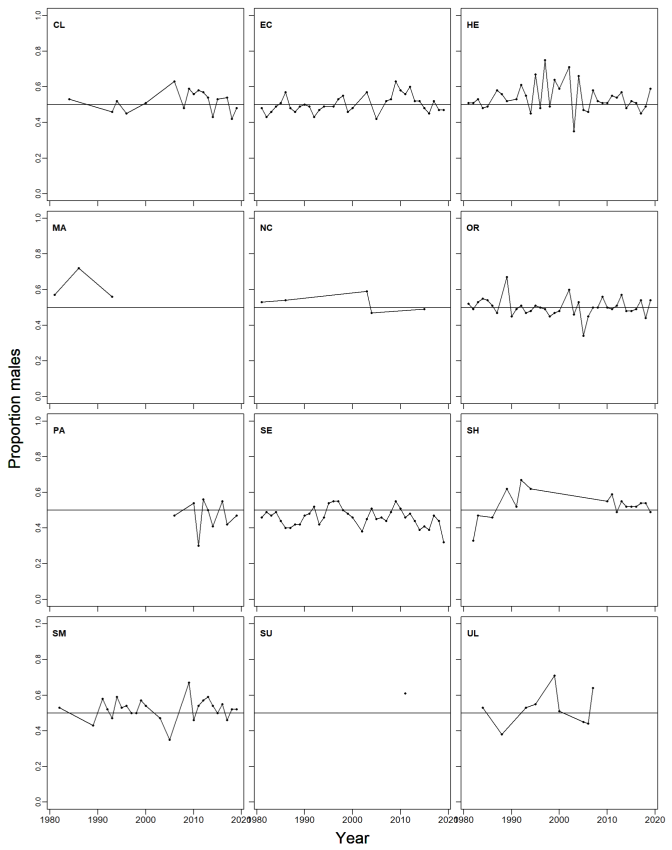
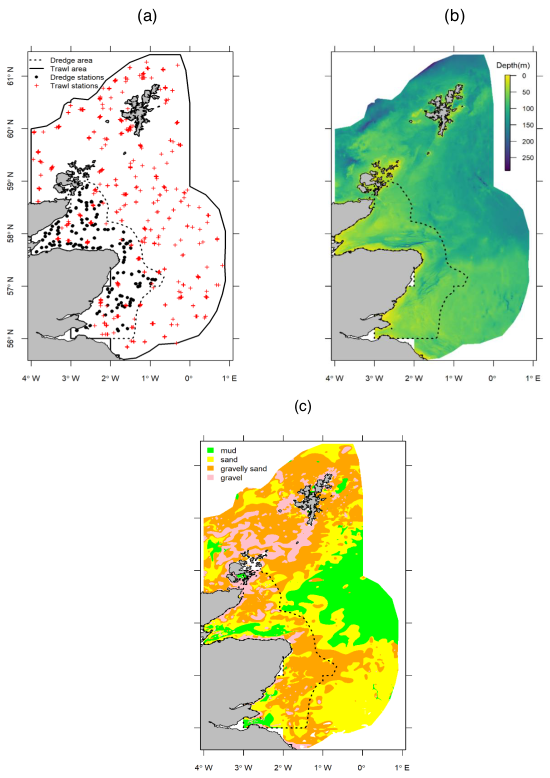
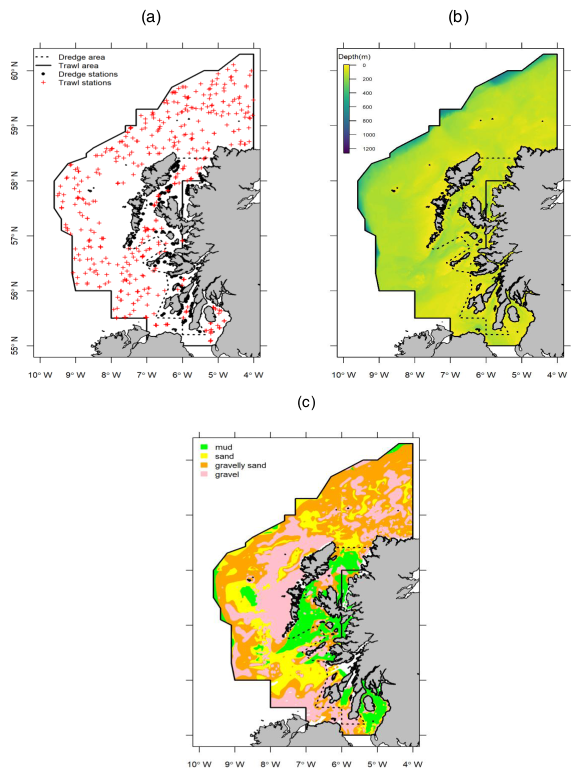
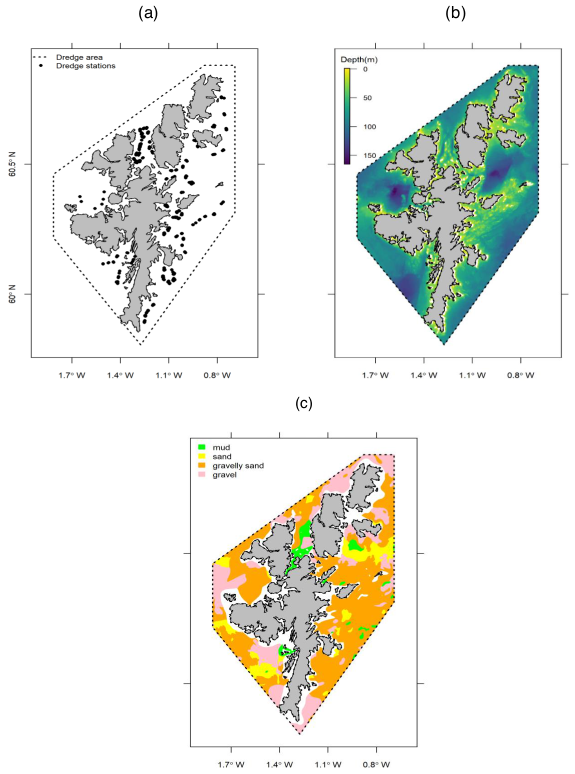
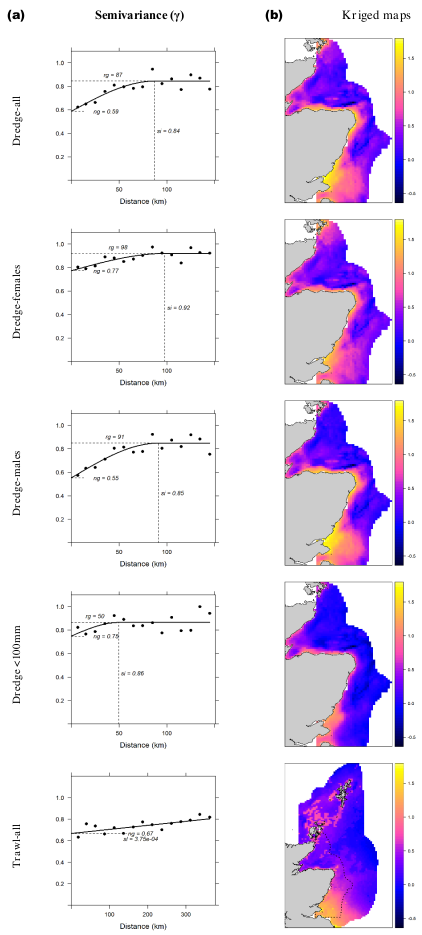
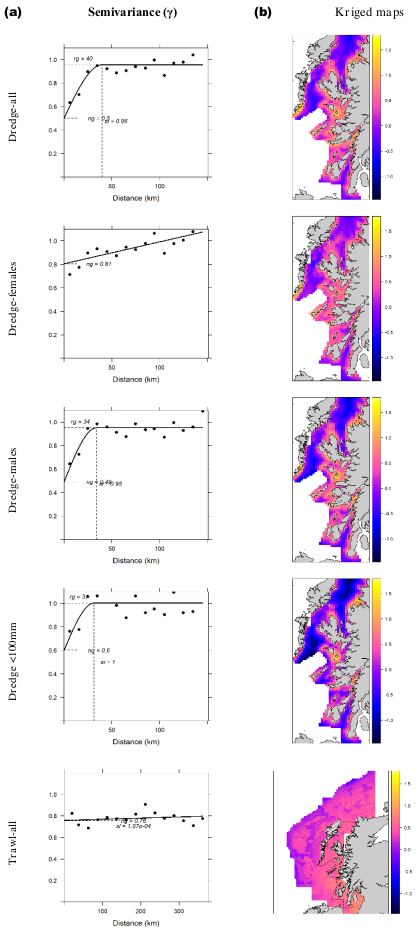
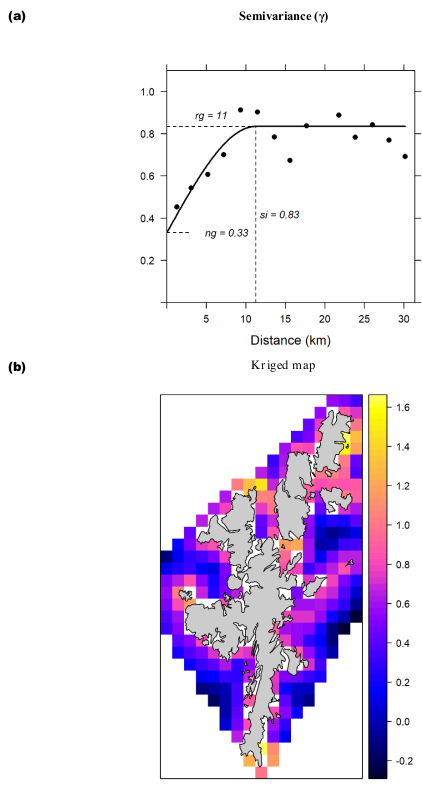
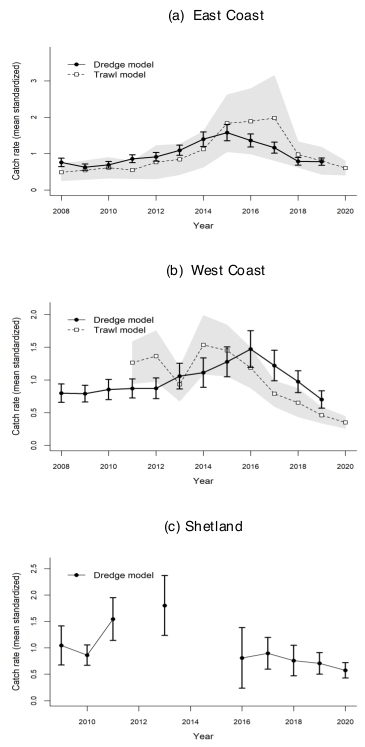
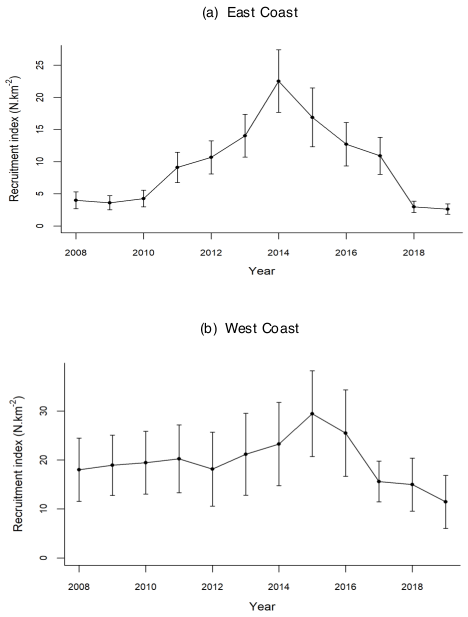
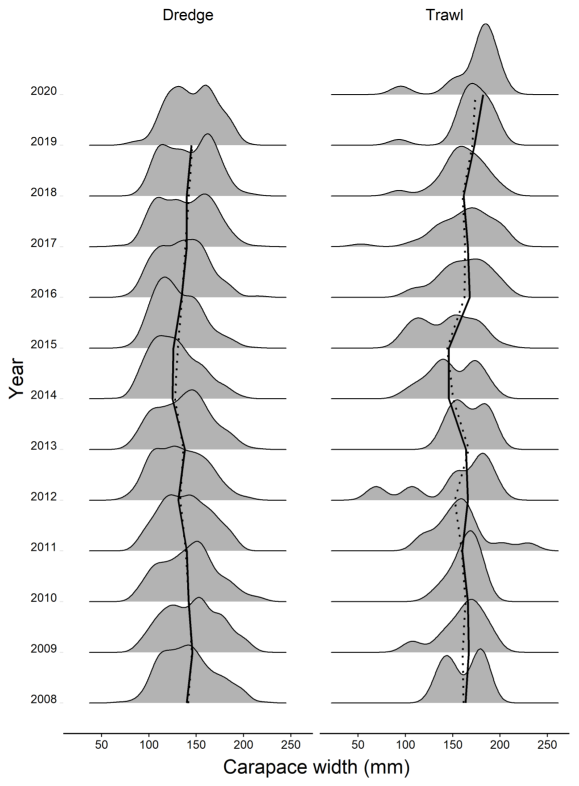
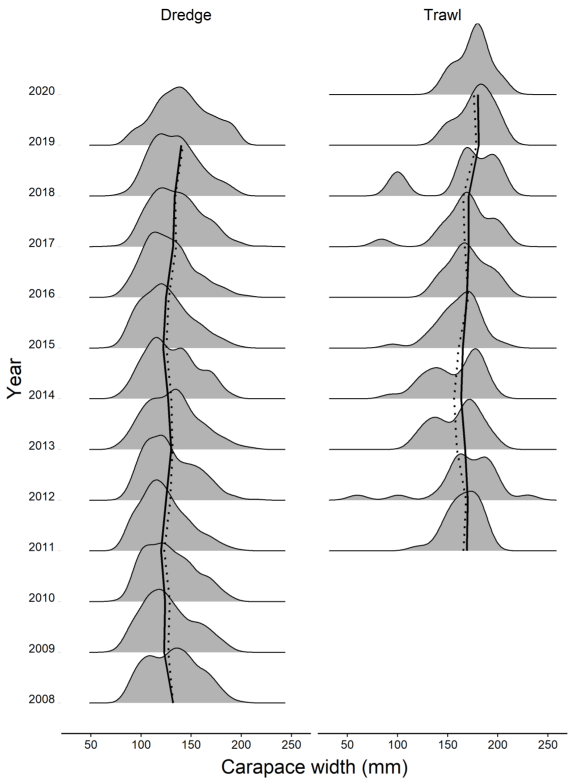
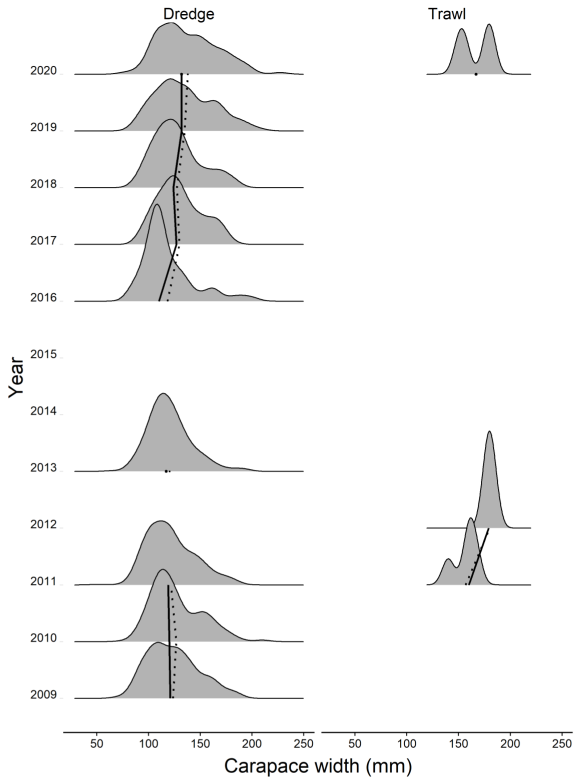

7. Figures

Figure 1 : Crab and lobster fishery assessment areas in Scotland. See Annex D for abbreviations.
shows a map with the crab and lobster fishery assessment areas in Scotland distributed around Scottish waters.
Figure 2 : Scottish crab and lobster fishery statistics. a) Landings (tonnes) into Scotland, b) landings value (£M), and, c) price per kilo (£/kg) for brown crab, velvet crab and lobster, 1974 -2020.
displays the Scottish crab and lobster fishery statistics including landings into Scotland (top), landings total value in million pounds (middle) and price per kilo in pounds (bottom) for brown crab, velvet crab and lobster, 1974 -2020. Landings, total value and price show a general increase (although with some fluctuations) over the last 40 years.
Figure 3 : Brown crab landings (tonnes) into Scotland by assessment area, 1974‑2020. ‘Outside’ relates to brown crab landed outside MSS crab and lobster assessment areas; see Figure 1 for area locations and Annex D for abbreviations.
shows total landings of brown crab between 1974 and 2020 in each assessment area. Different trends are observed in each area but there is a general decrease in brown crab landings in recent years for those areas with larger landings.
Figure 4 : Velvet crab landings (tonnes) into Scotland by assessment area, 1984‑2020. ‘Outside’ relates to velvet crab landed outside MSS crab and lobster assessment areas; see Figure 1 for area locations and Annex D for abbreviations.
shows total landings of velvet crab between 1984 and 2020 in each assessment area. Landings appear relatively stable in most assessment areas.
Figure 5 : Lobster landings (tonnes) into Scotland by assessment area, 1974-2020. ‘Outside’ relates to lobster landed outside MSS crab and lobster assessment areas; see Figure 1 for area locations and Annex D for abbreviations.
shows total landings of lobster between 1974 and 2020 in each assessment area. Landings in the EC and SE areas increased markedly in the early 2000’s and these two areas account for a large percentage of the total landings into Scotland.
Figure 6 : Brown crab landings (tonnes) by statistical rectangle between 2016 and 2020. Black circles represent landings into Scotland. Data are from iFISH database. Green circles represent landings into Ireland – data provided by the Irish Marine Institute.
shows Brown crab landings by statistical rectangle between 2016 and 2020 landed by vessels from Scotland and Ireland. Scottish landings are distributed around Scotland mainland and islands while Irish landings are concentrated to the north of Ireland and Malin Shelf to the west of South Minch.
Figure 7 : Velvet crab landings (tonnes) by statistical rectangle between 2016 and 2020. Black circles represent landings into Scotland. Data are from the iFISH database.
shows Velvet crab landings by statistical rectangle between 2016 and 2020 Landings are distributed around the inshore waters of Scotland mainland and Islands.
Figure 8 : Lobster landings (tonnes) by statistical rectangle between 2016 and 2020. Black circles represent landings into Scotland. Data are from the iFISH database.
shows European lobster landings by statistical rectangle between 2016 and 2020 Landings are distributed around the inshore waters of Scotland mainland and Islands and a large proportion of landings has been fished in the East coast and South East areas.
Figure 9 : Brown crab males mean size in landings (grey circles), mean size of the largest 5% of individuals (black circles) and size at first capture (open circles) by assessment area, 1981-2019. Reference points 0.9L∞ (dashed line), LF=M (dot-dashed line) and Lmat (dotted line), respectively. A minimum of 50 individuals was used each year to calculate mean sizes.
shows brown crab male trends in the mean size in landings, mean size of the largest 5% of individuals and size at first capture by assessment area in the period 1981-2019. Each of the mentioned variables are compared to the respective reference points. A minimum of 50 individuals was used each year to calculate mean sizes.
Figure 10 : Brown crab females mean size in landings (grey circles), mean size of the largest 5% of individuals (black circles) and size at first capture (open circles) by assessment area, 1981-2019. Reference points 0.9 L (dashed line), L F=M (dot-dashed line) and Lmat (dotted line), respectively. A minimum of 50 individuals was used each year to calculate mean sizes.
shows brown crab female trends in the mean size in landings, mean size of the largest 5% of individuals and size at first capture by assessment area in the period 1981-2019. Each of the mentioned variables are compared to the respective reference points. A minimum of 50 individuals was used each year to calculate mean sizes.
Figure 11 : Velvet crab males mean size in landings (grey circles), mean size of the largest 5% of individuals (black circles) and size at first capture (open circles) by assessment area, 1987-2019. Reference points 0.9 L (dashed line), L F=M (dot-dashed line) and Lmat (dotted line), respectively. A minimum of 50 individuals was used each year to calculate mean sizes.
shows velvet crab male trends in the mean size in landings, mean size of the largest 5% of individuals and size at first capture by assessment area in the period 1981-2019. Each of the mentioned variables are compared to the respective reference points. A minimum of 50 individuals was used each year to calculate mean sizes.
Figure 12 : Velvet crab females mean size in landings (grey circles), mean size of the largest 5% of individuals (black circles) and size at first capture (open circles) by assessment area, 1987-2019. Reference points 0.9 L (dashed line), L F=M (dot-dashed line) and Lmat (dotted line), respectively. A minimum of 50 individuals was used each year to calculate mean sizes.
shows velvet crab female trends in the mean size in landings, mean size of the largest 5% of individuals and size at first capture by assessment area in the period 1981-2019. Each of the mentioned variables are compared to the respective reference points. A minimum of 50 individuals was used each year to calculate mean sizes.
Figure 13 : Lobster males mean size in landings (grey circles), mean size of the largest 5% of individuals (black circles) and size at first capture (open circles) by assessment area, 1981-2019. Reference points 0.9 L (dashed line), L F=M (dot-dashed line) and Lmat (dotted line), respectively. A minimum of 50 individuals was used each year to calculate mean sizes.
shows lobster male trends in the mean size in landings, mean size of the largest 5% of individuals and size at first capture by assessment area in the period 1981-2019. Each of the mentioned variables are compared to the respective reference points. A minimum of 50 individuals was used each year to calculate mean sizes.
Figure 14 : Lobster females mean size in landings (grey circles), mean size of the largest 5% of individuals (black circles) and size at first capture (open circles) by assessment area, 1981-2019. Reference points 0.9 L (dashed line), L F=M (dot-dashed line) and Lmat (dotted line), respectively. A minimum of 50 individuals was used each year to calculate mean sizes.
shows lobster female trends in the mean size in landings, mean size of the largest 5% of individuals and size at first capture by assessment area in the period 1981-2019. Each of the mentioned variables are compared to the respective reference points. A minimum of 50 individuals was used each year to calculate mean sizes.
Figure 15 : Brown crab sex ratio (percentage of males) in landings by assessment area, 1981-2019.
shows brown crab sex ratio expressed as percentage of males in landings by assessment area in the period 1981-2019. There are large variations in sex ratio with some offshore areas dominated by females in the landings.
Figure 16 : Velvet crab sex ratio (percentage of males) in landings by assessment area, 1987-2019.
shows velvet crab sex ratio expressed as percentage of males in landings by assessment area in the period 1987-2019. There are some relatively large variations in sex ratio with most areas dominated by males in the landings.
Figure 17 : Lobster sex ratio (percentage of males) in landings, 1981-2019.
shows lobster sex ratio expressed as percentage of males in landings by assessment area in the period 1981-2019. The sex ratio in landings for lobsters is close to 50% in all areas and shows no obvious trends.
Figure 18 : (a) Study region on the east coast of Scotland with the dredge and trawl survey areas and stations sampled (2008–2020. (b) Bathymetry map of the study area (depth in meters). (c) Distribution of marine sediments in the study area from the British Geological Survey ( Cooper et al., 2013). Dredge stations around the Shetland Islands are shown in Figure 20.
contains in the top left, a map of the study region in the east coast of Scotland with the dredge and trawl survey areas and stations sampled; in the top right there is a bathymetry map of the study area and in the bottom; in the bottom the figure shows the distribution of marine sediments in the study area from the British Geological Survey.
Figure 19 : (a) Study region on the west coast of Scotland with the dredge and trawl survey areas and stations sampled (2008–2020). (b) Bathymetry map of the study area (depth in meters). (c) Distribution of marine sediments in the study area from the British Geological Survey ( Cooper et al., 2013).
contains in the top left, a map of the study region in the west coast of Scotland with the dredge and trawl survey areas and stations sampled; in the top right there is a bathymetry map of the study area and in the bottom; in the bottom the figure shows the distribution of marine sediments in the study area from the British Geological Survey.
Figure 20 : (a) Study region of Shetland with the dredge survey areas and stations sampled (2009–2020). (b) Bathymetry map of the study area (depth in metres). (c) Distribution of marine sediments in the study area from the British Geological Survey (Cooper et al., 2013).
contains in the top left, a map of the study region in the Shetland Islands with the dredge and trawl survey areas and stations sampled; in the top right there is a bathymetry map of the study area and in the bottom; in the bottom the figure shows the distribution of marine sediments in the study area from the British Geological Survey.
Figure 21 : East Coast (a) Variograms estimating semi-variance (γ) with spherical (parameters: range-rg, sill-si, nugget-ng) and linear (parameters: intercept/nugget-ng, slope-sl) models. (b) Kriged maps showing predicted catch rates (in the transformed log scale). The five analysis scenarios considered are displayed from top to bottom: (1) all crabs (dredge), (2) females (dredge), (3) males (dredge), (4) juveniles (dredge), and (5) all crabs (trawl).
shows in the left column, variograms for the east coast of Scotland, estimating semi-variance with spherical and linear models. In the right column, kriged maps are presented showing predicted catch rates. There are five analysis scenarios considered displayed in this figure from top to bottom: all crabs (dredge), females (dredge), males (dredge), juveniles (dredge), and all crabs (trawl).
Figure 22 : West Coast (a) Variograms estimating semi-variance (γ) with spherical (parameters: range-rg, sill-si, nugget-ng) and linear (parameters: intercept/nugget-ng, slope-sl) models. (b) Kriged maps showing predicted catch rates (in the transformed log scale). The five analysis scenarios considered are displayed from top to bottom: (1) all crabs (dredge), (2) females (dredge), (3) males (dredge), (4) juveniles (dredge), and (5) all crabs (trawl).
shows in the left column, variograms for the east coast of Scotland, estimating semi-variance with spherical and linear models. In the right column, kriged maps are presented showing predicted catch rates. There are five analysis scenarios considered displayed in this figure from top to bottom: all crabs (dredge), females (dredge), males (dredge), juveniles (dredge), and all crabs (trawl).
Figure 23 : Shetland (a) Variogram estimating semi-variance (γ) with spherical (parameters: range-rg, sill-si, nugget-ng) and linear (parameters: intercept/nugget-ng, slope-sl) model. (b) Kriged map showing predicted catch rates (in the transformed log scale). The analysis scenario of all crabs (dredge) is displayed.
shows in the top, a variogram for the Shetland Islands, estimating semi-variance with spherical and linear models. In the bottom, a kriged map is presented showing predicted catch rates. There only scenario considered for Shetland and displayed in this figure is for all crabs caught on the dredge survey.
Figure 24 : Brown crab abundance indices by year for (a) East Coast, (b) West Coast and (c) Shetland, estimated from GAMs applied to dredge (solid line) and trawl (dashed line) surveys (2008–2020) with 95% confidence intervals. The abundance indices for both the dredge and trawl models are mean standardized relative estimates. Predictions are averaged for grid cells within the dredge survey areas.
shows the brown crab abundance indices by year for the east coast (top), west coast (middle) and Shetland (bottom), estimated from GAMs applied to dredge and trawl surveys in the period 2008-2020. A declining trend in crab abundance is noted for both surveys in the east and west coast of Scotland in recent years.
Figure 25 : Brown crab recruitment index by year with 95% confidence intervals for (a) East Coast and (b) West Coast. The recruitment index is a relative estimate calculated as numbers per square kilometre (N.km -2) of juvenile crabs <100mm CW. Recruitment estimates were derived from a hurdle model applied to dredge surveys (2008–2019). Predictions are averaged for all grid cells within the dredge survey area.
shows the brown crab recruitment index by year in the east coast (top) and west Coast (bottom). A declining trend in recruitment is noted in the east and west coast of Scotland in recent years.
Figure 26 : Length frequency distribution of East Coast brown crabs captured in the dredge and trawl surveys (2008–2020). The medians and means in each year are represented by the solid and dotted vertical lines, respectively.
displays the length frequency distribution of east coast brown crabs captured in the dredge (left) and trawl surveys (right) between 2008 and 2020. Calculated medians and means of the length distributions in each year are also displayed in the figure showing a relatively correlation.
Figure 27 : Length frequency distribution of West Coast brown crabs captured in the dredge and trawl surveys (2008–2020). The medians and means in each year are represented by the solid and dotted vertical lines, respectively.
displays the length frequency distribution of west coast brown crabs captured in the dredge (left) and trawl surveys (right) between 2008 and 2020. Calculated medians and means of the length distributions in each year are also displayed in the figure showing a high correlation.
Figure 28 : Length frequency distribution of Shetland brown crabs captured in the dredge and trawl surveys (2009–2020). The medians and means in each year are represented by the full and dotted vertical lines, respectively.
displays the length frequency distribution of Shetland brown crabs captured in the dredge (left) and trawl surveys (right) between 2008 and 2020. Calculated medians and means of the length distributions in each year are also displayed in the figure showing a high correlation.
Figure 29: Male brown crab fishing mortality (Fbar) time series for the last five assessments in relation to FMSY. For the Shetland area, F values (on a different scale in the right vertical axis) are shown as estimated using two sets of biological parameters (Shetland and rest of Scotland).
shows the male brown crab average fishing mortality (Fbar) time series for the last five assessments in relation to FMSY. Estimated F has decreased in relation to the last assessment in all areas.
Figure 30: Female brown crab fishing mortality (Fbar) time series for the last five assessments in relation to FMSY. For the Shetland area, F values (on a different scale in the right vertical axis) are shown as estimated using two sets of biological parameters (Shetland and rest of Scotland).
shows the female brown crab average fishing mortality (Fbar) time series for the last five assessments in relation to FMSY. Estimated F has decreased in relation to the last assessment in all areas except for the East Coast and Shetland.
Figure 31: Male velvet crab fishing mortality (Fbar) time series for the last five assessments in relation to FMSY. For the Shetland area, F values (on a different scale in the right vertical axis) are shown as estimated using two sets of biological parameters (Shetland and rest of Scotland).
shows the male velvet crab average fishing mortality (Fbar) time series for the last five assessments in relation to FMSY. The estimated F has been found to be relatively stable over the time series in the Hebrides, Orkney and South east areas and more variable in the other areas.
Figure 32 : Female velvet crab fishing mortality ( Fbar) time series for the last five assessments in relation to FMSY. For the Shetland area, F values (on a different scale in the right vertical axis) are shown as estimated using two sets of biological parameters (Shetland and rest of Scotland).
shows the female velvet crab average fishing mortality (Fbar) time series for the last five assessments in relation to FMSY. The estimated F has been found to be relatively stable over the time series in the Hebrides, Orkney and South Minch areas and more variable in the other areas.
Figure 33 : Male lobster fishing mortality ( Fbar) time series for the last five assessments in relation to FMSY.
shows the male lobster average fishing mortality (Fbar) time series for the last five assessments in relation to FMSY. In the East Coast, South East, Hebrides, South Minch and Shetland, estimated F increased in the latest assessment.
Figure 34 : Female lobster fishing mortality ( Fbar) time series for the last five assessments in relation to FMSY.
shows the female lobster average fishing mortality (Fbar) time series for the last five assessments in relation to FMSY. Estimates of F for female stocks were generally lower than males, showing a slight decrease in relation to the previous assessments in the Hebrides and Orkney.
Figure 35 : Male brown crab biomass and yield-per-recruit ( YPR) predictions given changes from current effort by assessment area, data from 2016-19.
shows the male brown crab biomass and yield-per-recruit (YPR) predictions given changes from current effort by assessment area for years 2016-2019. Biomass shows a decreasing trend with effort while the maximum yield is generally found in the  50% to +50% effort interval.
Figure 36 : Female brown crab biomass and yield-per-recruit ( YPR) predictions given changes from current effort by assessment area, data from 2016-19.
shows the female brown crab biomass and yield-per-recruit (YPR) predictions given changes from current effort by assessment area for years 2016-2019. Biomass shows a decreasing trend with effort while the maximum yield is generally found in the  50% to +50% effort interval.
Figure 37 : Male velvet crab biomass and yield-per-recruit ( YPR) predictions given changes from current effort by assessment area, data from 2016-19.
shows the male velvet crab biomass and yield-per-recruit (YPR) predictions given changes from current effort by assessment area for years 2016-2019. Biomass shows a decreasing trend with effort while the maximum yield is generally found in the  50% to +50% effort interval.
Figure 38 : Female velvet crab biomass and yield-per-recruit ( YPR) predictions given changes from current effort by assessment area, data from 2016-19.
shows the female velvet crab biomass and yield-per-recruit (YPR) predictions given changes from current effort by assessment area for years 2016-2019. Biomass shows a decreasing trend with effort while the maximum yield is generally found in the  50% to +50% effort interval.
Figure 39 : Male lobster biomass and yield-per-recruit ( YPR) predictions given changes from current effort by assessment area, data from 2016-19.
shows the male lobster biomass and yield-per-recruit (YPR) predictions given changes from current effort by assessment area for years 2016-2019. Biomass shows a decreasing trend with effort. For the majority of assessed stocks, an effort reduction of more than 50% would be required to achieve the maximum yield.
Figure 40 : Female lobster biomass and yield-per-recruit ( YPR) predictions given changes from current effort by assessment area, data from 2016-19.
shows the female lobster biomass and yield-per-recruit (YPR) predictions given changes from current effort by assessment area for years 2016-2019. Biomass shows a decreasing trend with effort while the maximum yield is generally found in the  50% to +50% effort interval.

Contact

Email: carlos.mesquita@gov.scot

Back to top