Crab and lobster fisheries - stock assessments: results 2016 to 2019
Results of Scottish regional brown crab (Cancer pagurus), velvet crab (Necora puber) and lobster (Homarus gammarus) stock assessments carried out by Marine Scotland Science (MSS) for the period 2016 to 2019.
8. Annexes
8.1. Annex A: Sampling Data – Decisions on which Species/Areas Stock Assessments Were Run
| Decision Table for Brown Crab | ||||||||||||
|---|---|---|---|---|---|---|---|---|---|---|---|---|
| Brown crab | Clyde | East Coast | Hebrides | Mallaig | North Coast | Orkney | Papa Bank | Shetland | South East | South Minch | Sule | Ullapool |
| Assessed in (2013-2015)? | √ | √ | √ | √ | √ | √ | √ | √ | √ | √ | ||
| N individuals/landings sampled | ok | good | good | poor | good | good | good | good | good | good | good | ok |
| N years available for average LF | good | good | good | poor | ok 3 | good | good | good | good | good | good | ok 3 |
| Sampling seasonality (quarters) | good | good | good | poor | good | good | good | good | good | good | good | good |
| LFD shape | ok | good | good | poor | good | good | good | good | good | ok | good | ok |
| Assessment 2016-2019 | √ | √ | √ | √ | √ | √ | √ | √ | √ | √ | √ | |
| Decision Table for Velvet Crab | ||||||||||||
|---|---|---|---|---|---|---|---|---|---|---|---|---|
| Velvet crab | Clyde | East Coast | Hebrides | Mallaig | North Coast | Orkney | Papa Bank | Shetland | South East | South Minch | Sule | Ullapool |
| Assessed in (2013-2015)? | √ | √ | √ | √ | √ | √ | √ | |||||
| N individuals/landings sampled | good | good | good | poor | poor | good | poor | good | good | good | poor | poor |
| N years available for average LF | good | good | good | poor | poor | good | poor | good | good | good | poor | poor |
| Sampling seasonality (quarters) | good | good | good | poor | poor | good | poor | good | good | good | poor | ok 3/4 |
| LFD shape | good | ok | good | poor | poor | good | poor | good | good | good | poor | ok |
| Assessment 2016-2019 | √ | √ | √ | √ | √ | √ | √ | |||||
| Decision Table for Lobster | ||||||||||||
|---|---|---|---|---|---|---|---|---|---|---|---|---|
| Lobster | Clyde | East Coast | Hebrides | Mallaig | North Coast | Orkney | Papa Bank | Shetland | South East | South Minch | Sule | Ullapool |
| Assessed in (2013-2015)? | √ | √ | √ | √ | √ | √ | √ | √ | ||||
| N individuals/landings sampled | ok | good | good | poor | poor | good | ok | good | good | good | poor | poor |
| N years available for average LF | good | good | good | poor | ok 2 | good | good | good | good | good | poor | poor |
| Sampling seasonality (quarters) | good | good | good | poor | ok 1/2 | good | good | good | good | good | poor | ok 3/4 |
| LFD shape | good | good | good | poor | poor | good | ok | good | good | good | poor | poor |
| Assessment 2016-2019 | √ | √ | √ | √ | √ | √ | √ | √ | ||||
Table A 4
Legend for Decision Tables
N individuals/landings sampled
POOR: No sampling or very few animals sampled (average < 100 per year)
OK: Few animals sampled (average < 500 per year)
GOOD: Several animals sampled (average > 500 per year)
N years available for average LFD
POOR: < 2 years
OK: 2/3 years
GOOD: 4 years
Sampling seasonality
POOR: Less than two quarters sampled over the 4 year period
OK: Two or three quarters sampled over the 4 year period
GOOD: All quarters sampled over the 4 year period
LF shape
POOR: No data or very few animals sampled
OK: LF with some spikes
GOOD: Approximately normal with no spikes
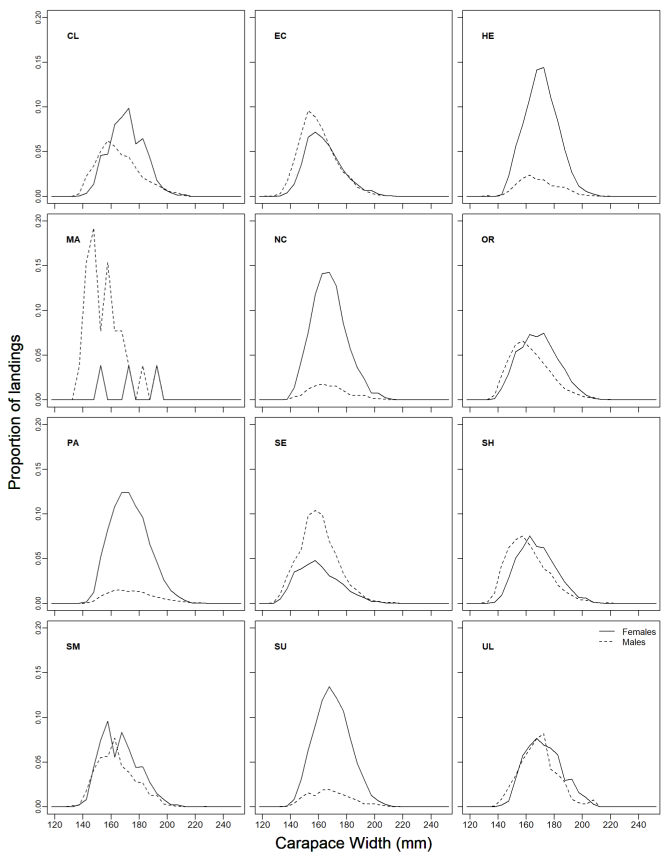
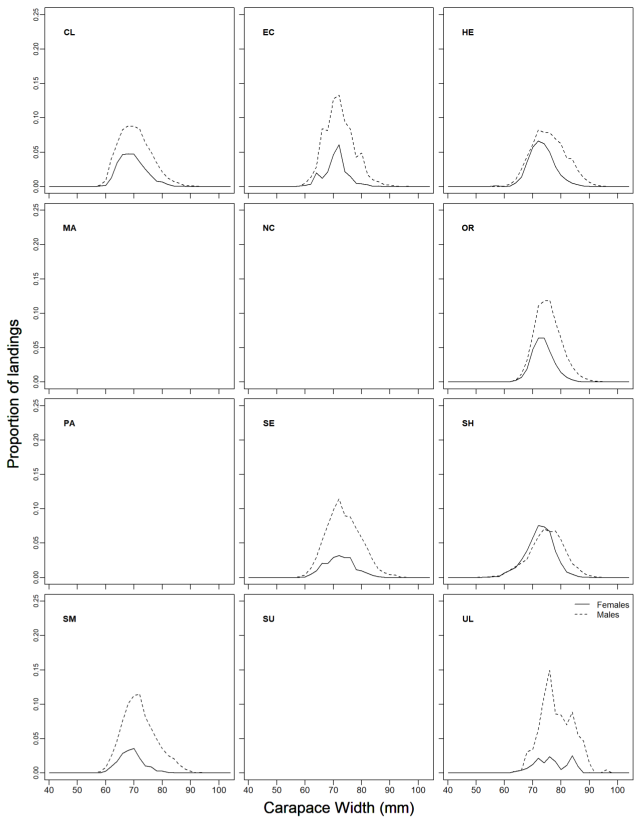
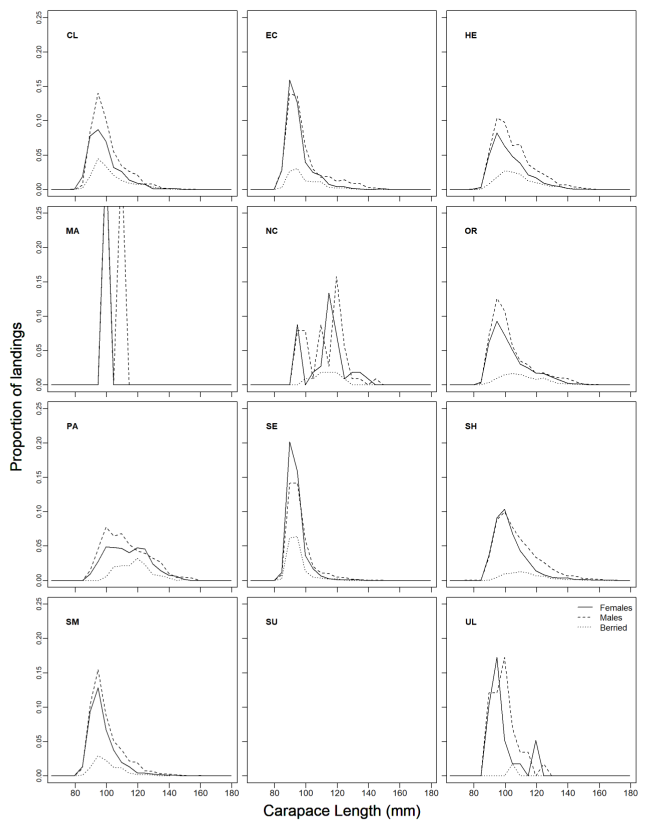
8.2. Annex B: Length Frequency Distributions
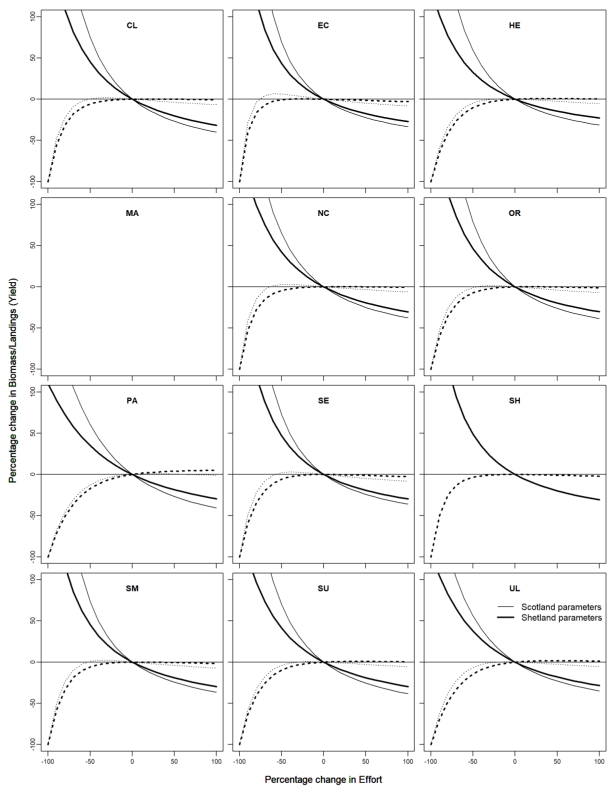
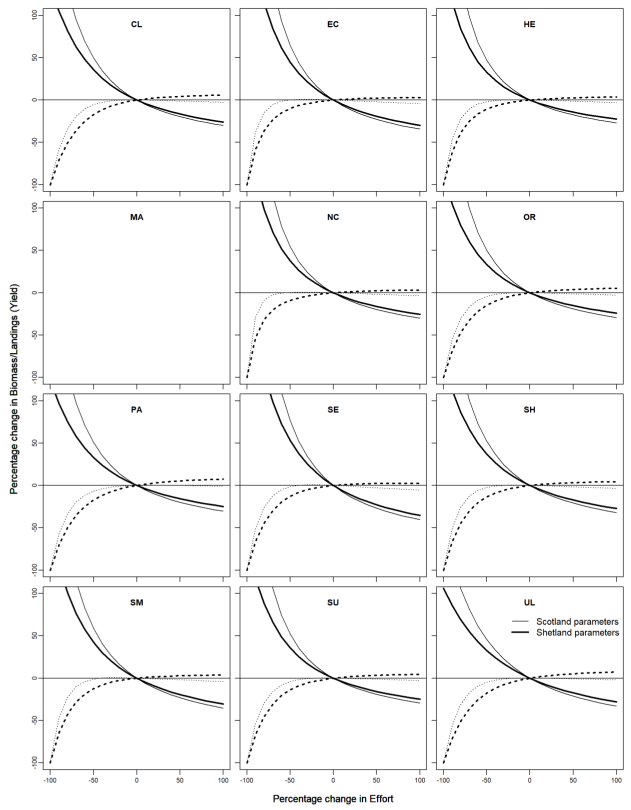
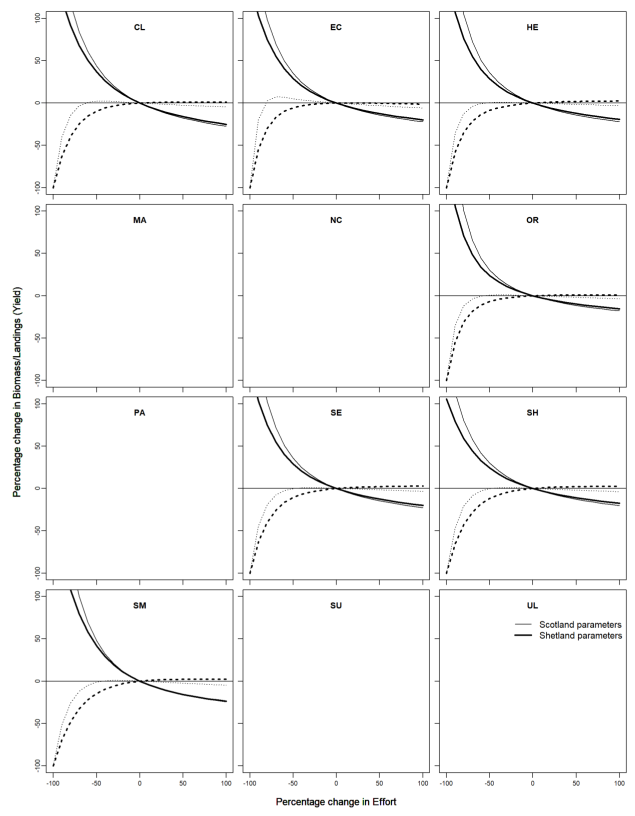
8.3. Annex C: Brown crab and Velvet Crab per Recruit Analysis using Different Biological Parameters

8.4. Annex D: List of Abbreviations
BGS British Geological Survey
BPR Biomass-per-recruit
Cefas Centre for Environment, Fisheries and Aquaculture Science
CL Carapace length
CPUE Catch per unit effort
CW Carapace width
ELEFAN Electronic length frequency analysis
EU European Union
F Fishing mortality
Fbar Average fishing mortality
FFM Future fisheries management strategy
FMAX Fishing mortality rate that maximizes YPR
FMD Fisheries Management Database
FMSY Fishing mortality consistent with achieving MSY
GAM Generalized additive model
HCR Harvest Control Rule
ICES International Council for the Exploration of the Sea
K Grow rate parameter
KW Kilowatt
L̅ Mean length
L∞ Asymptotic size parameter
LBI Length-based indicator
Lc Size at first capture
LCA Length Cohort Analysis
LF=M Expected length in the landings when fishing mortality is equal to natural mortality
LFD Length frequency distribution
Lmat Maturation size
Lmax5% Mean size of the largest 5% of individuals in the landings
LPUE Landings per unit effort
m Metre
M Natural mortality
MLS Minimum Landing Size
mm Millimetre
MoU Memorandum of Understanding
MSE Management Strategy Evaluation
MSS Marine Scotland Science
MSY Maximum Sustainable Yield
NAFC North Atlantic Fisheries College
OHIFP Outer Hebrides Inshore Fisheries Pilot
OSF Orkney Sustainable Fisheries
REM Remote electronic monitoring
RIFG Scottish Regional Inshore Fisheries Group
SPiCT Surplus production model in continuous time
TAC Total Allowable Catch
UHI University of the Highlands and Islands
VMS Vessel Monitoring System
WGCRAB Working Group on the Biology and Life History of Crabs
YPR Yield-per-recruit
Table D 1
Crab and lobster fishery assessment areas and abbreviations
Clyde - CL
East Coast - EC
Hebrides - HE
Mallaig - MA
North Coast - NC
Orkney - OR
Papa Bank - PA
South East - SE
Shetland - SH
South Minch - SM
Sule - SU
Ullapool - UL
Contact
Email: carlos.mesquita@gov.scot