Cost of Living Bill - Key Statistics
This note summarises some of the key statistics which underpinned the development of the Cost of Living (Tenant Protection) Scotland Bill, which was introduced to the Scottish Parliament on 3 October 2022
Cost of Living Bill – Key Statistics
Housing cost to income ratios are higher for rented households compared to other tenures
At a national level since 2006/07, people living in the private rented sector have spent the highest proportion of their income on housing (26%) of all the tenures. This is compared to 24% for the social rented sector, and for owner occupiers with a mortgage the average proportion of income has fallen from 12% in 2006/07 to 7% in 2019/20.
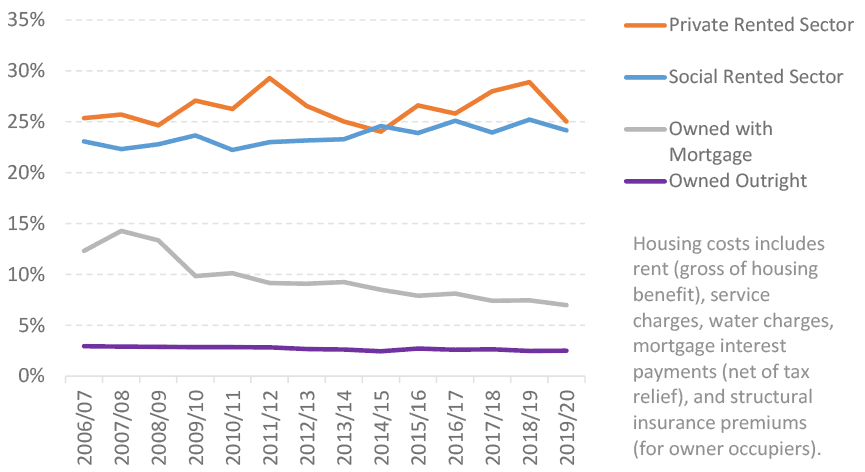
(Source: Family Resources Survey, as reported on in the New Deal for Tenants draft strategy consultation)
Note that a direct comparison of the costs of renting and buying is difficult to make because the capital element of a repayment mortgage creates an asset for the owner, which rent does not, and conversely renters will need to provide a smaller deposit than home owners or landlords. In addition, an owner or landlord will be liable for costs such as buildings insurance, repairs and maintenance and Land and Buildings Transaction Tax whereas a tenant will not pay for these separately and such costs are factored into the rent.
Housing cost to income ratios are higher for rented households with lower incomes
Over the latest period 2017-20 (which combines several years to achieve sufficient sample size), at a national level, private rented sector households in the lowest income quintile were paying an average of almost half (47%) of their household income on housing costs, with the equivalent figure for social rented households in the lowest income quintile being 38%. These ratios are much higher than for households in higher income quintiles, and also higher than the equivalent ratios for owner occupier households across each of the same income quintiles.
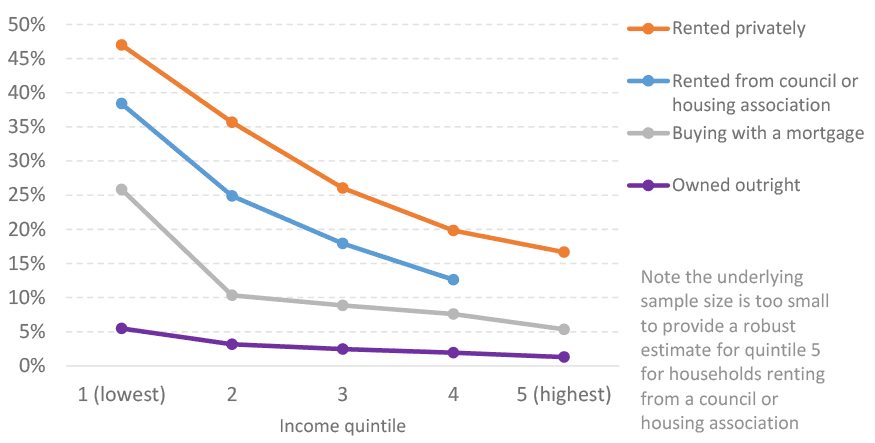
(Source: Family Resources Survey, as reported on in New Deal for Tenants draft strategy consultation)
Rented sector households are more likely to have lower incomes than households buying with a mortgage
In 2019, 60% social rented households and 38% of private rented households had a net income of £20,000 or less, which compares to 14% of households buying with a mortgage and 41% of households who own outright. (Figures exclude don’t know / refused responses).
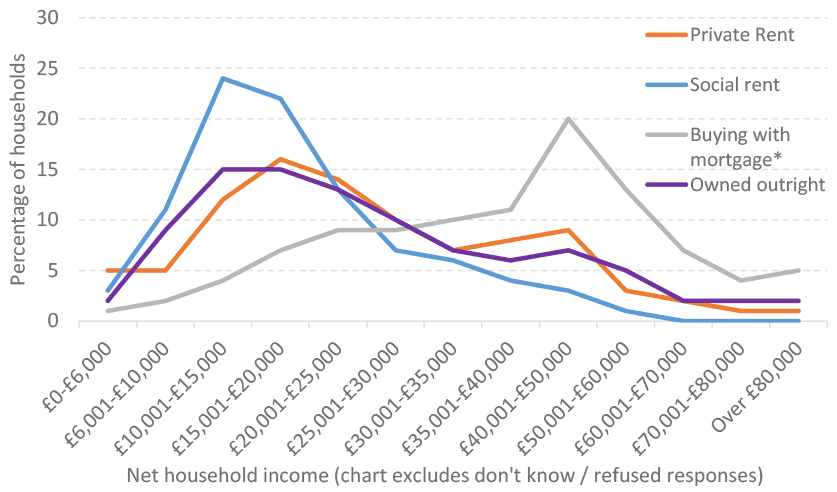
(Source: Scottish Household Survey Annual Report Tables 2019)
Rented households are also more likely to be financially vulnerable
Over the latest period 2018 to 2020, 63% of social rented households and 40% of private rented households in Scotland were estimated to be financially vulnerable (defined as households with savings which would cover less than one month of income at the poverty line). This compares to 24% of households buying with a mortgage and 9% of households owning outright.
Social rented households are also more likely to have unmanageable debt, with an estimated 9% of social renting households having unmanageable debt in 2018-2020. A household is considered to have unmanageable debt if they have liquidity problems or solvency problems, or both. Liquidity problems mean people struggle with their debt repayments and are falling behind with bills. Solvency problems mean people have a large amount of debt and feel heavily burdened by it.
(Source: Scottish Government Statistical publication on Wealth in Scotland 2006-2020)
Rented households are more likely to be in fuel poverty
The most recent National Statistics on fuel poverty are from the 2019 Scottish House Condition Survey (SHCS). The key findings from the 2019 SHCS estimated that 613,000 households (24.6% of all households) were in fuel poverty, of which 311,000 households (12.4% of all households were in extreme fuel poverty).
Fuel poverty rates vary by tenure. In 2019 the fuel poverty rates for households renting from housing associations (39%), local authorities (36%) and private landlords (36%) were similar. In comparison, 12% of households with a mortgage were assessed to be fuel poor.
The 2020 SHCS did not take place due to the restrictions in place in response to the Covid-19 pandemic. The 2021 SHCS did take place but using a different approach to previous years. It is intended that the key findings from the 2021 SHCS will be published in February 2023, including an estimate of fuel poverty rates and levels in 2021.
Given the interest in current fuel poverty rates and levels because of rising energy prices, we have undertaken analysis to estimate the number of households now in fuel poverty.
With the price cap for the average dual fuel customer paying by direct debit frozen at £2,500 under the Energy Price Guarantee which came into effect on 1 October 2022, we estimate that around 860,000 households (35% of all households) will now be in fuel poverty. Around 600,000 of these households (24% of all households) will be in extreme fuel poverty.
These estimates account for the support for households that was announced by the UK Government at the end of May and the Scottish Government’s £150 Council Tax rebate for households in bands A to D or in receipt of Council Tax Reduction. If any further support is announced then these estimates will have to be revised to account for that.
| Tenure | Households in fuel poverty (000s) | Fuel poverty rate | Households in extreme fuel poverty (000s) | Extreme fuel poverty rate | Median fuel poverty gap |
|---|---|---|---|---|---|
| Owned outright | 250 | 28% | 210 | 24% | £2,200 |
| Mortgaged | 130 | 19% | 80 | 12% | £1,700 |
| LA/ public | 190 | 52% | 110 | 31% | £1,300 |
| HA/co-op | 150 | 57% | 90 | 32% | £1,100 |
| PRS | 150 | 48% | 110 | 35% | £1,600 |
| All tenures (Scotland) | 860 | 35% | 600 | 24% | £1,500 |
Table 1 shows the estimated fuel poverty rates and levels and the median fuel poverty gap by tenure. The fuel and extreme fuel poverty rates for households have increased across all tenures but remain higher for those in the rented sectors compared to owner occupiers. For example, 57% of households renting from housing associations, 52% of households renting from local authorities and 48% of households renting from private landlords are now estimated to be in fuel poverty. In comparison, 19% of households with a mortgage and 28% of households who own the property outright are now estimated to be fuel poor.
Recent results from the Scottish Housing Regulator National Panel of Social Housing Tenants and Service Users indicate that cost of living pressures have been increasing:
A quarter of panel members who responded to the 2021/22 survey said that they are not currently managing well financially, with around 6 in 10 saying that their financial circumstances are worse than before the pandemic. Many linked these difficulties to increased cost of living and rent increases, and more than 7 in 10 were concerned about future affordability of their rent.
More than half of respondents reported experienced difficulty heating their home, with more than double the number from the previous year stating energy costs as the main factor contributing to these difficulties.
(Source: Scottish Housing Regulator National Panel of Tenants and Service Users 2021 to 2022)
Levels of poverty and child poverty are higher in the rented sectors:
The latest available figures across the period 2017 to 2020 show that the rented sectors have a higher proportion of people who are in relative poverty, with 39% of people in social rented households and 34% of people in private rented households being in poverty, compared to 7% of people in households buying with a mortgage and 14% of people in households who own outright.
When looking at children in relative poverty, 47% of children in social rented households and 40% of children in private rented households are in poverty, compared to 10% of children in households buying with a mortgage and 18% of children households who own outright.
(Source: Family Resources Survey, as reported on in Poverty and Income Inequality in Scotland Tables)
Latest available figures are indicating some rises in average private sector rents across recent months:
Figures from the ONS Private Rental Index show that the annual increase in private rents across all tenants in Scotland is estimated to have been rising significantly over recent months, with a 3.7% increase in July 2022, the highest since the series started in 2012.
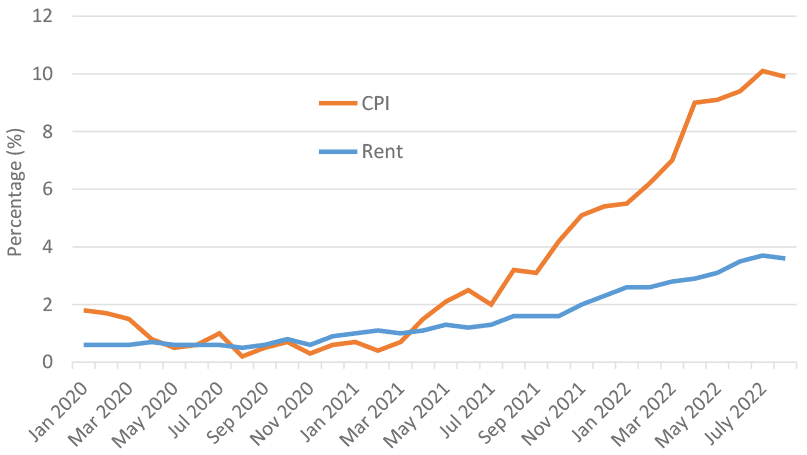
Note that the ONS figures are experimental statistics incorporating an assumption of average tenancy length to account for sitting tenants, and therefore will differ to separate recent industry based figures that cover advertised rents only. In addition, the ONS series reports on national level increases only, and beneath this increases in rents in some areas of the country are likely to vary.
Separate data from letting agents suggests that the demand-supply balance has tightened recently (although there is a caveat that letting agencies cover less than half of the PRS, and are likely to have varying coverage across the country): Citylets report time-to-let for properties down to 18 days in Q2 2022 from 40 in Q3 2020, and Citylets and Rightmove report that the number of new listings has fallen recently.
In addition, when looking at the latest quarter Apr-Jun 2022 compared with Apr-Jun 2021, Citylets have reported that advertised rents have increased by 15.1% in Edinburgh, 13.0% in Glasgow, and 4.4% in Aberdeen. Rightmove have reported that advertised rents in Scotland have increased by 12.5% over the same time period.
(Source: ONS Private Rental Index results to July 2022, Citylets Quarterly Reports, Rightmove Rental Price Tracker)
Average private rent levels have been higher in England than Scotland over recent years
Annual statistics on average private rent levels in England and Scotland show that average rents have been higher in England than Scotland across the available comparison period from 2011 onwards, with the latest annual statistics for the year to end September 2021 showing that the £841 average 2 bedroom monthly rent in England was 21% (£148) higher than the £693 average 2 bedroom monthly rent in Scotland.
This difference in absolute average levels of rents over recent years has also contributed to the median housing cost to income ratio for private rented households being higher in England compared to Scotland, with an ONS UK PRS Topic Report article published in 2018 showing an average ratio of PRS housing costs to income of 32% in England in the years 2014 to 2016 compared to 25% for Scotland.
(Source: Scottish Government Private Sector Rent Statistics 2010 to 2021, ONS Private rental market summary statistics in England: October 2020 to September 2021, ONS UK Topic Report on private rented sector: 2018)
Average social rent levels are also higher in England than Scotland, although the difference has narrowed over recent years given the annual decreases in average rents in England each year between 2015/16 and 2019/20, before average rents in England began to rise again in 2020/21
The average weekly local authority rent of £88.27 in England in the latest comparable year 2020/21 was 13% higher than the average local authority rent of £78.10 in Scotland, although this percentage difference has narrowed since 2014/15 when it was 31%.
The average weekly housing association rent of £96.60 in England in the latest comparable year 2020/21 was 8% higher than the average housing association rent of £89.85 in Scotland, although this percentage difference has narrowed since 2014/15 when it was 25%.
(Source: Scottish Housing Regulator Charter Data by Outcomes and Standards, DLUHC Tables 702 and 704 on rents)
Around two-thirds (66%) of social rented households are receiving some level of support for housing costs through Housing Benefit or Universal Credit, with the equivalent figure for private rented sector households being 29%
Households in receipt of Housing Benefit or Universal Credit that fully covers their rent and any associated increase will see no impact of a rent freeze, but for those where it is only partially covered it could help, along with those that do not receive any support.
(Source: DWP StatXplore Tables for May 2022, compared with latest available rented stock figures)
Around a third (36%) of private rented sector properties across the UK have an outstanding Buy-to-Let (BTL) mortgage (although private landlords might have other types of loans than BTL mortgages)
There is no Scotland-level breakdown, but it seems reasonable to assume that the proportion might be at a similar level.
(Source: UK Finance data on total outstanding BTL mortgages across UK, compared to PRS stock numbers taken from Housing statistics: Stock by tenure - gov.scot (www.gov.scot) and Dwelling stock by tenure, UK - Office for National Statistics (ons.gov.uk). Note that UK Finance figures on BTL mortgages include all loans for residential rental investment, whether to an individual or a business.).
Nearly three-quarters (72%) of outstanding BTL mortgages in the UK are on fixed interest rates
(Source: Mortgage lending statistics - June 2022 | FCA. Note that the this figure refers to non-regulated lending, which is defined as all other mortgage lending to an individual that is not regulated (a regulated loan is a loan to an individual secured on residential property which is for the use of the borrower or a close relative). Thus while non-regulated lending includes buy to let lending, it will have somewhat wider coverage).
Increasing Eviction Action
Recent information from the First-tier Tribunal (Housing and Property Chamber), who hear private rental eviction cases, has indicated that case numbers are continuing to rise, with a fourth increase in a row for applications (as of 21 August). The following charts show eviction numbers from a pre-pandemic status, through the range of emergency interventions during the pandemic, and then to the current levels, which show that eviction numbers have now almost doubled from early 2019 levels.
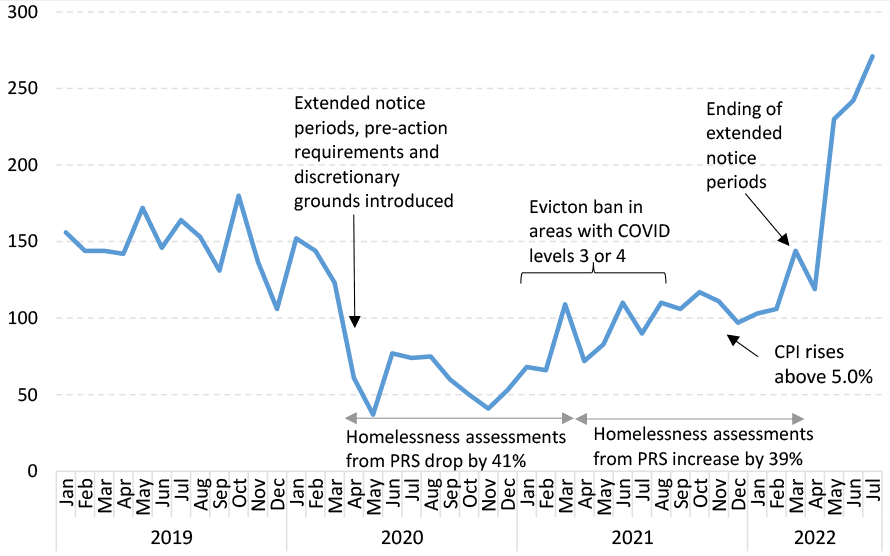
(Source: Figures as provided by the First-tier Tribunal (Housing and Property Chamber) on monthly applications for eviction)
In the social sector, the number of eviction court actions and properties recovered for non-payment of rent in the year to end March-22 have both increased slightly since 2020/21, but are still substantially lower than pre-pandemic levels. (Based on SHR Covid Dashboard figures to 2022 Q1 compared with pre-pandemic annual SHR Charter data).
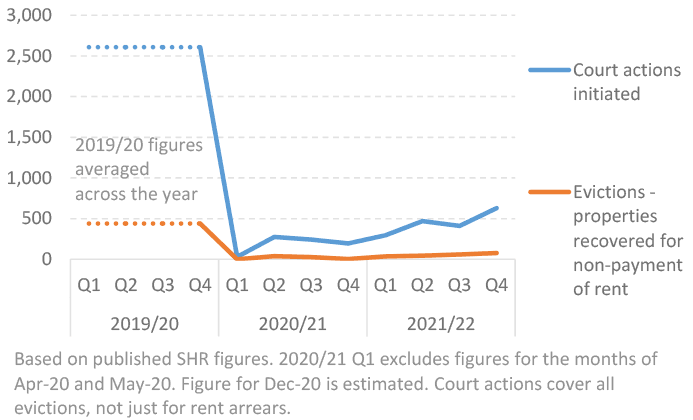
Without intervention it may be that evictions in the social rented sector are likely to rise throughout 2022/23 compared to the previous year, given the increase in the number of new cases being brought to court in recent months, along with a number of cases already in the system to be concluded.
(Source: Figures as provided by the SG Justice Analytical Unit on monthly Scottish Courts and Tribunals Service summary cause eviction registrations and disposals)
As per the Scottish Housing Regulator’s National Report[1] published on 31 August 2022, social landlords had total arrears of rent of £169,626,857 at 31 March 2022. This is 6.3% of total rent due, an increase from 6.1% in the previous year, and the highest level of arrears reported to the Scottish Housing Regulator since the introduction of the Scottish Social Housing Charter in 2012.
Throughout 2021/22, the pandemic continued to affect local authorities’ homelessness service provision. The number of homeless applications in 2021/22 increased by 3% (994) from the previous year to 35,230; 28,882 households were assessed as homeless, an increase of 3% (840) from 2020/21 and instances of households not being offered temporary accommodation also rose by 17%.
(Source: Scottish Government Homelessness in Scotland 2021/22 Statistics)
Requests for Support Services
Citizens Advice Scotland (CAS) have reported recent increases over the last year in relation to people seeking housing advice, as follows:
Private Rented Sector:
- Between Q1 of 2021/22 and Q1 of 2022/23, queries about PRS rents as a proportion of all PRS queries has increased by 28%
- Possession action (not for arrears) in the PRS has gone up 7% in the same period
- Views of the CAS webpage “you are a private sector tenant being taken to court for rent arrears” have increased by 15% between June 2021 and June 2022.
Social Rented Sector:
- Views of the CAS webpage “you are a public sector tenant being taken to court for rent arrears” have increased by 16% between June 2021 and June 2022.
- Unlike in the private rented sector, queries about local authority and Registered Social Landlord rents have decreased since last year.
Social and private rented sector:
- Advice about threatened homelessness due to possession action (could be both private and social sector tenants) has increased by 17% between Q1 of 2021/22 and Q1 of 2022/23.
- Views of the CAS advice webpages “problems with your landlord” and “landlord wants to increase the rent” have gone up by 36% and 159% respectively between June 2021 and June 2022.
Homeowners:
- June 2021 to June 2022 views of the CAS webpage for ‘Schemes that can help you pay your mortgage’ has increased 53%, and ‘Selling your home to pay your mortgage debts’ by 81%.
- Views of the webpage for ‘What to do if you can’t pay your mortgage’ has increased 1,627% from June 2021 to June 2022.
- CAS advice on mortgage arrears is up 16% between Q1 of 2021/22 and Q1 of 2022/23.
(Source: Figures as provided by Citizens Advice Scotland)
Contact
Email: Bruce.Teubes@gov.scot