Coronavirus (COVID-19): state of the epidemic - 21 January 2022
This report brings together the different sources of evidence and data about the Covid epidemic to summarise the current situation, why we are at that place, and what is likely to happen next.
State of the Epidemic in Scotland – 21 January 2022
Background
This report summarises the current situation of the Covid-19 epidemic in Scotland. It brings together the different sources of evidence and data about the epidemic in Scotland at this point in time, why we are at that place, and what is likely to happen next. This summarises the data up to and including 19 January 2022 on Covid-19 in Scotland. This updates the previous publication published on 14 January 2022[1]. The information in this document helps the Scottish Government, the health service and the wider public sector respond to the epidemic and put in place what is needed to keep us safe and treat people who have the virus.
This edition of the State of the Epidemic summarises current data on Covid-19 at a national and local level, and how Scotland currently compares to the rest of the UK. It looks at the vaccination program in Scotland and its impact. Information is provided about variants of concern and what impact these may have. Bringing this information together in one place gives the opportunity to better understand the current state of the epidemic in Scotland.
Testing changes
On 5 January 2022, the Scottish Government announced that people who do not have symptoms of Covid-19 will no longer be asked to take a Polymerase Chain Reaction (PCR) test to confirm a positive Lateral Flow Device (LFD) result. Instead, anyone with a positive LFD, who do not have symptoms, should report the result online as soon as the test is done. This means that those without symptoms who previously would have taken a confirmatory PCR test, will no longer do so. As a result, these positive cases are no longer captured in the number of PCR positive cases reported by the Scottish Government and Public Health Scotland (PHS).
In order to ensure that we continue to provide the most accurate information, changes have been made to the national Covid-19 case definition to reflect this revised testing strategy. From Thursday 13 January, the Scottish Government and PHS began reporting on the number of people with a Covid-19 infection confirmed by either a PCR or first LFD positive test. These figures are classed as “experimental statistics” and may be subject to future revision as the new method for counting combined PCR and LFD tests evolves. These new experimental statistics give us a way to capture both the PCR and LFD positive cases. We need to be careful how we interpret and compare the number of cases before and after the announcement, so caution is advised.
Until 17 January 2022, an individual who tested positive by LFD and then PCR was recorded against the date of each test, resulting in patients being double-counted when the positive cases in the last 7 days was calculated. From 18 January, data is reported consistently on the new method where positive cases are reported against the first positive reporting date from PCR or LFD. Any LFD positive cases that are followed by a negative PCR result within 48 hours will be denotified.
The State of the Epidemic report this week will summarise case and test data up to and including 19 January 2022. The rest of the analysis will also cover up to and including 19 January 2022 for consistency.
The State of the Epidemic Report will continue to include data from the Covid-19 Infection Survey and wastewater analysis (when available), both of which are unaffected by testing policy changes.
Everyone is being encouraged to report their LFD test data so that we can accurately understand and report the prevalence of Covid-19 and allow contacts of those with positive results to rapidly receive the correct advice to prevent onward spread. Please see the blog post for more information about the changes to reporting on Covid-19 cases.
Note on Understanding Covid-19 Test Dates
Different test dates are used when reporting cases and PCR testing data depending on the nature of the data and the use. For rapid surveillance data the reporting date has been used and is included in the figures presented in this report, whereas for detailed surveillance over time the specimen date has been used.
The reporting date is the date that new daily cases are reported by the Scottish Government and Public Health Scotland (PHS), this includes new tests reported to PHS in the previous 24 hours. The time taken for a sample to be processed and provide a result varies and does not indicate the number of samples collected or samples processed on a given day. This is however the most up to date data available.
The specimen date is the date the sample was collected from the patient. Since the time taken to test samples and report the results varies, new cases reported on a daily basis (by reporting date) may be distributed across a range of specimen dates. There is a reporting delay in testing results by specimen date, so data carried out in the most recent two to three days will be incomplete and positive tests during the most recent 10-day period may be subject to change. The specimen date data is more accurate and is recommended for interpreting data trends. Data by specimen date is used in the majority of charts and headline figures in this report as it is more suitable for surveillance of Covid-19 over a period of time. In this report the specimen date data has a three-day lag, except for comparisons across the four nations which has a five-day lag to account for different data collections across the four nations.
Summary
After the peak of PCR cases in early January 2022 there has been a decreasing trend in both PCR confirmed cases and in PCR and LFD cases reported. The Covid-19 Infection Survey also shows that the number of people in the private residential population testing positive for Covid-19 is decreasing in the week to 15 January 2022, from a peak in early January 2022. While overall incidence appears to be decreasing, combined PCR and LFD case rates have increased for those aged 2-4 and 5-11 in the week to 16 January. The rapid increase in PCR confirmed cases throughout December 2021, as a result of the spread of the Omicron variant, translated into a high level of Covid-19 hospital admissions, peaking at an average of over 150 per day at the beginning of January 2022. Admissions to hospital for people with confirmed Covid-19 have now started to decrease. Similarly, Covid-19 ICU admissions are now decreasing from a peak in early January 2022. The latest Modelling the Epidemic report includes projections over the next few weeks for combined Delta and Omicron infections.
Key Points
- Latest modelled estimates suggest that, as at 4 January 2022, the incidence of new daily infections in Scotland was between 180 and 1,032 new infections per 100,000. These figures are based on data to 17 January 2022.
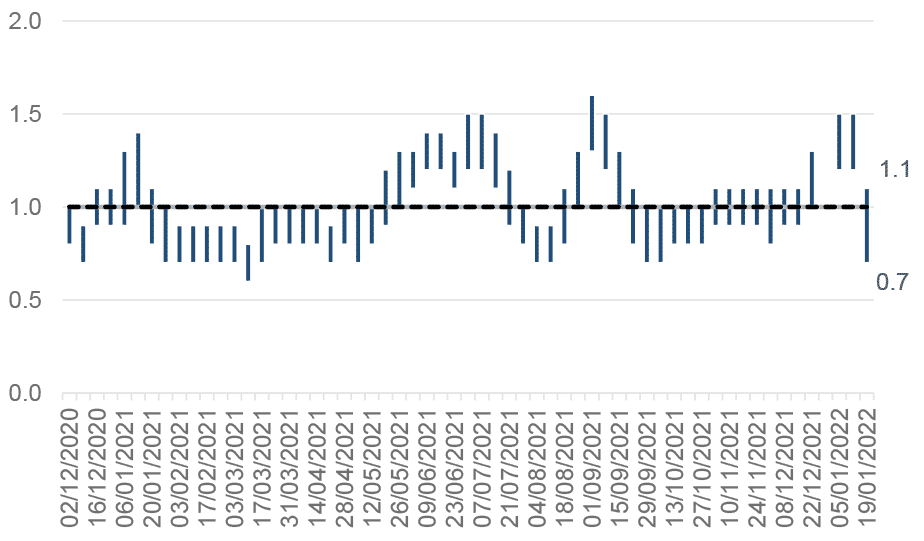
- The UKHSA’s best estimate for R in Scotland is between 0.7 and 1.1, as of 4 January 2022. However, there is considerable variation in the individual model estimates which are combined for this estimate, and very high uncertainty in the estimate of R this week, with the range of confidence bounds estimated by the individual models ranging from 0.2 to 1.8.
- The daily growth rate for Scotland is currently estimated as between -8% and 1% as at 4 January 2022. The lower and upper limits have decreased since last week.
- As determined through the latest weekly ONS infection survey, the percentage of people testing positive for Covid-19 in the private residential population in Scotland decreased in the week 9 to 15 January 2022, equating to around 1 in 20 people.
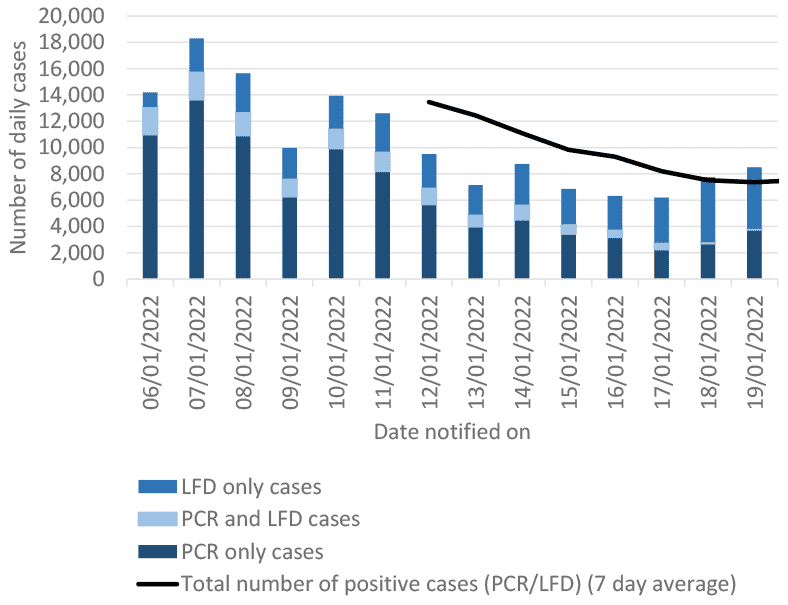
- By reporting date, an average number of 7,360 cases (either PCR or LFD) were reported per day in the week leading up to 19 January 2022. This is a 45% decrease from the daily average of 13,453 cases reported in the week to 12 January 2022.
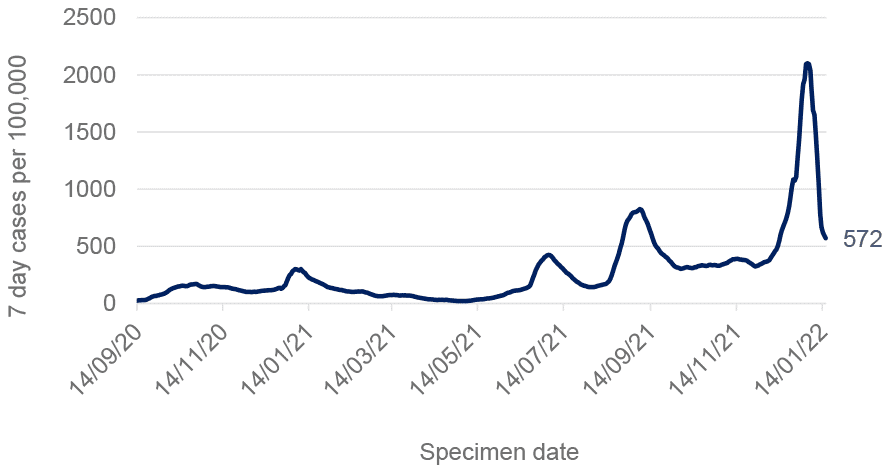
- By specimen date, seven day PCR case rates decreased in Scotland in the week leading up to 16 January 2022. There were 572 weekly PCR cases per 100,000 population in the week to 16 January 2022, which is a 61% decrease from 1,469 weekly cases per 100,000 on 9 January 2022. However, caution must be exercised interpreting these figures following changes to the testing policy.
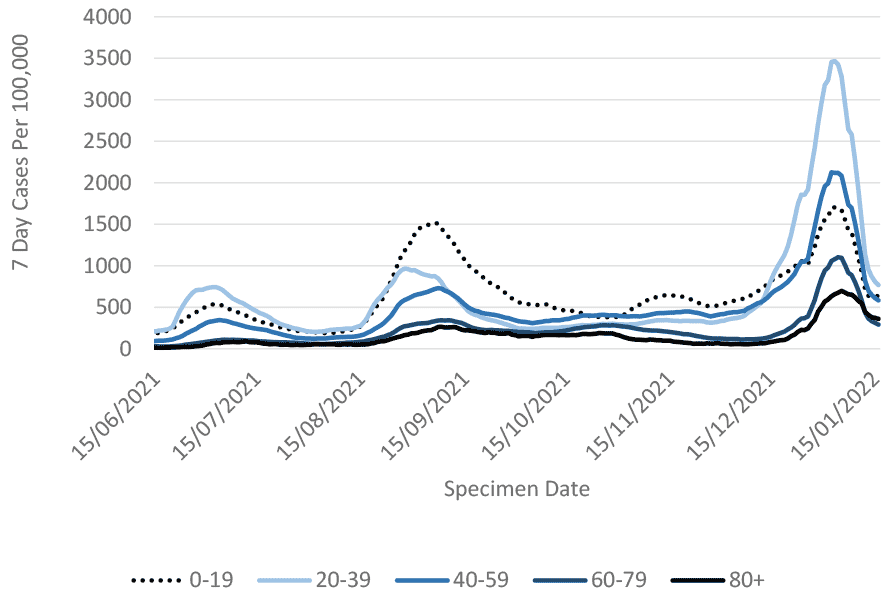
- As of 16 January 2022, the highest PCR case rates by specimen date were observed amongst those aged 20-39, followed by under 20, 40-59, 80+ and 60-79. However, caution must be exercised interpreting these figures following changes to the testing policy.
- The combined PCR and LFD case rates per 100,000 among children and young people (aged under 22) have increased for those aged 2-4 and 5-11, and decreased in all other younger age groups.
- In the week to and including 19 January 2022 Covid-19 hospital occupancy fluctuated and increased overall by 2% and Covid-19 ICU occupancy (short and long stay) decreased by 14% from the previous week (12 January 2022).
- Admissions to hospital in the week to 15 January decreased by 13% compared to the previous week ending 8 January, while ICU admissions have decreased by 44% in the week to 18 January compared to the previous week ending 11 January.
- Average hospital admissions (three-week rolling average) related to Covid-19 in children and young adults (aged under 22) have continued to increase overall in the week leading up to 12 January 2022 compared to the previous three-week period leading up to 5 January 2022, and have surpassed the previous peak seen in September 2021. Hospital admissions related to Covid-19 in children and young adults are the highest since the start of the pandemic. These figures refer both to young patients in hospital because of Covid-19 and with Covid-19.
- There were 132 deaths registered where Covid-19 was mentioned on the death certificate in the week to 16 January 2022. This is an increase of 60, or 83%, in the number of deaths from the previous week. The biggest increase in the number of deaths compared to the previous week occurred among those aged over 85.
- East Lothian currently has the highest weekly PCR case rate in Scotland reporting 679 weekly cases per 100,000 in the week to 16 January. Shetland has the lowest PCR case rate in Scotland, reporting 74 weekly cases per 100,000 population in the same week.
Method
This report brings together a wide range of publically available figures from a range of data sources. These include publications by Scottish Government, Public Heath Scotland, National Records of Scotland and Office for National Statistics along with scientific publications and SAGE and UKHSA summaries where appropriate to summarise the state of the epidemic in Scotland in a given week. We also provide information on public attitudes to the virus from weekly YouGov polling surveys.
Estimated Infection Levels and Case Numbers
Estimated Infection Levels
The reproduction number (R) is the average number of secondary infections produced by a single infected person. If R is greater than one the epidemic is growing, if R is less than one the epidemic is shrinking. The higher R is above one, the more people one infectious person might further infect other people and so the faster the epidemic grows. For more information please visit the UK government website.
The UK Health Security Agency’s (UKHSA) best estimate for R in Scotland as of 4 January 2022 is between 0.7 and 1.1 (Figure 1)[2] [3]. However, there is considerable variation in the individual model estimates which are combined for this estimate and very high uncertainty in the estimate of R this week, with the range of confidence bounds estimated by the individual models ranging from 0.2 to 1.8. Please note that R is an indicator that lags by two or three weeks. The upper and lower limit of the R value has decreased since the last published R value.
The growth rate reflects how quickly the numbers of infections are changing day by day. It is an approximation of the percentage change in the number of new infections each day. More information can be found on the UK government website.
The latest growth rate for Scotland as at 4 January 2022 was between -8% and 1%[5]. The upper and lower growth rate limits have decreased since the previous week[6]. This would suggest that, as at 4 January, the incidence of new daily infections in Scotland was between 180 and 1,032 new infections per 100,000[7]. This equates to between 9,800 and 56,400 people becoming infected each day in Scotland.
Covid Infection Survey
The Covid-19 Infection Survey is a UK wide study carried out by the Office for National Statistics (ONS) and the University of Oxford. The survey invites private residential households to test whether they have the infection, regardless of whether they have symptoms, using a PCR test. Participants are also asked to provide a blood sample to test for antibodies. This means the study is unaffected by testing policy changes mentioned at the start of this report.
The percentage of people testing positive for Covid-19, in Scotland, in the private residential population decreased in the week 9 to 15 January 2022 to 4.49% (95% credible interval: 4.03% to 5.00%), equating to around 1 in 20 people. This is higher than the latest peak of 2.29% recorded in the week to 11 September 2021, and higher than the previous peak of 1.24% recorded in the week to 17 July 2021.
The decrease in the proportion testing positive in the Covid-19 Infection survey aligns with the decrease seen in PCR and LFD confirmed cases at the beginning of January 2022.
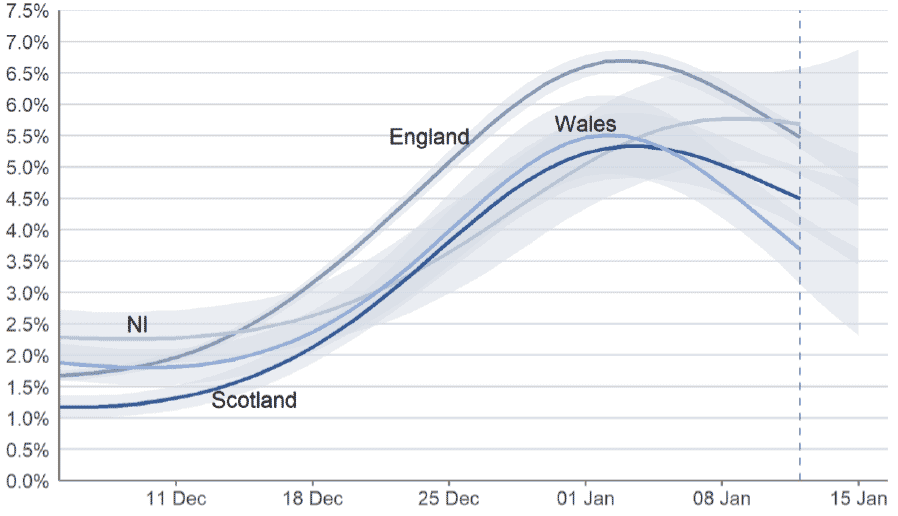
In the week 9 to 15 January 2022, estimates for the other nations of the UK are as follows and can be seen in Figure 2:
- In England, the percentage of people testing positive in private residential households decreased in the most recent week: 5.47% (95% credible interval: 5.29% to 5.64%), equating to around 1 in 20 people.
- In Wales, the percentage of people testing positive in private residential households decreased in the most recent week: 3.69% (95% credible interval: 3.13% to 4.23%), equating to around 1 in 25 people.
- In Northern Ireland, the percentage of people testing positive in private residential households has increased over the most recent two weeks, however the trend is uncertain in the most recent week: 5.68% (95% credible interval: 4.87% to 6.57%), equating to around 1 in 20 people[8].
In Scotland, the percentage testing positive decreased in those of nursery and school age, and the trend was uncertain for young adults and the older age groups in the most recent week[9].
Wastewater Estimates
The Scottish Government has been working with the Scottish Environment Protection Agency (SEPA) to detect and analyse fragments of Covid-19 virus RNA in wastewater. The number of locations where the levels of SARS-CoV-2 in wastewater are monitored has increased to 141 sites around Scotland. In contrast to Covid-19 case records, virus shedding into wastewater is a biological process. This means that wastewater data is unaffected by factors that impact whether testing is done.
We are not including our usual update on Covid-19 levels in wastewater this week, but hope to provide this again in future reports. For wastewater estimates from previous weeks, please see previous reports.
Covid-19 Cases
Please note that on 5 January 2022 people were advised that they no longer need to seek a confirmatory PCR test following a positive lateral flow test. This will impact the number of cases reported after 5 January 2022. This means that comparisons over time need to be made with caution.
By reporting date[10], an average number of 7,360 cases (either PCR or LFD[11]) were reported per day in the week leading up to 19 January 2022. This a 45% decrease from the daily average of 13,453 cases reported in the week leading up to 12 January 2021 (Figure 3)[12]. The Omicron variant now represents the dominant variant in Scotland[13]. For more information on the emergence of the Omicron variant, see earlier publications.
By specimen date[15], seven day PCR case rates decreased in Scotland in the week leading up to 16 January. There were 572 weekly PCR cases per 100,000 population in the week to 16 January 2022, which is a 61% decrease from 1,469 weekly cases per 100,000 on 9 January (Figure 4)[16]. Covid case data that combines PCR and LFD test results are not yet available by specimen date following the change in testing policy on 5 January, so the figures above and in Figure 4 only include PCR test results and caution must be exercised interpreting these figures.
Breakdowns by age (for all age groups) of Covid case data that combines PCR and LFD test results are not yet available, therefore the following age breakdowns only include test results from PCR tests. As of 16 January 2022, the highest PCR case rates by specimen date were observed amongst those aged 20-39, followed by under 20, 40-59, 80+ and 60-79 (Figure 5). Caution must be exercised interpreting these figures following changes to the testing policy.
The highest combined PCR and LFD case rates by specimen date among children and young people (aged under 22) in the week to 16 January 2022, were observed among those aged 5-11, followed by 12-15. Combined PCR and LFD case rates among children and young adults have increased for those aged 2-4 and 5-11, and have decreased in all other age groups. All younger age groups apart from those aged under one continued to have a higher seven day combined PCR and LFD case rate than the Scotland average in this time period[17].
While it may be helpful to compare case rates between the UK nations, comparisons must be made with caution due to definitional differences. Cases data from Scotland and Wales used below includes only PCR test results. Cases data from Northern Ireland includes both PCR and LFD results, and cases data from England includes PCR, LFD and LAMP (loop-mediated isothermal amplification) test results.
On 19 January 2022, average daily cases by reporting date[19] in Scotland were 813 per one million population. In the same time period, the average daily cases by reporting date were as follows for the other UK nations[20]:
- England: 1,471 per one million
- Northern Ireland: 1,729 per one million
- Wales: 728 per one million[21].
By specimen date, Scotland’s seven-day average of daily cases per one million was 889 on 14 January 2022. For the same period, the other UK nations were as follows[22]:
- Northern Ireland: 1,684 per one million
- England: 1,409 per one million
- Wales: 784 per one million[23].
Testing Rates and Positivity
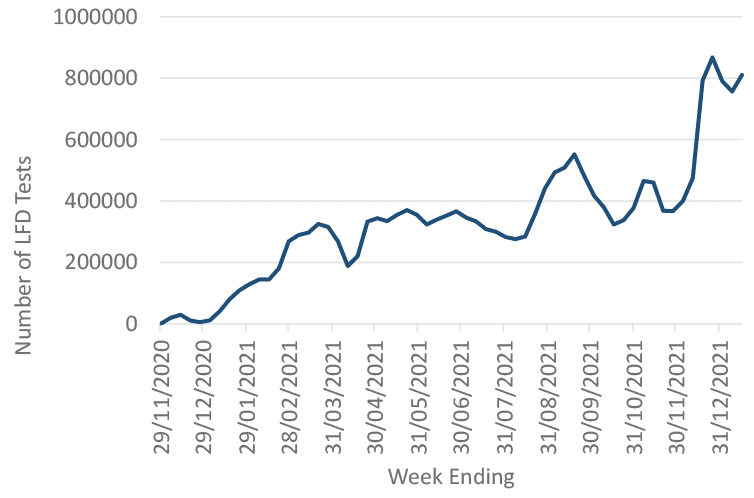
After a period of increase, the seven-day total of conducted PCR tests per 1,000 populations peaked at 83 on 7 January, and has since decreased to 38 on 19 January. Showing a similar trend, the proportion of positive PCR tests in the last seven days (test positivity rate), reached 29.4% on 4 January 2022, and decreased to 17.4% on 12 January 2022[24]. However, caution must be exercised interpreting these figures following changes to the testing policy.
After a decrease in the number of LFD tests that were reported between 2 and 9 January, there was a 7% increase in the number reported in the week leading up to 16 January 2022[25]. This follows a sharp increase in LFD tests that were reported throughout December 2021 (Figure 6)[26].
Scottish Contact Survey asks whether people use Lateral Flow Device tests and if so how often. Approximately 72% of individuals had taken at least one lateral flow test within the last 7 days for the survey pertaining to the 9 -15 December. This rose to 84% for the survey pertaining to the 6 - 12 January [27].
Severe Illness: Hospitalisation, ICU and Deaths
Hospital and ICU Occupancy and Admissions
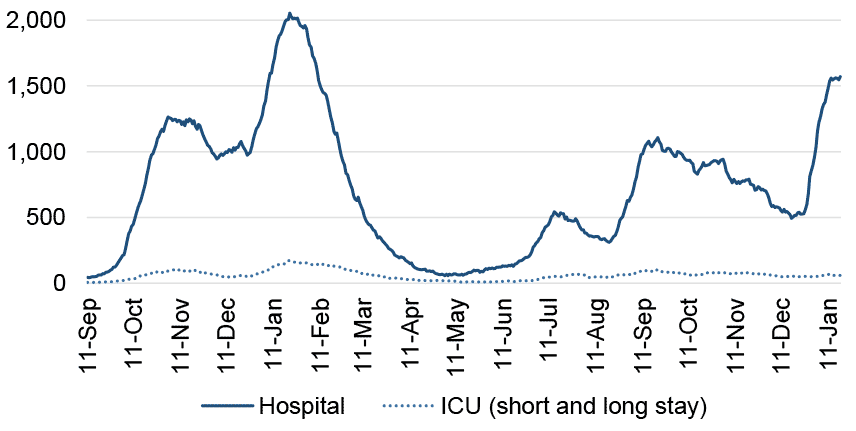
In the week to and including 19 January 2022 Covid-19 hospital occupancy fluctuated. NHS boards reported 1,571 patients in hospital on 19 January 2022 with recently confirmed Covid-19, compared to 1,546 on 18 January 2022 and 1,537 a week ago (12 January 2022). This is an increase of 34 patients, or 2%, from last week and compares with 2,053 patients in hospital at the peak in January 2021 (Figure 7).
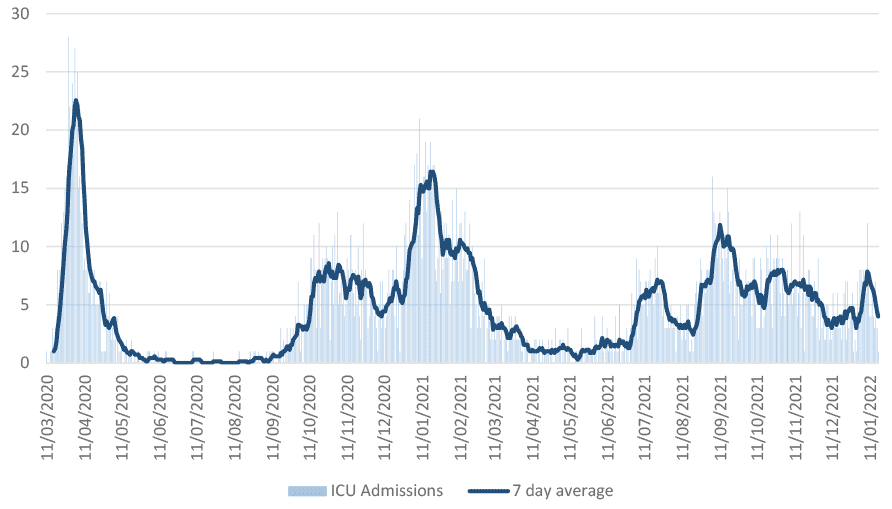
ICU occupancy (including short and long stay) has decreased slightly to 60 patients on 19 January, a decrease of 10 patients or 14% since 12 January, and remains lower than the peak of 172 ICU patients recorded in January 2021 (Figure 7)[28]. However, in this same week the number of patients in long-stay ICU (more than 28 days) has increased slightly from 11 patients on 12 January to 16 patients on 19 January.
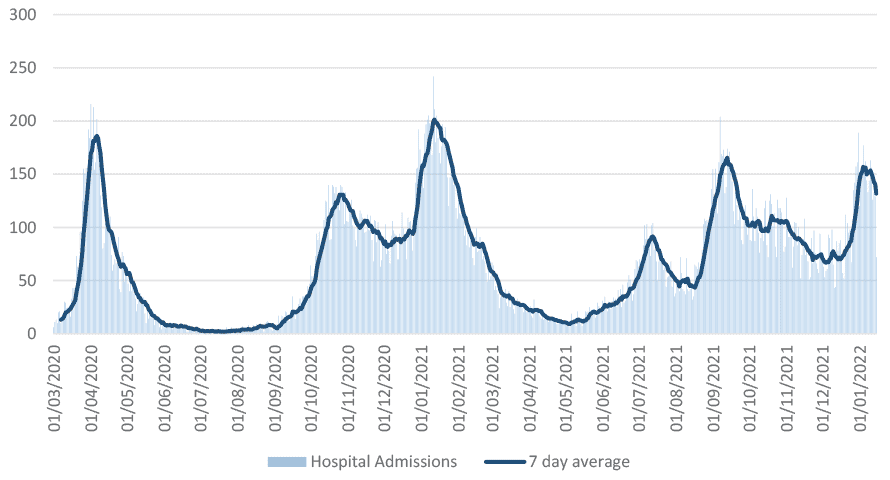
Admissions to hospital have decreased over the last week, with 923 admissions to hospital for people with confirmed Covid-19 in the week to 15 January 2022 compared to 1,061 in the week to 8 January (Figure 8)[30]. This is a 13% decrease.
Average hospital admissions (three-week rolling average) related to Covid-19 in children and young adults (aged under 22) have continued to increase overall in the week leading up to 12 January 2022 compared to the previous three-week period leading up to 5 January, and have surpassed the previous peak seen in September 2021. The highest number (three-week rolling average) of hospital admissions in children and young adults was seen among those aged 0-1 in the same time period. Hospital admissions related to Covid-19 in children are the highest since the start of the pandemic[31]. These figures refer both to young patients in hospital because of Covid-19 and with Covid-19.
The latest data from PHS shows 28 new Covid-19 patients admitted to ICU in the week to 18 January, compared to 50 in the week to 11 January (Figure 9)[33]. This is a 44% decrease in the latest week. In the last week from 8 to 14 January 2022, in an age-standardised population, the rate of acute COVID-19 related hospital admissions in individuals that received a booster or third dose of a COVID-19 vaccine was between 2.3 to 3.9 times lower than in individuals who are unvaccinated or have only received one or two doses of a COVID-19 vaccine[34] [35].
A clinical audit and further review of case notes shows that in NHS Greater Glasgow and Clyde, NHS Grampian and NHS Dumfries and Galloway[36], 63% of acute hospital admissions were ‘because of’ Covid-19 as opposed to coincidental ‘with’ Covid-19. This is lower than the previously reported value of 68% from discharge summaries from NHS boards from between March and August 2021, however these are not directly comparable.
Further analysis showed that 42% of all hospital admissions ‘because of’ Covid were in those aged over 65. Equal proportions of people in hospital ‘because of’ Covid-19 and ‘with’ Covid-19 were fully vaccinated. Data shows that 83% of hospital admissions with a known vaccination status in NHS Dumfries and Galloway and NHS Greater Glasgow and Clyde were infected with Omicron. This compares to just 36% in NHS Grampian. It is likely that the lower proportion of Omicron admissions in NHS Grampian reflects the different pace of variant transmission across Scotland. It should be noted that similar proportions of people with Omicron and Delta were admitted to hospital ‘because of’ their infections[37].
While it may be helpful to compare hospital occupancy between the UK nations, any comparisons must be made with caution. Definitions are not consistent across the nations and data are not reported daily by each nation. Additionally, hospitalisation data from Scotland, Wales and Northern Ireland is updated retrospectively if errors come to light. Data from England is not revised retrospectively, but instead is corrected in the following day's data update. For more information see UK Government website.
There were 18,979 confirmed Covid-19 patients in hospital in the UK on 18 January 2022, which is a 4% decrease from 19,829 on 11 January 2022 [38]. How this is reported across the 4 nations can be found in Table 1.
| Hospital occupancy on 18 January 2022 | Hospital occupancy on 11 January 2022 | Weekly % change in occupancy | |
|---|---|---|---|
| England | 16,218 | 16,939 | -4% |
| Scotland | 1,546 | 1,479 | 5% |
| Northern Ireland | 404 | 521 | -22% |
| Wales | 811 | 890 | -9% |
| UK | 18,979 | 19,829 | -4% |
Admissions to hospital have decreased (-5%) across the UK over the last week, with 14,927 admissions to hospital for people with confirmed Covid-19 in the week to 15 January 2022 compared to 15,697 in the week to 8 January. Hospital admissions across the 4 nations can be found in Table 2.
| Admissions to hospital in the week to 15 January | Admissions to hospital in the week to 8 January | Weekly % change in admissions | |
|---|---|---|---|
| England | 13,449 | 14,017 | -4% |
| Scotland | 923 | 1,061 | -13% |
| Northern Ireland | 247 | 290 | -15% |
| Wales | 308 | 329 | -6% |
| UK | 14,927 | 15,697 | -5% |
Deaths
There were 132 deaths registered where Covid-19 was mentioned on the death certificate in the week to 16 January 2022. This is an increase of 60, or 83%, from the 72 deaths reported the previous week, but 80% lower than the peak in April 2020 (663 deaths)[41].
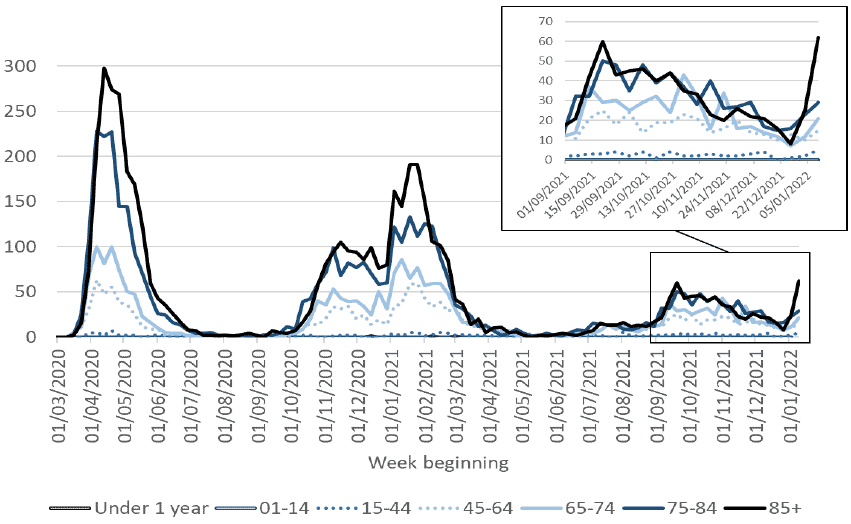
In the week to 16 January 2022, deaths involving Covid-19 increased across all age groups 15 and above years old compared to the week before (ending 9 January) (Figure 10). The biggest increase in death numbers was seen among those aged over 85, with 62 Covid related deaths having occurred in the week to 16 January compared with 25 the week before. National Records of Scotland publish a weekly detailed analysis on deaths involving Covid-19 in Scotland in their weekly report[42].
While it may be helpful to compare deaths between the UK nations, any comparisons must be made with caution. Covid death definitions are not consistent across the nations. For more information see UK Government website.
There were 4 average daily deaths in Scotland per one million people on 19 January. Average daily deaths per one million population on 19 January for other UK nations were as follows:
- England: 4 per one million population
- Wales: 3 per one million population
- Northern Ireland: 3 per one million population[43].
Resilience: Vaccinations, Antibody Estimates and Variants of Concern
Vaccinations
As of 19 January 2022 almost 4.4 million people (91.8% of those aged over 12) had received their first dose and almost 4.1 million people (85.5% of those aged over 12) had received their second dose. There remains a low level of deaths amongst vaccinated individuals[44].
A booster dose or a third dose of the vaccine is now available in Scotland, in line with JCVI advice including all adults aged over 16 for whom it has been at least 12 weeks since their second dose[45]. Over 3.2 million people (67.4% of those over 12 years of age) have received their dose 3 or booster vaccine by 19 January 2022[46].
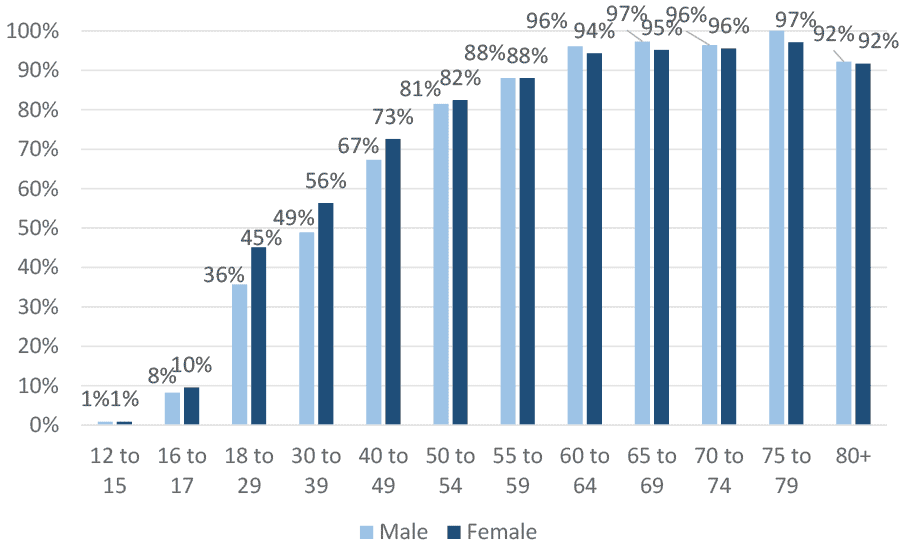
Booster vaccine uptake is at least 92% amongst both males and females aged 60 or over, and around 88% for those aged 55 to 59. However, there is a difference between male and female vaccine uptake among those aged between 18 and 49 with females showing a higher uptake compared to males (Figure 11).
Antibodies Estimates
The ONS Covid-19 Infection Survey estimated that in the week beginning 20 December 2021, 97.7%[47] of the adult population living in private residential households in Scotland would have tested positive for antibodies against SARS-CoV-2 at the standard threshold, as a result of having the infection in the past or being vaccinated. This compares to:
- 97.5% in England (95% CI: 97.0% to 97.9%),
- 96.8% in Wales (95% CI: 95.9% to 97.5%),
- 97.4% in Northern Ireland (95% CI: 96.0% to 98.2%)[48].
The percentage of adults aged 16 and over testing positive for antibodies ranged from 96.4% to 99.1%. The highest percentage of people testing positive for antibodies was in those aged 65 to 69 at 99.1% (95% credible interval: 98.5% to 99.4%), followed by those aged 70 to 74[49].
Variants of Concern: Omicron Variant
The latest Omicron risk assessment carried out by the UK Health Security Agency (UKHSA), established with high confidence from analysis of UK data that Omicron is showing increased growth advantage compared to Delta, the previously dominant variant. There is also high confidence that Omicron displays a substantial immune evasion properties including both natural and vaccine derived immunity however, Omicron infections have a reduced relative risk of hospitalisation (high confidence)[50].
The UKHSA reported that vaccine effectiveness against symptomatic disease with the Omicron variant is lower compared to the Delta variant and wanes rapidly. For two doses of AstraZeneca, effectiveness against symptomatic disease dropped from between 45 and 50% to almost no effect against Omicron from 20 weeks after the second dose. For two doses of Pfizer or Moderna effectiveness against symptomatic disease dropped from around 65 to 70% down to around 10% by 20 weeks after the second dose. Between two to four weeks after a booster dose vaccine effectiveness against symptomatic infection ranged from around 65 to 75%, dropping to 55 to 65% after between five and nine weeks, and to 45 to 50% after 10 or more weeks after the booster[51] [52].
However, vaccine effectiveness against hospitalisation is high, preliminary estimated at 92% (89 to 94%) for Omicron after three doses of vaccine, dropping to 83% after ten or more weeks after a booster dose[53] [54]. More data is needed to estimate the duration of vaccine effectiveness against hospitalisation over time. Vaccine effectiveness against mortality with the Omicron variant is expected to be similar or higher to those against hospitalisation.
There is evidence that there is reduced overall risk of hospitalisation for Omicron compared to Delta[55] [56], with the most recent estimate of the risk of presentation to emergency care or hospital admission with Omicron was approximately half of that for Delta[57].
Situation by Local Authority within Scotland
Following the testing policy changes announced on 5 January 2022, any comparisons between local authorities or comparisons over time should be made with caution.
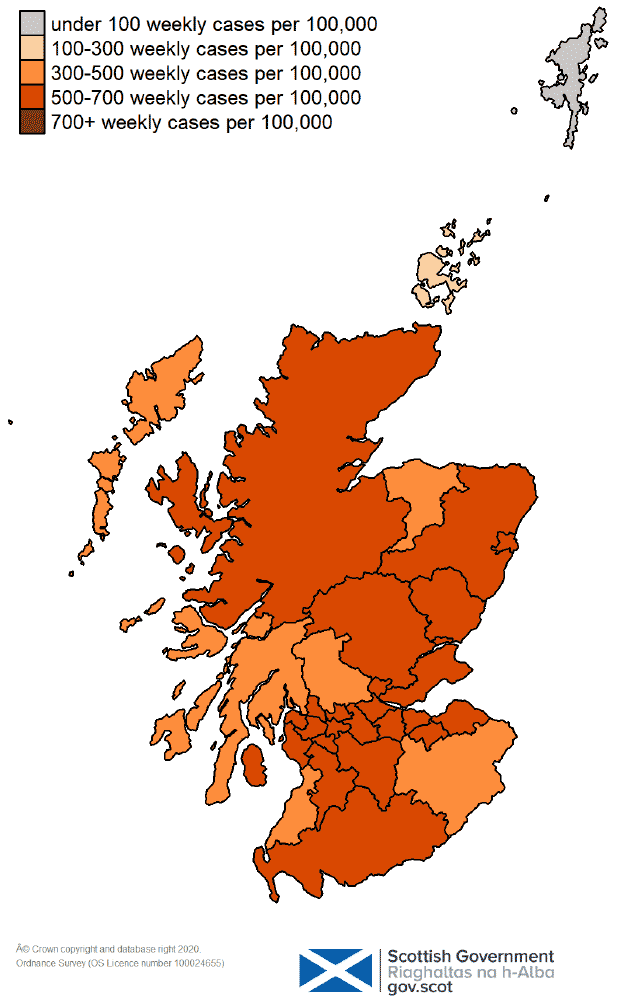
PCR case rates have decreased in Scotland over the past week, with all local authorities seeing a decreasing PCR case rate over the week leading up to 16 January 2022. East Lothian currently has the highest weekly PCR case rate in Scotland reporting 679 weekly cases per 100,000 in the week to 16 January. Shetland has the lowest PCR case rate in Scotland, reporting 74 weekly cases per 100,000 population in the same week (Figure 12 and Table 3)[58].
Please note that the local authority hotspot modelling continues to be based on Covid-19 cases and deaths using data to 17 January 2022 from several academic groups to give an indication of whether a local authority is likely to experience high levels of Covid-19 in two weeks’ time. This has been compiled via UKHSA into a consensus.
There is uncertainty in regions with smaller populations, and hence lower test counts, in particular in regions such as Na h-Eileanan Siar, Orkney Islands and Shetland Islands. This has led to one model not being included in the combination for these three regions. Please note that this analysis does not account for LFD data.
Modelled rates of positive PCR tests per 100,000 population indicate that, for the week commencing 30 January 2022, 3 of the 32 local authorities are expected to exceed 50 PCR cases per 100,000 population with at least 75% probability[59]. These are Clackmannanshire, East Lothian and Midlothian. No local authorities are expected to exceed 100 cases per 100,000 population with at least 75% probability[60].
| Local authority | Total new cases in the week, per 100,000 population | Change since previous week |
|---|---|---|
| East Lothian | 679 | -675 |
| Clackmannanshire | 673 | -790 |
| Falkirk | 653 | -920 |
| South Lanarkshire | 644 | -1212 |
| Fife | 645 | -830 |
| Dundee City | 638 | -743 |
| Glasgow City | 622 | -961 |
| Midlothian | 615 | -670 |
| City of Edinburgh | 601 | -757 |
| Aberdeen City | 577 | -841 |
| Perth and Kinross | 590 | -802 |
| Angus | 583 | -844 |
| Renfrewshire | 579 | -1145 |
| North Lanarkshire | 568 | -1103 |
| Inverclyde | 562 | -1277 |
| West Dunbartonshire | 552 | -1306 |
| East Ayrshire | 554 | -971 |
| North Ayrshire | 544 | -1064 |
| East Renfrewshire | 535 | -1059 |
| East Dunbartonshire | 533 | -886 |
| Highland | 515 | -672 |
| West Lothian | 509 | -822 |
| Dumfries and Galloway | 505 | -957 |
| Aberdeenshire | 513 | -662 |
| Stirling | 497 | -858 |
| Moray | 451 | -1025 |
| South Ayrshire | 433 | -1009 |
| Na h-Eileanan Siar | 411 | -204 |
| Argyll and Bute | 410 | -678 |
| Scottish Borders | 377 | -634 |
| Orkney Islands | 192 | -504 |
| Shetland Islands | 74 | -538 |
| Scotland | 572 | -897 |
Looking ahead
Scottish Contact Survey
Changes in patterns of mixing and adherence to restrictions will impact on future case numbers. The Scottish Contact Survey measures times and settings that people mix where they could potentially spread Covid-19. Average contacts from the most recent Panel A cohort of the Scottish Contact Survey (week ending 12 January) indicate an average of 4.2 contacts.
Mean contacts have decreased within the work and other setting (contacts outside home, school and work) reducing by 17% and 47% respectively. Contacts within the home have also decreased by 18%, returning to levels observed before the increase over the festive period.
All age groups show a decrease in contacts with the exception of those aged between 30-49 who have reported an increase. These increases are largely driven by a rise in contacts within the workplace.
Self-reported compliance with the current regulations and guidance has decreased since January but remains at a high level. On 18-19 January, 65% of people reported ‘complete’ or ‘almost complete’ compliance[62].
Modelling the Epidemic
The latest Modelling the Epidemic report includes projections over the next few weeks for combined Delta and Omicron infections. These projections include the effect of the interventions announced on 14 and 21 December 2021, and those announced as being lifted from 17 and 24 January 2022, and booster take up. With this taken into account, it is estimated that infections may be between 5,000 and 50,000 in early February[63].
The report also provides the impact of the projections on the number of people in hospital and ICU. There continues to be uncertainty over hospital occupancy and intensive care in the next three weeks[64].
Long Covid
Over the four-week period ending 6 December 2021, an estimated 1,266,000 people (95% confidence interval: 1,228,000 to 1,304,000) in the private residential population in the UK (1.96%; 95% CI: 1.90% to 2.02%) reported experiencing long Covid (symptoms persisting more than four weeks after the first suspected coronavirus (Covid-19) episode that are not explained by something else). In Scotland, over the same period, an estimated 100,000 people (1.90% of the respective population) in the private residential population reported experiencing long Covid of any duration. This compares to 1.98% in England, 1.91% in Wales and 1.57% in Northern Ireland[65].
Modelling of long Covid estimates that at 6 February 2022 between 64,000 (1.2% of the population) and 161,000 (3.0%) people are projected to self-classify with long Covid for 12 weeks or more after their first suspected Covid infection in Scotland[66]. These are preliminary results, further data on rates of long Covid and associated syndromes as research emerges are required.
Next steps
The Scottish Government continues to work closely with Public Health Scotland, modelling groups, Office of National Statistics (ONS), Scottish Environment Protection Agency (SEPA) and YouGov to monitor what is happening across Scotland.
Each week this report will provide an overview of the current Covid-19 situation in Scotland. This will include real time data on case rates, hospitalisations and deaths and how Scotland’s figures compare to those from the rest of the UK. Following the change in testing policy in Scotland this report will focus on Covid-19 Infection Survey and wastewater estimates to bring an insight in to the pandemic.
Modelling can tell us where the epidemic is likely to be heading. Local data and data by age group can highlight where problems arise, which can help in addressing some of these issues. In the coming weeks the roll out of the vaccine will continue to be monitored along with the impact of this on case rates, hospital admissions and deaths among different age cohorts. Wastewater monitoring and Covid-19 Infection Survey will provide key insights in response to the pandemic.
Investigations are ongoing by NERVTAG, SPI-M, SAGE, UK Health Security Agency (UKHSA), and Public Health Scotland regarding the impact of new variants and of vaccination; this will be reflected here as work is undertaken.