Coronavirus (COVID-19): state of the epidemic - 14 April 2022
This report brings together the different sources of evidence and data about the Covid epidemic to summarise the current situation, why we are at that place, and what is likely to happen next.
Severe Illness: Hospitalisation, ICU and Deaths
Hospital and ICU Occupancy and Admissions
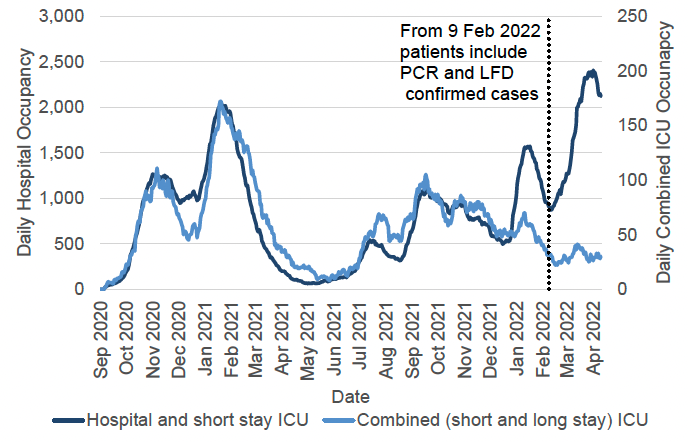
Following changes in the Covid-19 Case definition and changing testing policies on 5 January 2022, hospital and ICU occupancy figures include patients with Covid-19 cases confirmed by either PCR or LFD from 9 February and onwards. Prior to this date, it only included cases confirmed by a PCR test. Hospital and ICU occupancy both include reinfection cases. Covid-19 occupancy figures presented in this section may include patients being admitted and treated in hospital or ICU for reasons other than COVID-19.
Please note that patient testing requirements changed on the 1 April 2022, which may mean a reduction in asymptomatic cases of Covid detected and a corresponding decrease in Covid related occupancy and admissions. This should be taken into consideration in any interpretations. For more information, please see this resource from the NHS.
In the week to 11 April, daily Covid-19 hospital occupancy decreased[44]. NHS boards reported 2,118 patients in hospital or in short stay ICU on 11 April with recently confirmed Covid-19, compared to 2,380 on 4 April. This is a decrease of 262 patients (11%) from a week previously, and follows a period of sharply increasing hospital occupancy numbers which peaked on 2 April with the highest figure seen throughout the pandemic at 2,405 patients (Figure 9)[45].
Combined Covid-19 ICU occupancy (including short and long stay) remains at similar levels on 11 April with 30 patients, compared to a week previously on 4 April with 29 patients. The number of combined ICU occupancy remains lower than the peak of 172 ICU patients recorded in January 2021 (Figure 9). There were 23 patients in short stay ICU on 11 April, compared to 24 a week previously (4 April). This is a decrease of 1 patient. There were 7 patients in long stay ICU on 11 April, compared to 5 a week previously (4 April). This is an increase of 2 patients[46].
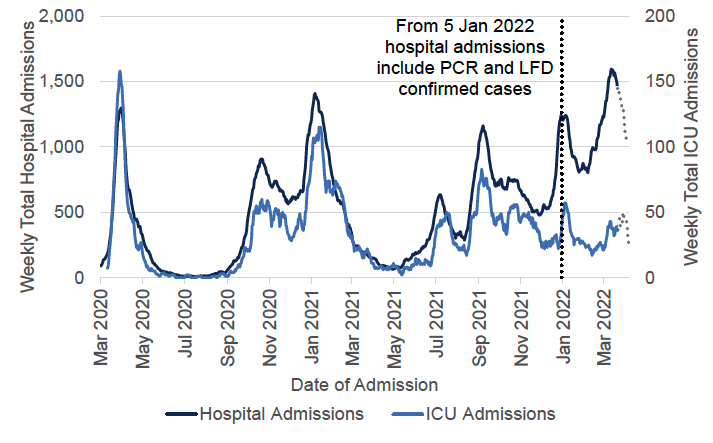
Covid-19 admissions to hospital (including for children and young people) include patients with Covid-19 cases confirmed either by PCR or LFD from 5 January and onwards. Prior to this date, it only included cases confirmed by a PCR test. Hospital admissions include reinfection cases. Please note that admissions to ICU only include PCR confirmed Covid-19 cases. Covid-19 occupancy figures presented in this section may include patients being admitted and treated in hospital or ICU for reasons other than COVID-19.
Please note that hospital admissions data in Scotland is dynamic and subject to daily revisions. We are currently seeing a large number of mostly upward revisions which is likely due to infections being identified after patients have been admitted to hospital. As the greatest revisions are likely to impact the latest two weeks of data, we have moved to reporting week-on-week comparisons with a two-week lag. You can still see the latest data in Figure 10 but we advise caution in interpreting the latest trends.
Admissions to hospital have decreased over the latest week, with 1,496 admissions to hospital for people with confirmed Covid-19 in the week to 26 March compared to 1,579 in the week to 19 March. This is a 5% decrease. This follows a period of sharply increasing numbers of Covid-19 related hospital admissions, reaching the highest levels seen throughout the pandemic in the week to 18 March 2022 (1,595 admissions)[49]. As noted above, we are currently seeing a large number of daily revisions, so comparisons for the latest two weeks of data have not been made[50]..
There were 42 new Covid-19 patients admitted to ICU in the week to 29 March, compared to 32 in the week to 22 March. This is a 31% increase, and compares to 57 weekly ICU admissions during the most recent peak in early January 2022. As noted above we are currently seeing a large number of daily revisions, so the number of admissions to ICU for the latest two weeks are likely to change (Figure 10)[51].
The highest number of hospital admissions in the week to 5 April were among those aged 80 and over. In the same week, approximately 59% of the hospital admissions related to patients aged 60 or older. This is a decrease from 63% in the week to 29 March[54]. The proportion of Covid-19 hospital admissions staying for 48 hours or longer was 58% between 16 March and 29 March; the proportion was higher for those aged 60 years and over[55].
For this publication, there are no updates from the Public Health Scotland Education Surveillance Dashboard on Covid-19 hospital admissions among children and young people due to the public holiday.
Not all people hospitalised with a recent Covid-19 diagnosis will be in the hospital setting because of this infection. It is important to be able to differentiate between patients in hospital who are admitted to hospital ‘because of’ their Covid-19 as opposed to patients who are admitted to hospital for other reasons with a Covid-19 diagnosis incidentally identified through testing. For more information, see the PHS Weekly Report published 6 April 2022.
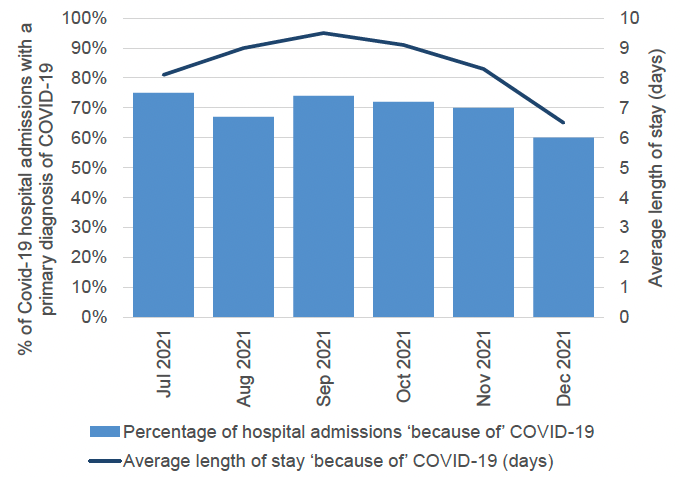
In September 2021, Public Health Scotland developed analysis to calculate the proportion of people in hospital because of Covid-19, based on SMR01 discharge summaries from NHS health boards. A hospital admission 'because of' Covid-19 is defined as an admission where acute Covid-19 illness is recorded as the main reason that the patient required treatment (including reinfections). This data provides valuable information, however, there is typically a two-to-three-month lag in receiving the discharge summaries from NHS health boards.
In November 2021, when the Delta variant of Covid-19 was responsible for nearly all circulating infections in Scotland, 70% of Covid-19 admissions were in hospital 'because of' their Covid-19 infection. This decreased to 60% in December 2021, during the period when Omicron rapidly became the dominant variant. According to this analysis, the average length of time a patient spent in hospital following an admission 'because of' Covid-19 decreased from 8.3 days in November 2021, to 6.5 Days in December 2021 (Figure 11). The age groups that had a longer-than-average length of stay in December 2021 were those aged 55 to 59, and those aged 65 and older[56].
While it may be helpful to compare hospital occupancy and admissions between the UK nations, any comparisons must be made with caution. Definitions are not consistent across the nations and data are not reported daily by each nation. Data from Scotland, Wales and Northern Ireland is updated retrospectively if errors come to light, while data from England is not revised retrospectively, but instead is corrected in the following day's data update. This means Covid-19 hospital occupancy and admissions figures are not directly comparable across the four nations. For more information see UK Government dashboard.
The seven-day average hospital occupancy in Scotland per one million people was 411 in the week to 11 April 2022. This is a decrease by 5% compared to the previous week to 4 April 2022. The seven-day average hospital occupancy per one million in the same period for other UK nations were as follows[58]:
- England: 289 per one million (an increase of 3% compared to the previous week),
- Northern Ireland: 261 per one million (a decrease of 21% compared to the previous week),
- Wales: 309 per one million (a decrease of 5% compared to the previous week).
Due to revisions to the hospital admissions data mentioned above (page 15), we have removed the four nations comparisons in this week's publication. We will continue to monitor the data to see when it is appropriate to reintroduce this analysis.
Deaths
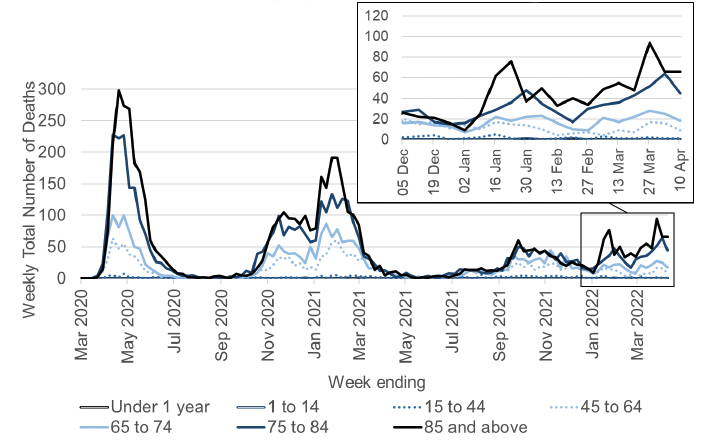
There were 139 deaths where Covid-19 was mentioned on the death certificate in the week to 10 April. Out of these, there were 83 deaths where Covid-19 was the underlying cause. The number of deaths where Covid-19 was mentioned on the death certificate decreased by 19%, or 33 deaths, compared to the previous week (172 deaths in the week to 3 April). This figure is 79% lower than the peak in 2020, when the week ending 27 April saw a total of 663 deaths where Covid-19 was mentioned on the death certificate[59]. The number of deaths are higher among those aged 45 and older but are fluctuating on a weekly basis. Covid-19 deaths among younger age groups have remained at low levels throughout the pandemic (Figure 12). National Records of Scotland publish a weekly detailed analysis on deaths involving Covid-19 in Scotland in their weekly report[60].
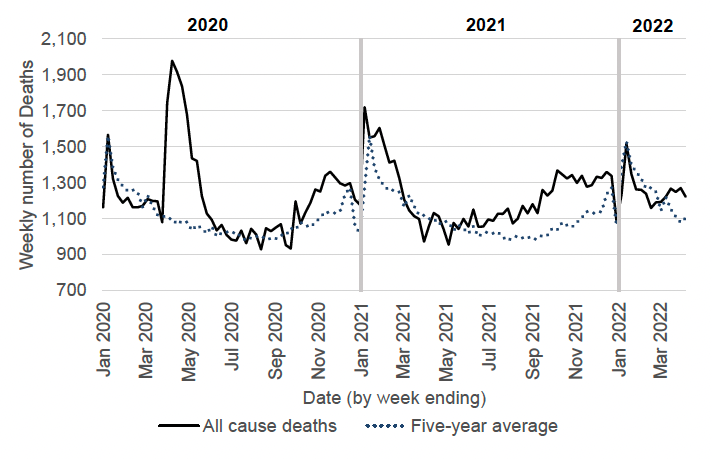
Excess deaths are the total number of deaths registered in a week minus the average number of deaths registered in the same week over the previous five years (excluding 2020). Measuring excess deaths allows us to track seasonal influenza, pandemics and other public health threats. Excess deaths include deaths caused by Covid-19 and those resulting from other causes.
In the week ending 10 April, the total number of deaths registered in Scotland was 1,222. This was 11%, or 120 deaths, above the five-year average for this week (Figure 13)[61] [62]. In the same week, the number of deaths from respiratory diseases (not including Covid-19) were 24 below the previous five-year average for this week, and the number deaths from circulatory diseases were 6 below the average. Deaths from Dementia and Alzheimer's disease were 25 above the previous five-year average for this week, and cancer deaths were 4 above the average. There were 43 excess deaths from other causes[63].
Deaths data from England, Northern Ireland, Scotland and Wales use different methodologies, so they cannot be directly compared. Due to recent and upcoming changes to testing policy across the four nations, we have moved from reporting daily number of people who died within 28 days of being identified as a Covid-19 case by a positive test, to reporting on deaths where Covid-19 was mentioned on the death certificate. This type of reporting is based on death registration, and as such it includes a lag of around two weeks to allow for deaths to be registered. For more information see UK Government website.
There were 2 average daily deaths per one million where Covid-19 was mentioned on the death certificate in the week leading up to 1 April 2022 in Scotland. This compares to 5 weekly deaths per one million in the week to 25 March 2022. In the same time period, seven-day average daily Covid-19 deaths for the other UK nations were as follows[64] [65]:
- England: 2 per one million. This compares to 2 average deaths per one million in the week to 25 March 2022,
- Northern Ireland: 2 per one million. This compares to 2 average deaths per one million in the week to 25 March 2022,
- Wales: 2 per one million. This compares to 3 average deaths per one million in the week to 25 March 2022.