Coronavirus (COVID-19): state of the epidemic - 14 May 2021
This report brings together the different sources of evidence and data about the Covid epidemic to summarise the current situation, why we are at that place, and what is likely to happen next
State of the Epidemic in Scotland – 14th May 2021
Background
This report summarises the current situation on the COVID-19 epidemic in Scotland. It brings together the different sources of evidence and data about the epidemic in Scotland at this point in time, why we are at that place, and what is likely to happen next. This summarises the data up to and including the 13 May 2021 on COVID-19 in Scotland. This updates the previous publication published on 7 May 2021[1]. The information in this document helps the Scottish Government, the health service and the wider public sector respond to the epidemic and put in place what is needed to keep us safe and treat people who have the virus.
This edition of the state of the epidemic summarises current data on COVID-19 at a national level, at a local level and how Scotland currently compares to the rest of the UK. It looks at the vaccination program in Scotland and the effects which are beginning to be seen from this. Information is provided about variants of concern and what impact these may have. Bringing this information together in one place gives the opportunity to better understand the current state of the epidemic in Scotland.
Key Points
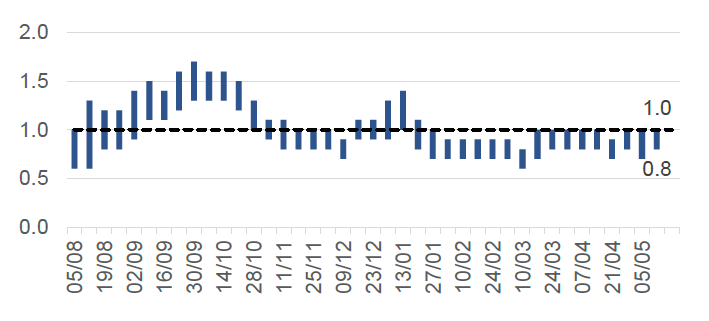
- The reproduction rate R in Scotland is currently estimated as being between 0.8 and 1.0. The lower bound is higher than last week.
- An average of 240 cases were reported per day in the 7 days to 13 May, which is a 46% increase in reported cases since the 6 May.
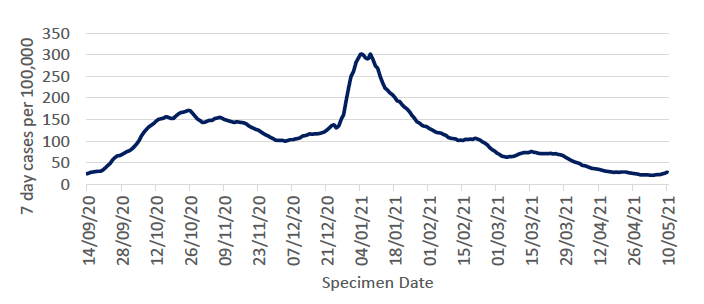
- There were 28 weekly cases per 100,000 in the week to 10 May, which is an increase since last week. This compares to 302 weekly cases per 100,000 on 8 January and is similar to the weekly case rate observed in mid-September.
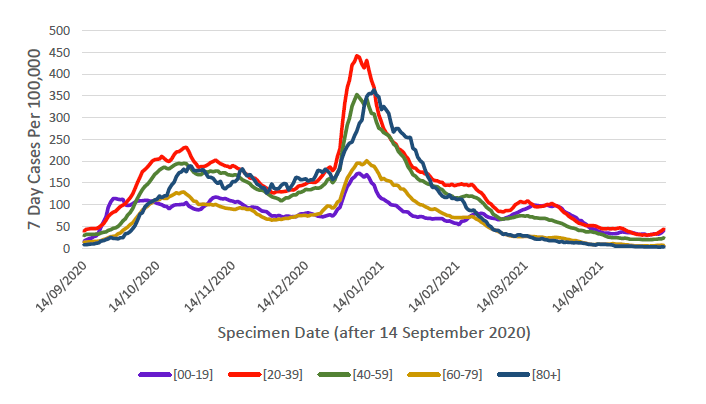
- Case rates saw a rise amongst all age bands with the sharpest increase in those aged 20-39 this week.
- The estimated proportion of people becoming infected with Covid in Scotland has continued to decrease in the most recent week and is currently above England, Wales and Northern Ireland as determined through the latest weekly ONS survey.
- Latest modelled estimates suggest there are currently between 3 and 8 new daily infections per 100,000 people in Scotland.
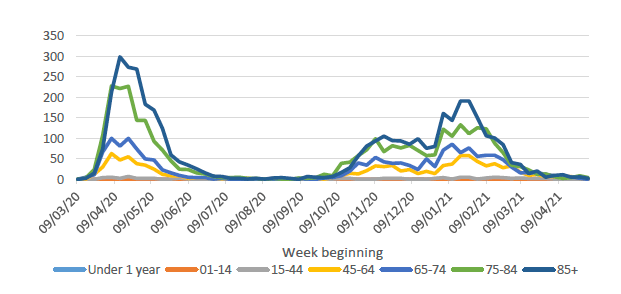
- Deaths involving coronavirus have declined most in those aged 65-74 over the 3 weeks to 9 May, having gone down by 100% (from 4 to 0 deaths). Deaths in those aged 45-64 and 85+ have declined by 86% and 82%, respectively, over the same period. Deaths have increased by 100% (from 2 to 4) in the 75-84 age group in the 3 weeks to 9 May. However, this is normal expected variation when death numbers are very low.
- Average daily deaths per 100,000 population in Scotland (0.01) are in line with England (0.01), and below Northern Ireland (0.02) and Wales (0.03).
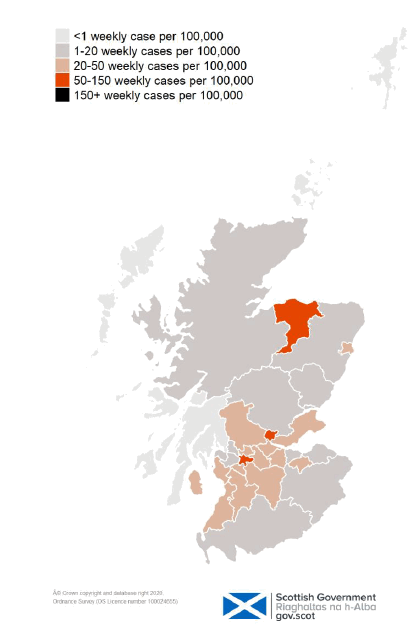
- Moray currently has the highest weekly case rates in Scotland reporting 98 cases per 100,000 in the last week, followed by Glasgow (71 cases per 100,000) and Clackmannanshire (52 cases per 100,000), while Dumfries and Galloway, East Lothian, Highland and Scottish Borders reported fewer than 10 weekly cases per 100,000 each in the same time. Argyll and Bute, Na h-Eileanan Siar, Orkney, and Shetland had 0 cases per 100,000 in the last week.
- At a national level hospital bed and ICU occupancy are projected to fall over the next few weeks, but this depends on the future impact of full schools reopening and other relaxations of non-pharmaceutical interventions.
- Over 2.9 million people in Scotland have been given a first vaccine against SARS-CoV-2, and over 1.5 million have now received a second dose.
- During the period covered by this report the current UK variant of concern remains the dominant strain however this dominance is decreasing and the level of other variants is being monitored closely..
Method
This report brings together a wide range of publically available figures from a range of data sources. These include publications by Scottish Government, Public Heath Scotland, National Records of Scotland, Office for National Statistics along with scientific publications and SAGE summaries where appropriate to summarise the state of the epidemic in Scotland in a given week. We also provide information on public attitudes to the virus from weekly YouGov polling surveys.
The national picture
The latest R value for Scotland (published on 13 May)[2] was between 0.8 and 1.0 (Figure 1), with a growth rate of between -3% and 0%.
As Scotland started to move out of national level stay at home measures, an average of 240 cases were reported per day in the 7 days to 13 May. This is a 46% increase from the daily average cases recorded a week earlier to 6 May[3]. Average daily cases reported are now a tenth of the peak of 2,323 in the week to 7 January. Our current position is 28 weekly cases per 100,000 in the week to 10 May[4]. This compares to 302 weekly cases per 100,000 on 8 January (see Figure 2) and is similar to the weekly case rate observed in mid-September 4.
The number of locations where the levels of Covid in wastewater are monitored has increased to 103 sites around Scotland. In contrast to COVID-19 case records, virus shedding into wastewater is a biological process. This means that wastewater data is unaffected by factors that impact whether testing is done. The overall level of wastewater Covid-19 has continued to decline from levels reported last week at a national level. However, in some sites (in particular, Lossiemouth and Alloa) levels were higher this week than last week.
Case rates saw a rise amongst all age bands with the sharpest increase in those aged 20-39 this week (Figure 3).
Not everyone who has the virus will be tested, as many people do not realise they have COVID, or have mild symptoms and do not come forward. Latest modelled estimates suggest there are currently anywhere between 200 and 400 people infected in Scotland each day2. This means that as of 12 May there were between 3 and 8 new daily infections per 100,000 people.
The number of people in hospital with confirmed Covid for less than 28 days is declining. After peaking at 2,053 on 22 January, this figure has decreased and as of 13 May there were 63 patients in hospital with COVID-19. In addition, there was a fall in daily hospital admissions for people with Covid from a peak of 241 on 11January to 9 on 9 May[6].
There were 7 deaths registered where Covid was mentioned on the death certificate in the week to 9 May. This is a 63% decrease on the week before, and 99% lower than the peak in April 2020 (663 deaths). The proportion of deaths in care homes has decreased from 60% in April 2020 to 14% of Covid deaths in the week to 9 May 2021. Deaths involving coronavirus have declined most in those aged 65-74 and have gone down by 100% (from 4 to 0 deaths) in this age group over the 3 weeks to 9 May[7] (Figure 4). Deaths in those aged 45-64 and 85+ have declined by 86% and 82%, respectively, over this period. Deaths have increased by 100% (from 2 to 4) in the 75-84 age group in the 3 weeks to 9 May. However, this is normal expected variation when death numbers are very low.
How Scotland compares with the rest of the UK
The latest ONS survey estimates that the proportion of the population infected in the community in Scotland (0.08% people currently testing positive for Covid-19 from 2-8 May) has continued to decrease in the most recent week. However, this is still above England (0.07%), Wales (0.02%), and Northern Ireland (0.07%). In the week to the 8 May the estimated rate of community infection was 1 in 1,250 people in Scotland, compared to 1 in 1,340 for England, 1 in 4,230 for Wales and 1 in 1,430 for Northern Ireland[8]. Average daily deaths in Scotland (0.01 per 100,000 in the week to 13 May) are in line with England (0.01), and below Northern Ireland (0.02) and Wales (0.03). The Coronavirus Infection Survey estimated that in the week to 25 April, 59.2% of the adult population in Scotland would have tested positive for antibodies against Covid-19, as a result of having the infection in the past or being vaccinated. This compares to 69.3% in England, 63.2% in Wales and 63.5% in Northern Ireland[9].
Situation by local authority within Scotland
Moray currently has the highest case rates in Scotland with 98 weekly cases reported per 100,000 in the week to 10 May, which is a 24% increase from the week to 3 May4. It is followed by Glasgow with 71 weekly cases per 100,000 and Clackmannanshire with 52 weekly cases per 100,000. There are mostly low levels of cases across Scotland, with moderate levels of cases observed across the central belt and high case rates seen in Clackmannanshire, Glasgow and Moray (Figure 5). Local authorities that recorded an increase in cases per 100,000 population over the last week include:
- Aberdeen
- Aberdeenshire
- Angus
- Clackmannanshire
- Dundee
- East Lothian
- East Renfrewshire
- Glasgow
- Inverclyde
- Midlothian
- Moray
- North Ayrshire
- North Lanarkshire
- Perth and Kinross
- Renfrewshire
- South Ayrshire
- South Lanarkshire and
- Stirling.
Dumfries and Galloway, East Lothian, Highland and Scottish Borders each had fewer than 10 weekly cases per 100,000 in the week to 10 May. Argyll and Bute, Na h-Eileanan Siar, Orkney and Shetland had 0 cases per 100,000 in the last week4.
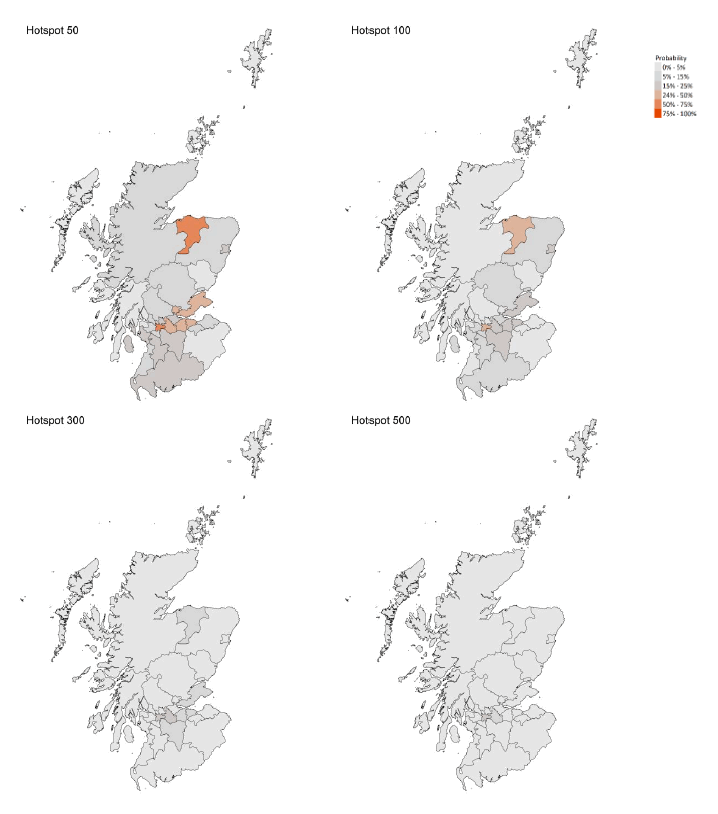
The most recent modelling predicts that for the week ending 29 May, there are no local authorities with at least a 75% probability exceeding 50 cases per 100,000 population (Figure 6)2. Moray and Glasgow are however approaching this 75% probability.
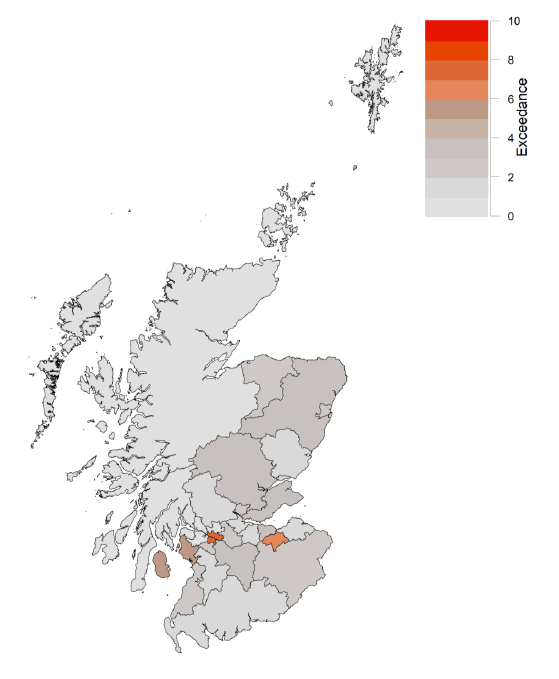
There were also five local authorities that exceeded what would be expected at this stage in the epidemic between 5-11 May. Health Protection Scotland defines exceedance as a greater than expected rate of infection compared with the usual background rate for the place and time where the incident has occurred[10]. Glasgow, Midlothian, North Ayrshire, Perth and Kinross, and South Lanarkshire were areas where transmission exceeded expectations in the week to 11 May (Figure 7)2.
Children and Education
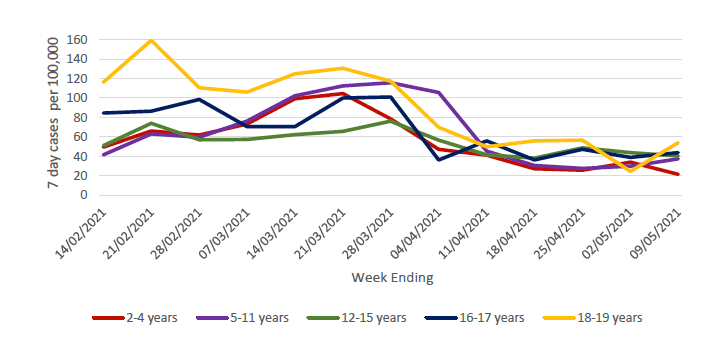
The majority of children and young people had returned to full time education by the 19 April. Over the last week there was a slight increase in the total number of COVID-19 cases in young people, which has gone up from 354 cases in the week to 2 May to 397 cases in the week ending 9 May. 7 day cases per 100,000 have increased in 5-11, 16-17 and 18-19 year olds in the week ending 9 May, and the highest proportion of cases is still observed in those under 12 (194 cases). However, there was a fall in 7 day cases per 100,000 in those aged 2-4 and 12-15 (Figure 8)[11].
The rate of testing increased amongst 2-4, 5-11 and 18-19 year olds, but reduced in the 12-15 and 16-17 year olds in week ending 9 May. Test positivity rates have increased in all age groups except for 2-4 year olds this week12. Overall, the proportion of school, early learning and childcare settings with incidents remains low.
Looking ahead
Changes in patterns of mixing and adherence to restrictions will impact on future case numbers. The Scottish Contact Survey measures times and settings that people mix where they could potentially spread Covid2. From this survey we can say that average contacts have increased by 27% in the last two weeks (comparing surveys pertaining to 15th - 21st April and 29th April - 5th May) with a current level of 4.2 daily contacts. Contacts within the work and leisure settings (other contacts outside of the school, home and work) have increased by 74% and 43%, respectively, in the last two weeks. Over this same period, all age groups have increased their contacts. For those aged between 40 and 69, increases are mainly due to contacts within the work setting. For those aged under 40 and over 69, increases in contacts is linked to a rise of contacts within the other setting (contacts outside of the school, home and work).
Self-reported compliance with the current regulations and guidance has decreased since January but remains at a high level. On 11-12 May, 73% of people reported 'complete' or 'almost complete' compliance[12].
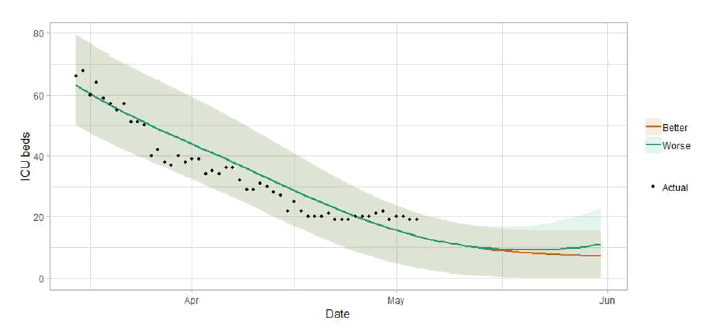
Hospital bed and ICU occupancy are projected to fall over the next few weeks, but this depends on the future impact of full schools reopening and other relaxations of non-pharmaceutical interventions (Figure 92).
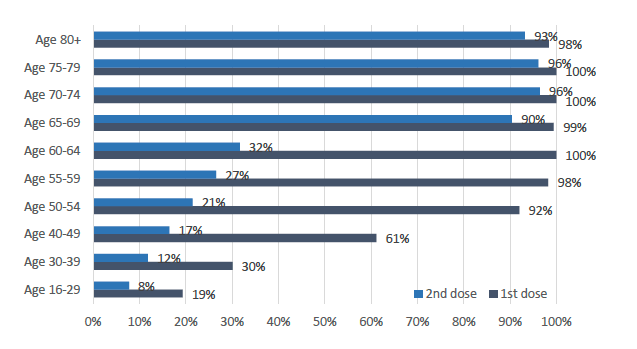
Vaccinations are continuing across the priority groups and 65.4% of the adult population in Scotland has now been vaccinated with the first dose4. The first vaccines were administered on Tuesday 8 of December and 2,968,169 had received their first dose by 13 May 2021, a 4% increase from the 6 May3. By the 13 May over 35,000 residents in care homes had received their first vaccination along with over 53,000 care home staff. In older adult care homes 92.5% of residents have now received their second dose. By age group, almost 100% of individuals aged 55+ and 92% of those aged 50-54 had received their first vaccination (Figure 10). 93% of the over 80s, 96% of those aged 75-79 and 70-74, and 90% of those aged 65-69 have received their second dose. Overall, 1,551,339 (34.2%) of those aged 16 and over had received their second dose by 13 May6. There are now low levels of hospitalisations and deaths among those groups vaccinated first (Figure 4).
The proportion of people surveyed who said they would be likely to be vaccinated for COVID-19 remains high. 60% of all respondents have already received at least their first vaccine dose. Of those not vaccinated, 72% report they are likely to be vaccinated when a vaccine becomes available to them[14].
How the virus is changing
The variant of the virus commonly known as the UK variant (VOC-20DEC-01) remains the dominant strain in Scotland[15]. This new variant of Covid is more transmissible[16]. It is likely that infection with this variant is associated with an increased risk of hospitalisation and death compared to infection with non-VOC viruses[17].
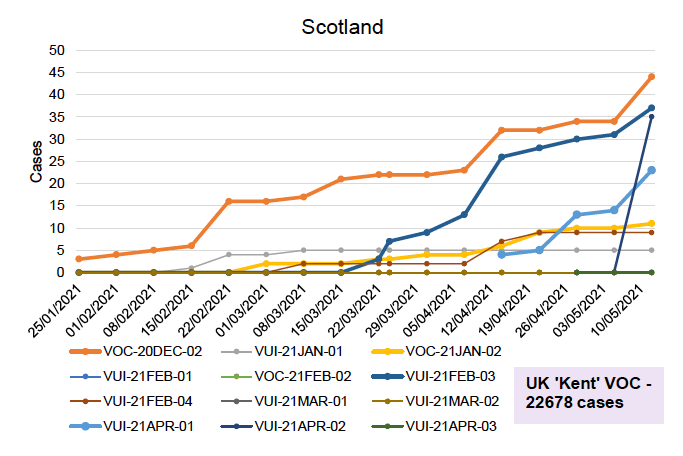
Other variants of concern (VOCs) are being monitored by sequencing of SARS-CoV-2 samples (Figure 10). To date there are five VOCs and eight variants under investigation[18]. Up to 12 May, there have been 44 genomically confirmed cases of the variant VOC-20DEC-02 (first seen in South Africa) detected in Scotland. There have been 11 confirmed cases of the variant VOC-21JAN-02 (first identified from Brazil). There have also been a number of cases of other variants, which are currently under investigation, including 37 cases of VUI-21FEB-03 (first seen in Nigeria) (up 6 from last week) and 23 cases of VUI-21APR-01 (first identified in India), an increase of 9 in the past week. There have been 35 cases of VOC-21APR-02 (first identified in India), an increase of 35 from last week. There is some concern, that some of these new variants may partially escape immunity, from both natural infection and from vaccines currently being deployed, and we are monitoring the evidence on this[19],[20],[21].
Next steps
The Scottish Government continues to work closely with Public Health Scotland to monitor the course of the epidemic using several data sources. Each week this report will provide an overview of current COVID-19 situation in Scotland. This will include real time data on case rates, hospitalisations and deaths and how Scotland's figures compare to those from the rest of the UK. Modelling can tell us where the epidemic is likely to be heading. Local data and data by age group can highlight where problem arise, which can help in addressing some of these issues. In the coming weeks the roll out of the vaccine will continue to be monitored along with the impact of this on case rates and deaths among different age cohorts. Investigations are ongoing by NERVTAG, SPI-M, SAGE, Public Health England and Public Health Scotland regarding the impact of new variants and of vaccination, this will be reflected here as work is undertaken.