Coronavirus (COVID-19): modelling the epidemic (Issue No.97)
Latest findings in modelling the COVID-19 epidemic in Scotland, both in terms of the spread of the disease through the population (epidemiological modelling) and of the demands it will place on the system, for example in terms of health care requirement.
Coronavirus (Covid-19): modelling the epidemic in Scotland (Issue No. 97)
Background
This is a report on the Scottish Government modelling of the spread and level of Covid-19 in Scotland. This updates the previous publication on modelling of Covid-19 in Scotland published on 31st March 2022. The estimates in this document help the Scottish Government, the health service and the wider public sector plan and put into place what is needed to keep us safe and treat people who have the virus.
This edition of the research findings focuses on the epidemic as a whole, looking at estimates of R, growth rate and incidence as well as local measures of change in the epidemic.
Following a consultation, UKHSA has introduced a change in the frequency of the Covid-19 consensus (e.g. the estimates of R, growth and incidence where available), to every two weeks. This will also affect the frequency of medium term projections. This publication has therefore moved to this two week frequency. The next Modelling the Epidemic reports will be published on 28th April and 12th May.
Key Points
- The reproduction rate R in Scotland is currently estimated as being between 0.8 and 1.0, as at 29th March 2022. The lower and upper limits have both decreased since last publication.
- The daily growth rate for Scotland is currently estimated as between ‑4% and 0% as at 29th March. The lower and upper limits have both decreased since last publication.
- The number of new daily infections for Scotland is estimated as being between 348 and 1032 as at 29th March, per 100,000 people.
- Average contacts from the most recent Panel A cohort of the Scottish Contact Survey (week ending 6th April) indicate an average of 4.9 contacts. This has increased by 19% compared to the previous Panel A of the survey (week ending 23rd March).
- Mean contacts within the work setting have increased in the last two weeks by 55%. Contacts within the home setting and other setting (contacts outside home, school and work) have remained at a similar level.
- Individuals within the 30-69 age groups have reported an increase in contacts within the last two weeks, by at least 13%. Those within the youngest (18-29) and oldest (70+) age groups have decreased their contacts in the last two weeks, with those aged 18-29 decreasing the most, by 22%.
- The biggest increase in interactions is between those aged under 18 and the 30-39 age group.
- The majority of locations have shown an increase in visits in the last two weeks. The largest increase has been in individuals attending an outside event, increasing from 61% to 69% in the last two weeks.
- The number of people wearing a face covering where they have at least one contact outside of the home has decreased in the last two weeks from 84% to 81%.
- Approximately 77% of individuals had taken at least one lateral flow test within the last 7 days for the survey pertaining to the 31st March - 6th April, decreasing from 80% two weeks prior.
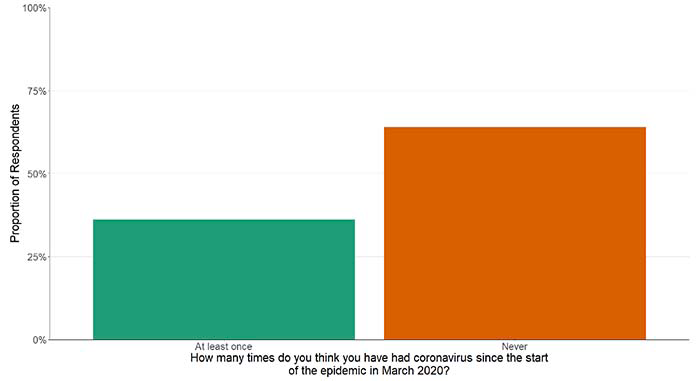
- Approximately 36% of individuals believe they have had Covid-19 at least once since March 2020. Of those who think they have had Covid-19, 84% have had this confirmed through a test.
- The future trajectory of infections, hospitalisations, hospital occupancy and deaths is still uncertain.
- Analysis by the Edinburgh University Roslin Institute indicates that there remains a substantial variation in geographical risk of infection when considering the average recorded census age and booster vaccination uptake.
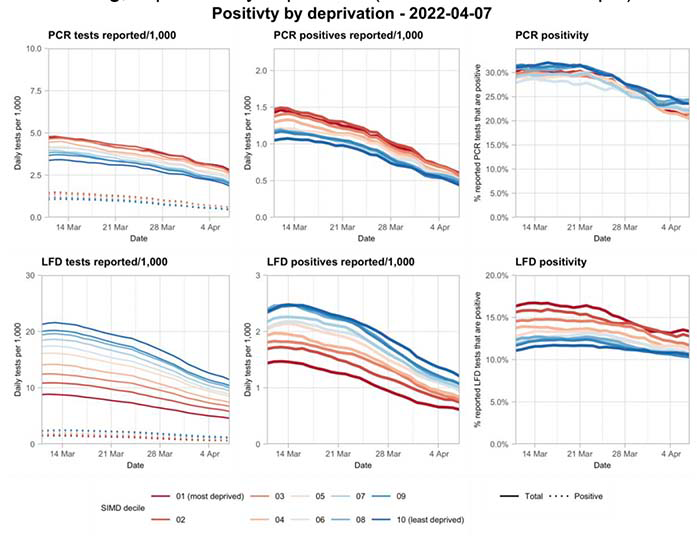
- There is evidence that case ascertainment is declining, with the number of tests taken decreasing as well as positives reported, however positivity is declining.
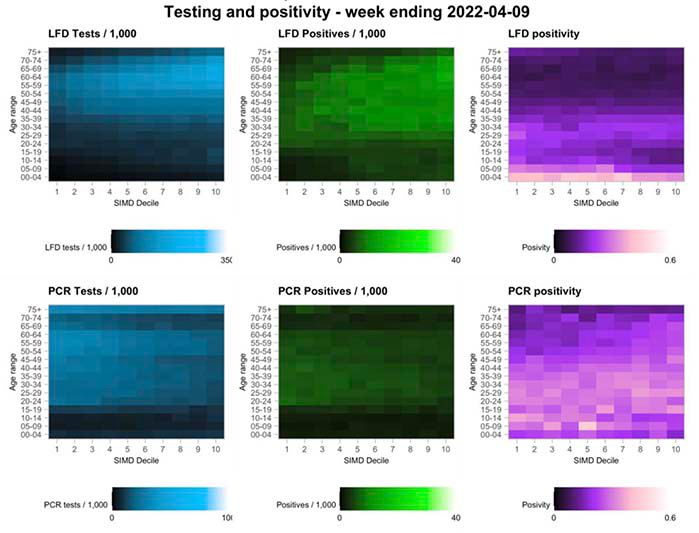
- The distribution of lateral flow/LFD tests being reported continues to vary substantially by both age and deprivation status, with many fewer tests reported in younger adults across all deciles of deprivation, and for children in more deprived deciles. The high level of LFD positivity in the latter category is marked, and when compared to the high number of positives amongst the least deprived, consistent with under ascertainment being concentrated in particular groups.
- Overall, there has been a decline in nationwide wastewater SARS-CoV-2 RNA over the last two weeks. The week ending on 12th April saw levels of around 240 million gene copies per person per day (Mgc/p/d), a decrease from 296 Mgc/p/d two weeks ago (week ending 29th March). However, there has been a slight rise in SARS-CoV-2 RNA levels in the last week of data available.
Overview of Scottish Government Modelling
Modelling outputs are provided here on the current epidemic in Scotland as a whole, based on a range of methods. Because it takes a little over three weeks on average for a person who catches SARS-CoV-2 the causative agent of Covid-19 to show symptoms, become sick, and either die or recover, there is a time lag in what our model can tell us about any change in the epidemic.
This week the Scottish Government presented two outputs to EMRG. The first uses wastewater derived data. The second uses data from our agent-based model[1]. These outputs are included in Figure 1.
The R value and growth rates are estimated by several independent modelling groups based in universities and the UKHSA. Estimates are considered, discussed and combined at the Epidemiology Modelling Review Group (EMRG), which sits within the UKHSA. These are based on data to 11th April.
UKHSA's consensus view across these methods was that the value of R in Scotland is between 0.8 and 1.0, as of 29th March 2022[2] (Figure 1). The lower and upper limits have both decreased last publication. R is an indicator that lags by two to three weeks.
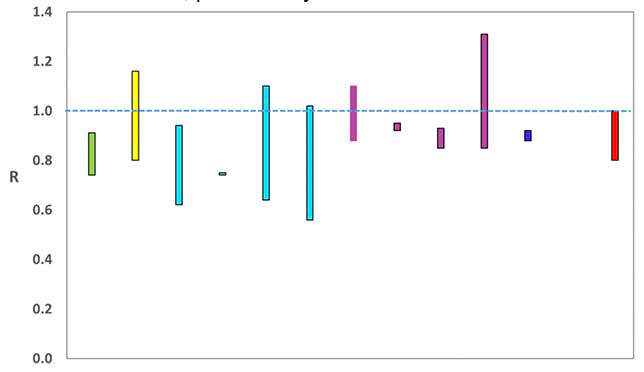
Source: EMRG
The consensus from UKHSA for this week is that the growth rate in Scotland is between -4% and 0% per day as at 29th March. The lower and upper limits have decreased since last publication.
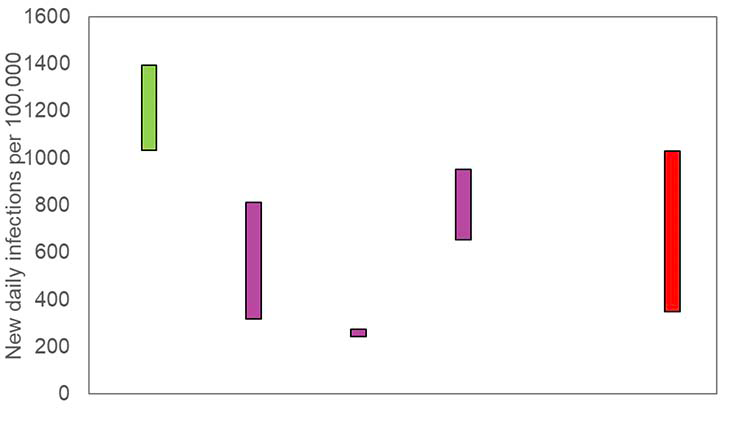
The various groups which report to the EMRG use different sources of data in their models to produce estimates of incidence (Figure 2). UKHSA's consensus view across these methods, as at 29th March, was that the incidence of new daily infections in Scotland was between 348 and 1032 new infections per 100,000. This equates to between 19,000 and 56,400 people becoming infected each day in Scotland.
What we know about how people's contact patterns have changed
Following the change in publication frequency to fortnightly, panels A and B of the Scottish Contact Survey have been merged and surveys will now be run fortnightly. There will be a short transition period where only Panel A survey results will be presented. Analysis of the merged panels will be reported in a future report accompanied by a note in the Technical Annex to explain the changes.
Average contacts from the most recent Panel A cohort of the Scottish Contact Survey (week ending 6th April) indicate an average of 4.9 contacts. This has increased by 19% compared to the previous Panel A of the survey (week ending 23rd March), as seen in Figure 3.
Mean contacts within the work setting have increased in the last two weeks by 55%. Contacts within the home setting and other setting (contacts outside home, school and work) have remained at a similar level.
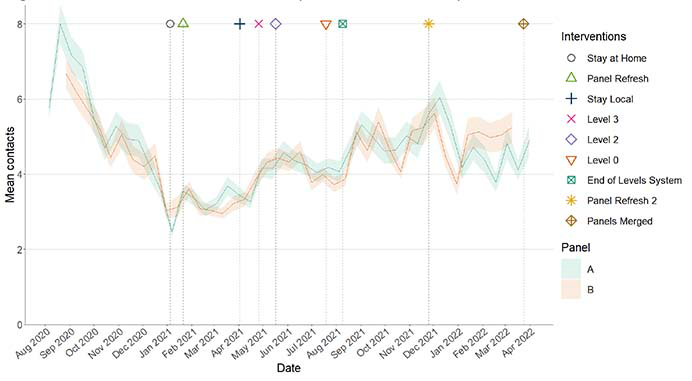
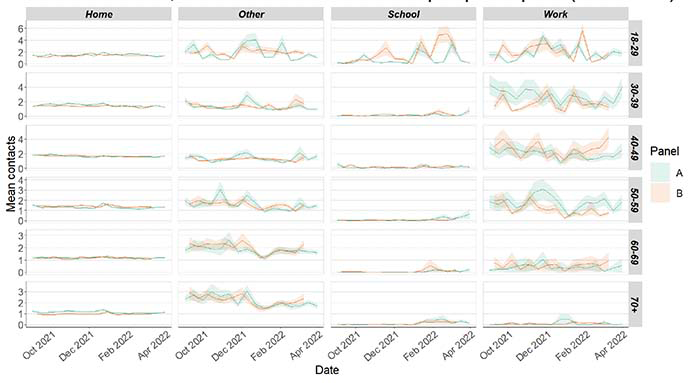
Figure 4 shows how contacts change across age group and setting. Individuals within the 30-69 age groups have reported an increase in contacts within the last two weeks, by at least 13%. Those within the youngest (18-29) and oldest (70+) age groups have decreased their contacts in the last two weeks, with those aged 18-29 decreasing the most, by 22%.
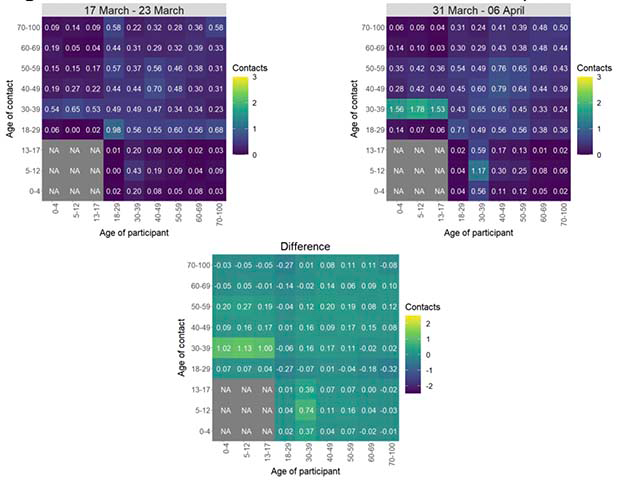
The heatmaps in Figure 5 show the mean overall contacts between age groups for the weeks relating to 17th March - 23rd March and 31st March - 6th April and the difference between these periods. The biggest increase in interactions is between those aged under 18 and the 30-39 age group.
The majority of locations have shown an increase in visits in the last two weeks. The largest increase has been in individuals attending an outside event, increasing from 61% to 69% in the last two weeks as shown in Figure 6.
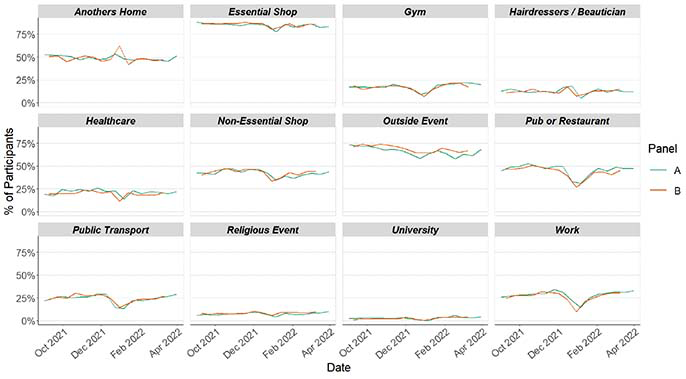
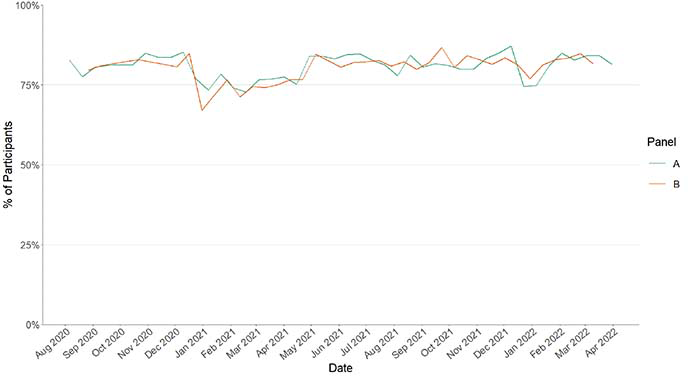
Figure 7 shows the number of people wearing a face covering where they have at least one contact outside of the home. This has decreased in the last two weeks from 84% to 81%.
Approximately 77% of individuals had taken at least one lateral flow test within the last 7 days for the survey pertaining to the 31st March - 6th April, decreasing from 80% two weeks prior as shown in Figure 8.
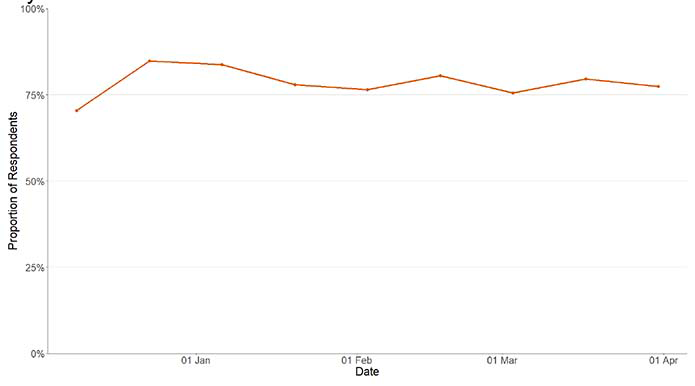
Figure 9 shows that approximately 36% of individuals believe they have had Covid-19 at least once since March 2020. Of those who think they have had Covid-19, 84% have had this confirmed through a test.
What the modelling tells us about estimated infections and hospitalisations
The Scottish Government assesses the potential impact of Covid-19 on the NHS in the next few weeks. Figures 10 - 12 show projections over four weeks.
These projections include the effect of vaccines rolled out so far and projected future vaccine rollout including the rollout of fourth doses. Current vaccine effectiveness within the modelling is derived from Public Health England's most recent vaccine surveillance report[4]. This report provides an indication of the initial effectiveness of the different vaccine products used within Scotland and how this effectiveness reduces over time since the vaccination was administered. Initial effectiveness of natural immunity is assumed to be halfway between initial effectiveness of Moderna and 100%[5] and wanes to 67% after 1-2 years[6].
The infection curves estimates shown in Figure 10 use the incidence outputs from our wastewater Epidemia modelling (as shown in Figure 2) instead of using testing data adjusted for ascertainment that we have used in previous iterations of the modelling. While the number of confirmed positive daily tests has remained relatively stable in recent weeks, hospital occupancy, wastewater data, and the ONS Covid Infection survey[7] have all shown considerable increases in recent weeks followed by a decline. To account for the discrepancy between positive daily test data trends and the trend seen in the other measures we have applied a range to our case ascertainment to convert from confirmed positive daily tests to an estimate of actual infection numbers. This case ascertainment range has typically been 25%-100% of total infections being captured by the testing regime. However, in recent weeks with the increases in other measures not being reflected in the confirmed positive daily tests, this would suggest that the ascertainment rate has been decreasing to very low levels. This, coupled with the forthcoming changes to the testing regime in Scotland which are likely to further affect the confirmed positive daily tests, mean that we believe that using the wastewater derived data represents our best estimate for current infection levels in Scotland and we have therefore used it in our modelling this week. Using this data source instead does give us a higher number of infections than previously forecast given the high levels of Covid-19 within the wastewater in recent weeks. We will evaluate how these forecasts perform and revise the modelling as we get new information.
'Central' assumes that transmissibility remains at current levels. This transmissibility is estimated by calculating the current rates of transmission based on the most recent available incidence data from our wastewater Epidemia modelling (as shown in Figure 2) and then projecting this forward at similar levels over the coming weeks. 'Worse' assumes a higher transmissibility, whereas 'Better' assumes a lower transmissibility.
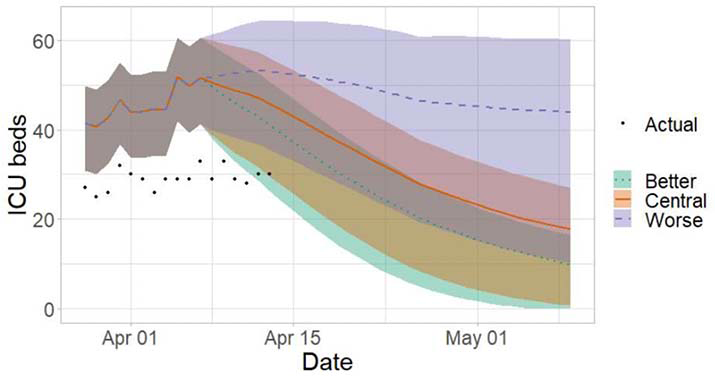
These projections include the changes to restrictions announced on 15th March but do not include the announcement on 13th April on the end of the legal requirement for wearing face masks. The changes to restrictions are assumed to result in people's behaviour gradually returning towards pre-pandemic levels over the coming weeks and months; as the impact of this becomes clearer we will revise the modelling. From these transmissibility assumptions we produce the infections curves shown in Figure 10. Changes in transmissibility represent changes in behaviour. The lower transmissibility in 'Better' assumes people behave more cautiously than they do at the moment, while the higher transmissibility in 'Worse' assumes people behave less cautiously. Assumptions around hospitalisation/ICU rates by age and vaccination status and then applying some assumptions around length of stay as derived by matching the numbers calculated from infections to current data are then used to estimate the occupancy for hospital and ICU as shown in Figures 11 and 12 respectively.
These projections using wastewater derived data to 29th March were within the UKHSA consensus estimates for medium term projections. Hence these represent our best estimate of the future trajectory of Covid-19 in Scotland.
The future trajectory of infections is uncertain especially given the change in the methodology to use wastewater Epidemia as the data source for estimating infections.
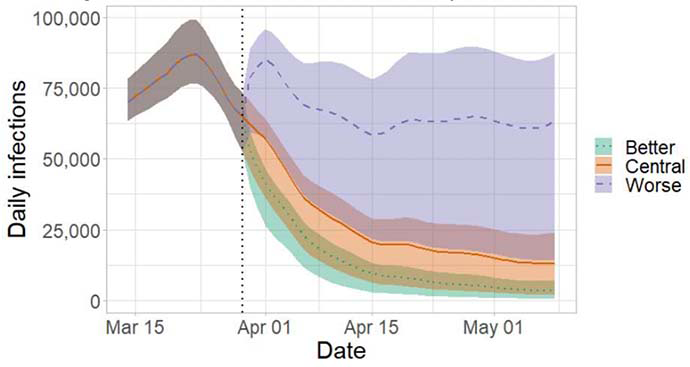
We estimate that daily infections may be up to 90,000 in early May.
Figure 11 shows the impact of the projections on the number of people in hospital. The modelling includes all hospital stays, whereas the actuals only include stays up to 28 days duration that are linked to Covid-19.
There continues to be uncertainty over hospital occupancy and intensive care in the next four weeks.
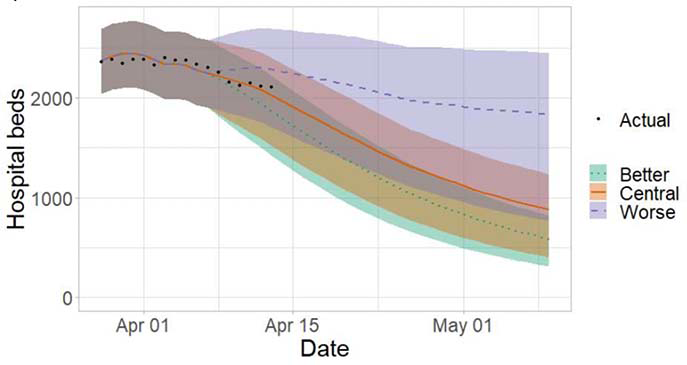
We estimate that hospital occupancy may be up to 2,500 in early May.
Figure 12 shows the impact of the projection on ICU bed demand.
What the modelling tells us about projections of hospitalisations, occupancy and deaths in the medium term
SPI-M-O produces projections of the epidemic (Figures 13 - 15), combining estimates from several independent models. These projections are not forecasts or predictions. They represent a scenario in which the trajectory of the epidemic continues to follow the trends that were seen in the data available to 11th April and do not include the effects of any future policy or behavioural changes. The delay between infection, developing symptoms, the need for hospital care, and death means they cannot fully reflect the impact of behaviour changes in the two to three weeks prior to 11th April. The projections include the potential impact of vaccinations over the next few weeks. Modelling groups have used their expert judgement and evidence from UKHSA, Scottish Universities & Public Health Scotland, and other published efficacy studies when making assumptions about vaccine effectiveness.
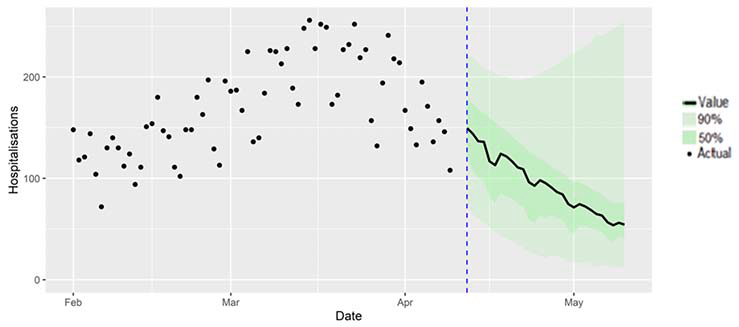
Figure 14 shows the SPI-M-O consensus on hospital occupancy. Hospital occupancy is determined by the combination of admissions and length of stay, the latter of which is difficult to model with confidence.
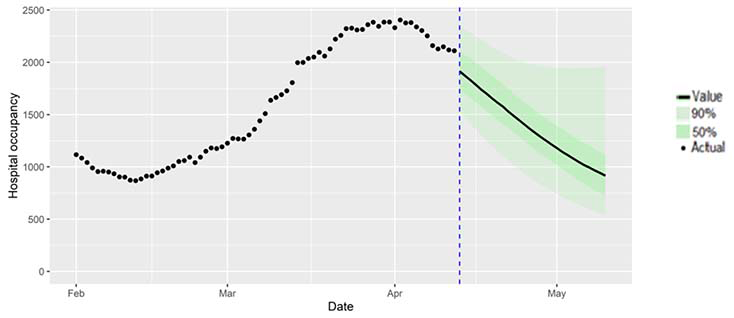
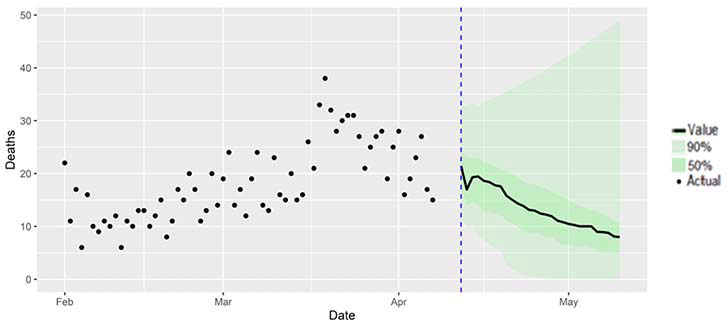
Figure 15 shows the SPI-M-O consensus on daily Covid-19 deaths.
Summary of spatial analysis of Covid-19 spread in Scotland
Researchers at the Edinburgh Roslin Institute have conducted spatial analysis of Covid-19 Spread in Scotland. A summary of findings from the week from 26th March to 9th April 2022 is included here. Risk factors indicate where the number of cases are higher than expected geographically (i.e. administrative data zones), but do not necessarily represent the risk to individuals in those areas.
Table 1 shows the outcome of a Negative binomial model of risk factors by data zone. eDRIS[8] data was taken on 11th April, covering the period from 26th March to 9th April.
Table 1. Results of a negative binomial risk model for infection, considering risk in data zones (DZs)[9] aggregated at the local authority level[10].
| Risk factor | DZ Range (5%-95%) | % Change in cases from mean at 5% | % Change in cases from mean at 95% | |
|---|---|---|---|---|
| Log(population) | 6.22-7.0 | 66.6% | 146.4% | |
| Deprivation | SIMD score | 4.14 – 56.3 | 100.2% | 99.7% |
| SIMD housing | 1.17 – 63.7 | 99.29% | 101.7% | |
| SIMD access | 1.16 – 61.8 | 103.4% | 93.3% | |
| Vaccine uptake | % First vaccine uptake | 76.6 – 107.3 | 89.1% | 109.3% |
| % Second vaccine uptake | 93.5 – 97.0 | 101.2% | 99.1% | |
| % Booster uptake | 77.1 – 89.7 | 83.9% | 114.8% | |
| Mean age | 33.3 – 50.0 | 115.0% | 87.8% |
There remains a substantial variation in risk of infection by average census age in each datazone. Deprivation in this period is not a substantial factor when comparing across local authorities. Risk factors remain stable, when comparing to previous weeks.
The trend where numbers of PCR and LFD tests are both declining continues across all deprivation scores. However in contrast with previous falls in testing numbers, positivity is also falling.
The distribution of lateral flow/LFD tests being reported varies substantially by both age and deprivation status, with many fewer tests reported in younger adults across all deciles of deprivation, and for children in more deprived deciles. The high level of LFD positivity in the latter category is marked, and when compared to the high number of positives amongst the least deprived, suggests that ascertainment may be lower in younger people in deprived areas.
What can analysis of wastewater samples tell us about local outbreaks of Covid-19 infection?
Levels of SARS-CoV-2 RNA in wastewater (WW) collected at a number of sites around Scotland are adjusted for population and local changes in intake flow rate (or ammonia levels where flow is not available). See Technical Annex in Issue 34 of these Research Findings for the methodology. These reports are based on the most recent data available. Future updates to data may lead to small retrospective changes.
Nationwide, wastewater SARS-CoV-2 RNA levels have overall declined over the last two weeks. The week ending on 12th April saw levels of around 240 million gene copies per person per day (Mgc/p/d), a decrease from 296 Mgc/p/d two weeks ago (week ending 29th March). However, there has been a slight rise in Covid-19 levels in the last week of data available.
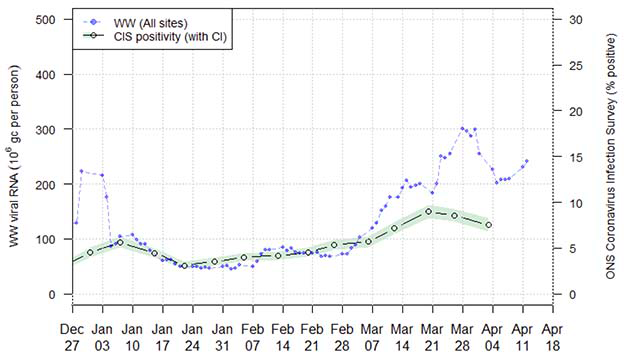
In Figure 18, plotting covers the period from the start of 2022. The Omicron variant emerged in Scotland around mid-December 2021. After the end of 2021, S-gene dropout testing data suggest that nearly all cases are from the Omicron variant. During the period of change in the dominant variant, a change in the relationship between the WW SARS-CoV-2 RNA levels and case numbers was observed and postulated to be due to different levels of virus shed by the two variants. If this assumption is true, and there is no further change in shedding following the emergence of the Omicron variant BA.2, then from early January 2022, WW SARS-CoV-2 RNA levels should have a consistent relationship with the underlying Covid-19 prevalence.
This graph shows that national WW viral levels have fallen since the end of March, reaching around 200 Mgc/p/d in the first week of sampling, followed by a recent increase in the last two days of sampling to around 250 Mgc/p/d. The number of samples analysed during the past week has returned to around 200 samples, after having dropped to a range of 100-150 samples in the previous two weeks. More importantly, from this week onwards, SEPA is replacing their previous manual analysis methodology with an automated approach. For this week's data, 9% of the samples collected on 7th April were analysed in this way, and the entire set of samples collected on 8th-12th April (the last days of sampling included in this report) were analysed using the new method. It is as yet unclear whether this change has impacted WW SARS-CoV-2 RNA results.
In Figure 18, we also superimpose data from the ONS Coronavirus Infection Survey (CIS) to 3rd April with axis scaling chosen to match levels of WW Covid-19 and CIS prevalence during January and February 2022. Note that this scaling is not the same as that used in reports prior to 1 January 2022, where a scaling based on 2021 data was used. In this comparison, while both WW viral levels and CIS positivity have decreased, the peak in WW viral levels appears to have taken place after the peak in CIS positivity estimates.
Long Covid
A report on the rate of long Covid has not been included this week. We will report the long Covid projections again once updated estimates of self-reported long Covid prevalence amongst those infected with the less severe Omicron variant become available.
Local Authority case projections
We are not publishing projections of the number of cases per 100,000 population this week. This analysis indicated which local authorities are likely to experience high levels of Covid-19 in two weeks' time. As a result of changes to widespread population testing the projections of numbers of positive tests are now much less useful for tracking the progression of the disease in Scotland.
What next?
We hope to include our analysis on long Covid in future weeks.
This publication has moved to a two week frequency. The next Modelling the Epidemic reports will be published on 28th April and 12th May.
Archiving of models is currently being undertaken via the Data Science Scotland GitHub organisation. Details of the Scottish Contact Survey, Wastewater and Exceedance models are currently available. More models will be added over the coming weeks - see the Technical Annex of issue 96 for further details.