Coronavirus (COVID-19): modelling the epidemic (issue no.92)
Latest findings in modelling the COVID-19 epidemic in Scotland, both in terms of the spread of the disease through the population (epidemiological modelling) and of the demands it will place on the system, for example in terms of health care requirement.
Coronavirus (Covid-19): modelling the epidemic in Scotland (Issue No. 92)
Background
This is a report on the Scottish Government modelling of the spread and level of Covid-19 in Scotland. This updates the previous publication on modelling of Covid-19 in Scotland published on 24th February 2022. The estimates in this document help the Scottish Government, the health service and the wider public sector plan and put into place what is needed to keep us safe and treat people who have the virus.
This edition of the research findings focuses on the epidemic as a whole, looking at estimates of R, growth rate and incidence as well as local measures of change in the epidemic.
Key Points
- The reproduction rate R in Scotland is currently estimated as being between 0.9 and 1.1, as at 15th February 2022. This is unchanged since last week.
- The daily growth rate for Scotland is currently estimated as between ‑1 and 2% as at 15th February. The lower and upper limits have increased since last week.
- The number of new daily infections for Scotland is estimated as being between 246 and 526 as at 15th February, per 100,000 people.
- Average contacts from the most recent Panel A cohort of the Scottish Contact Survey (week ending 23rd February) indicate an average of 3.8 contacts. This has decreased by 14% compared to the previous Panel A of the survey (week ending 9th February).
- Mean contacts within the other setting (contacts outside home, school and work) have decreased by 34% within the last two weeks. Contacts within the home and work have remained at a similar levels over the same period.
- Those within the 18-39 age groups have reported the biggest decrease in contacts, by at least 26%. This was largely driven by a reduction in contacts in the other setting for those in the 18-29 age group and in the work setting for those within the 30-39 age group.
- The biggest decrease in interactions between age groups is between those aged 18-29 with each other.
- Visits to a non-essential shop have shown the biggest increase, increasing from approximately 36% to 40% while visits to an outdoor event have shown the biggest decrease, decreasing from 64% to 58% in the last two weeks.
- Of those who have reported visiting a healthcare facility in the last 7 days, the most visited location was the GP by 31%, followed by 21% of individuals attending an outpatient facility.
- The number of people wearing a face covering where they have at least one contact outside of the home has decreased in the last two weeks from 85% to 83%.
- Approximately 26% of individuals believe they have had Covid-19 at least once since March 2020.
- The future trajectory of infections, hospitalisations, hospital occupancy and deaths is still uncertain. We estimate that daily infections could be up to 20,000 in late March.
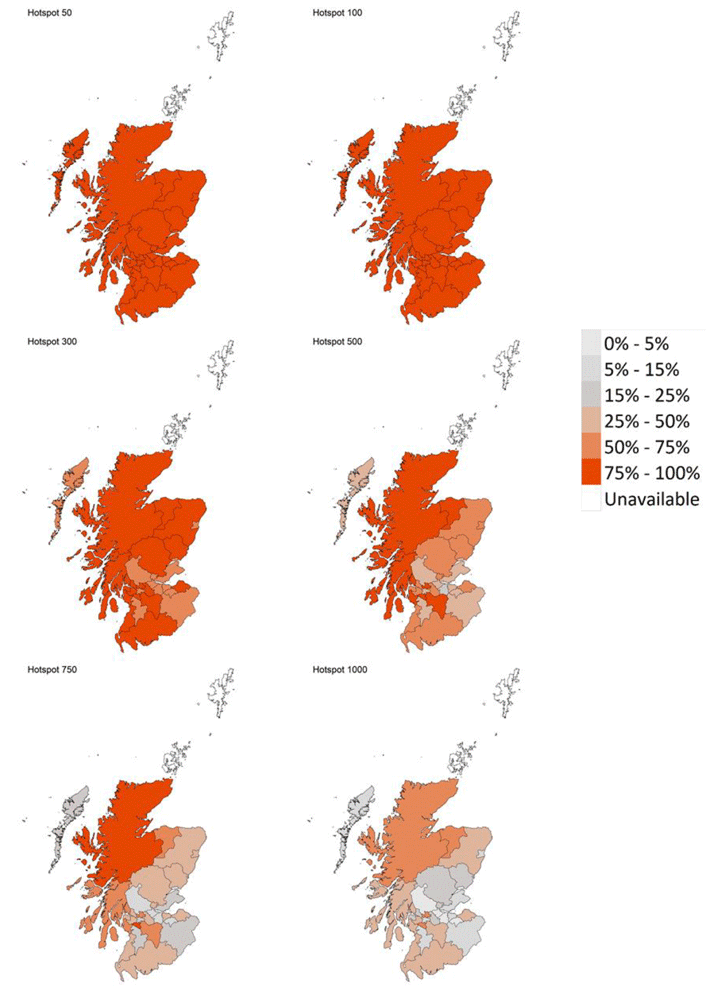
- Modelled rates of positive tests per 100K using data to 28th February indicate that, for the week commencing 13th March, all 30 of the local authorities included are expected to exceed 50 cases per 100K with at least 75% probability. These same 30 local authorities also have at least a 75% probability of exceeding 100 cases per 100K.
- Seven local authorities are expected to exceed 500 cases per 100K with at least 75% probability. These are Argyll & Bute, East Dunbartonshire, East Renfrewshire, Highlands, Moray, North Ayrshire and South Lanarkshire. There are no local authorities which are expected to exceed 1000 cases per 100K with at least 75% probability.
- Analysis indicates that there remains a substantial variation in geographical risk of infection when considering the average recorded census age and booster vaccination uptake in different administrative data zones across Scotland.
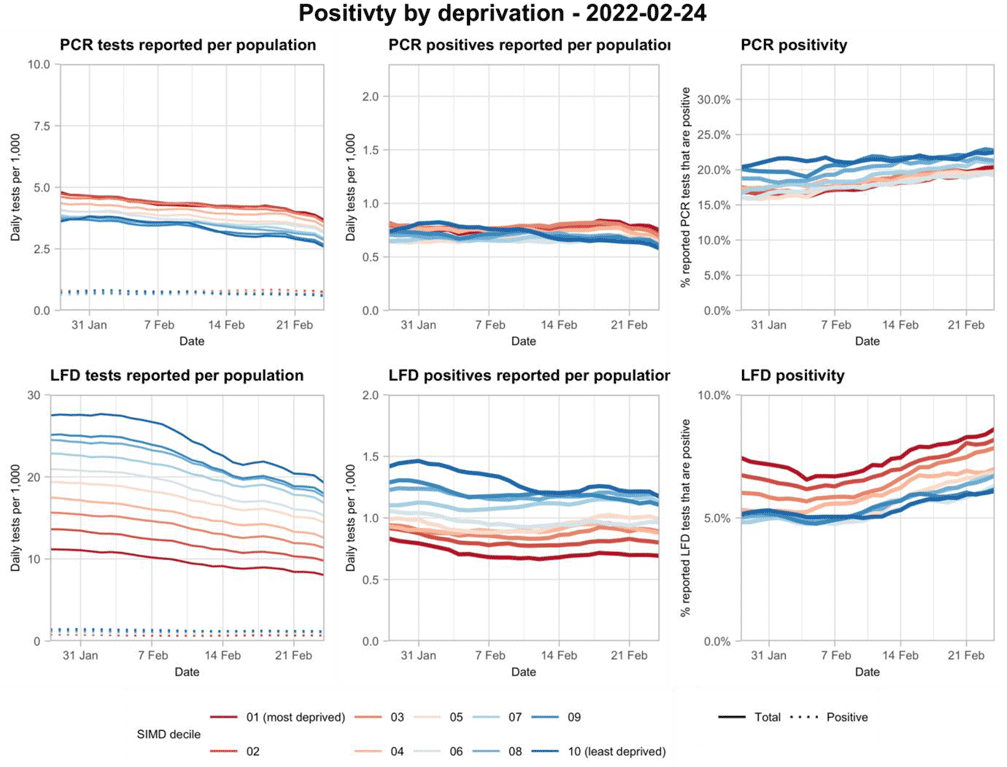
- There is evidence that the number of tests being taken is declining, as positivity is increasing across all deprivation deciles.
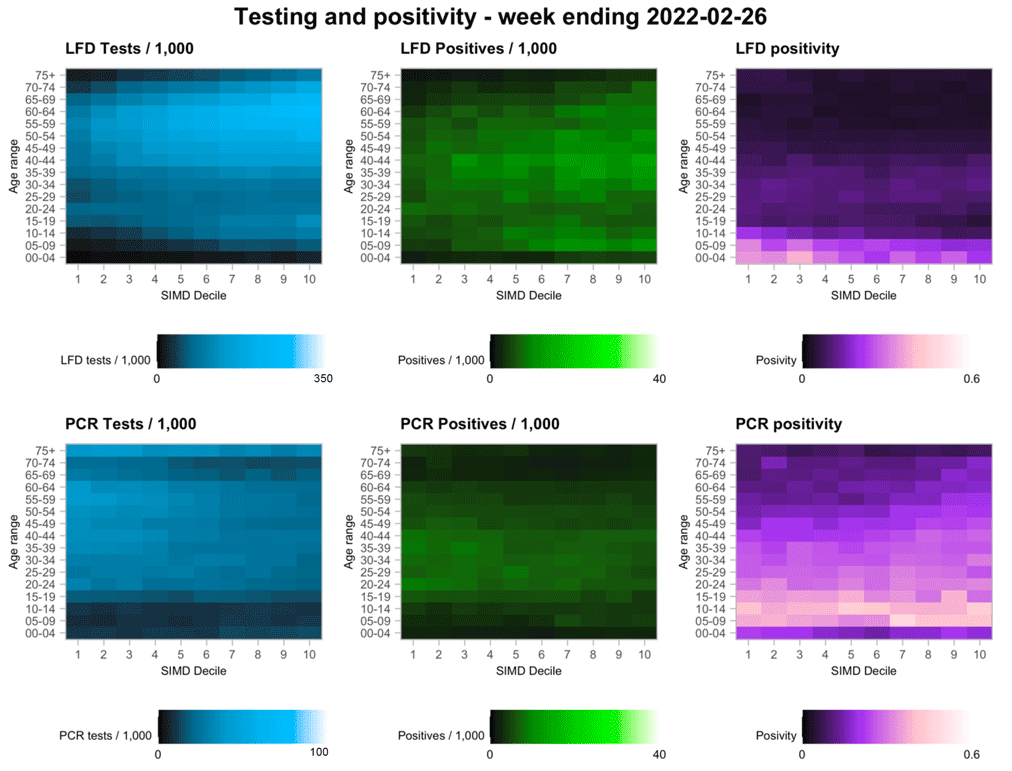
- The distribution of lateral flow/LFD tests being reported continues to vary substantially by both age and deprivation status, with many fewer tests reported in younger adults across all deciles of deprivation, and for children in more deprived deciles. The high level of LFD positivity in the latter category is marked, and when compared to the high number of positives amongst the least deprived, consistent with under ascertainment being concentrated in particular groups.
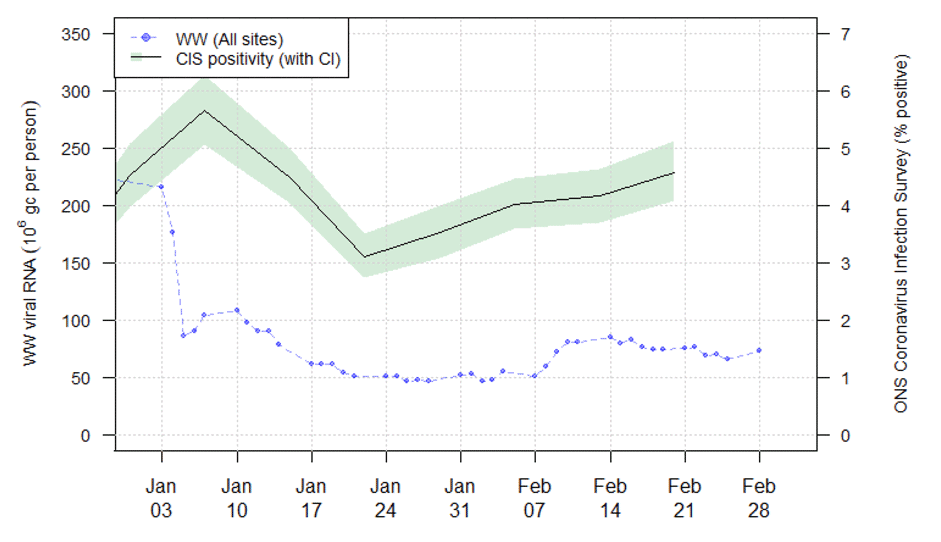
- Nationwide, wastewater Covid-19 RNA levels have been fairly stable without showing any consistent trend in the last three weeks. The week ending on 28th February saw levels of around 64 million gene copies per person per day (Mgc/p/d) compared to 79 Mgc/p/d the previous week.
- Sequencing in six wastewater treatment works with large catchment populations all show the increase in the prevalence of Omicron from near zero to nearly all cases by mid-January 2022. 78% of wastewater sites sampled have detected the Omicron BA.2 variant from 14th to 18th February.
- In this research findings we also include an update to the section looking at what may happen in the future around Covid-19 using a range of plausible scenarios.
Recent cases
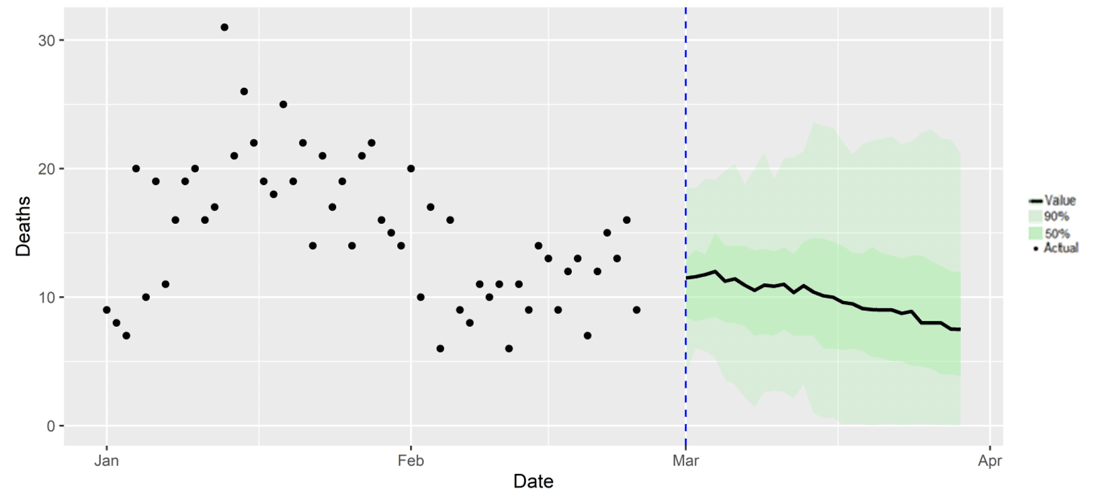
Figure 1 shows the number of Covid-19 cases (from either PCR or LFD) in Scotland between January and March 2022. The vertical dashed lines indicate the cut off points for each of the modelling inputs; after these dates, the number of cases is not incorporated into the outputs.
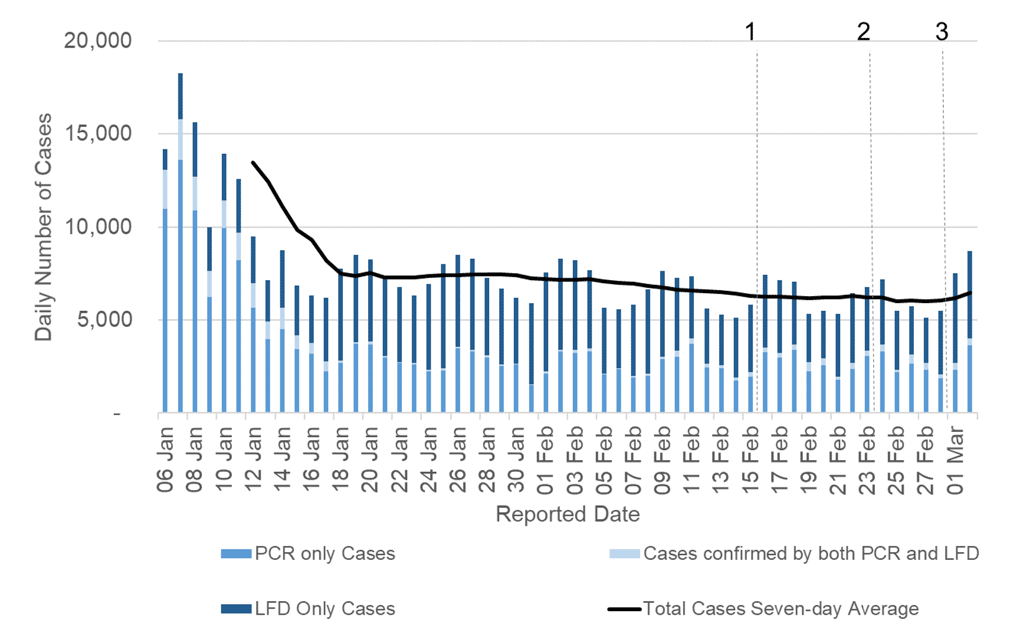
R, growth rate and incidence are as of 15th February 2022 (dashed line 1). The Scottish Contact Survey uses data to 23rd February 2022 (dashed line 2). The Scottish Government modelling of infections and hospitalisations, the modelled rates of positive tests per 100K and the wastewater analysis use data to 28th February (dashed line 3).
Overview of Scottish Government Modelling
Modelling outputs are provided here on the current epidemic in Scotland as a whole, based on a range of methods. Because it takes a little over three weeks on average for a person who catches Covid-19 to show symptoms, become sick, and either die or recover, there is a time lag in what our model can tell us about any change in the epidemic.
This week the Scottish Government presented two outputs to EMRG.
The first uses the number of positive LFD or PCR tests, as published by PHS Scotland. The second uses wastewater data. These outputs are included in Figures 2 and 3.
The R value and growth rates are estimated by several independent modelling groups based in universities and the UKHSA. Estimates are considered, discussed and combined at the Epidemiology Modelling Review Group (EMRG), which sits within the UKHSA. These are based on data to 28th February.
UKHSA's consensus view across these methods was that the value of R in Scotland[2] is between 0.9 and 1.1, as of 15th February 2022[3] (Figure 2). This is unchanged since last week. R is an indicator that lags by two to three weeks.
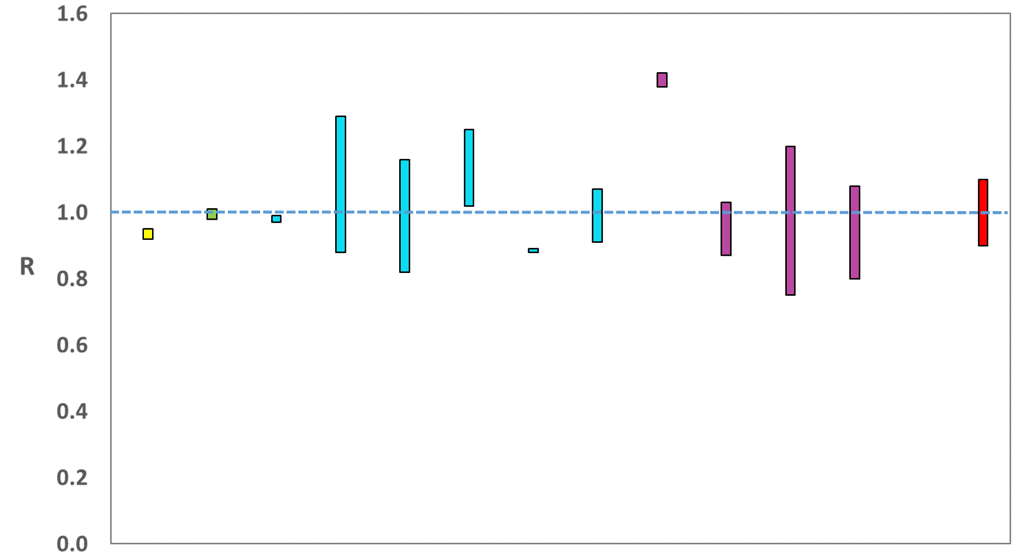
Source: EMRG
The various groups which report to the EMRG use different sources of data in their models to produce estimates of incidence (Figure 3). UKHSA's consensus view across these methods, as at 15th February, was that the incidence of new daily infections in Scotland was between 246 and 526 new infections per 100,000. This equates to between 13,400 and 28,800 people becoming infected each day in Scotland.
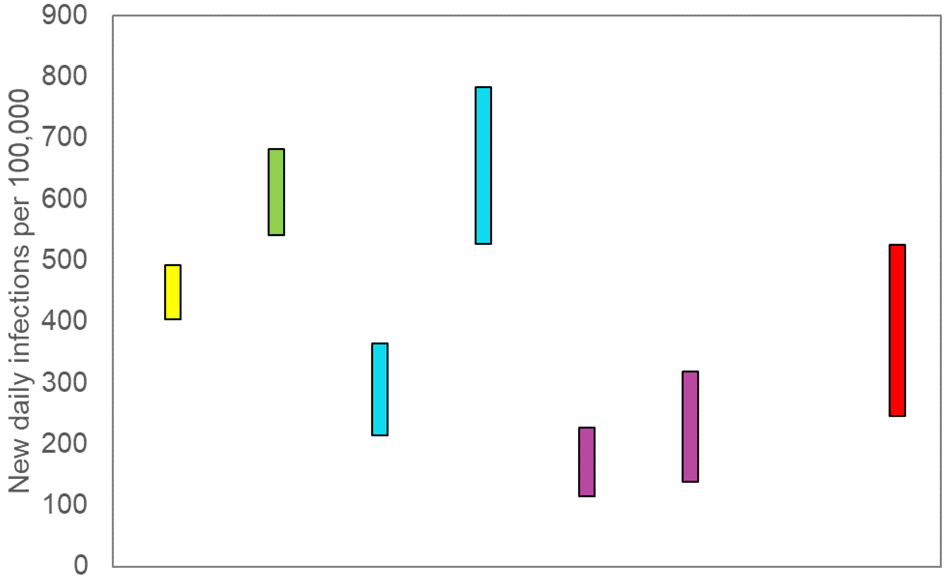
Source: EMRG
The consensus from UKHSA for this week is that the growth rate in Scotland is between -1% and 2% per day as at 15th February. The lower and upper limits have increased since last week.
What we know about how people's contact patterns have changed
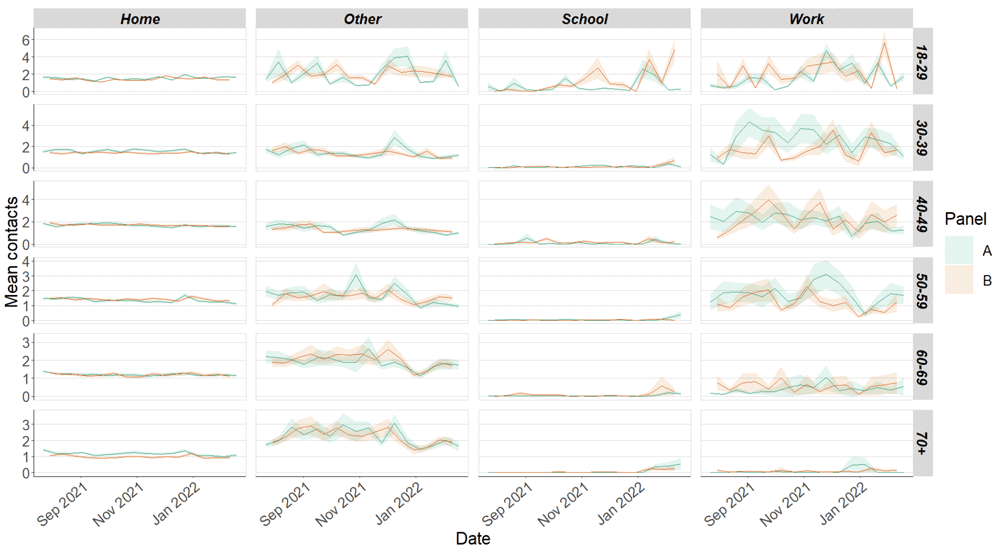
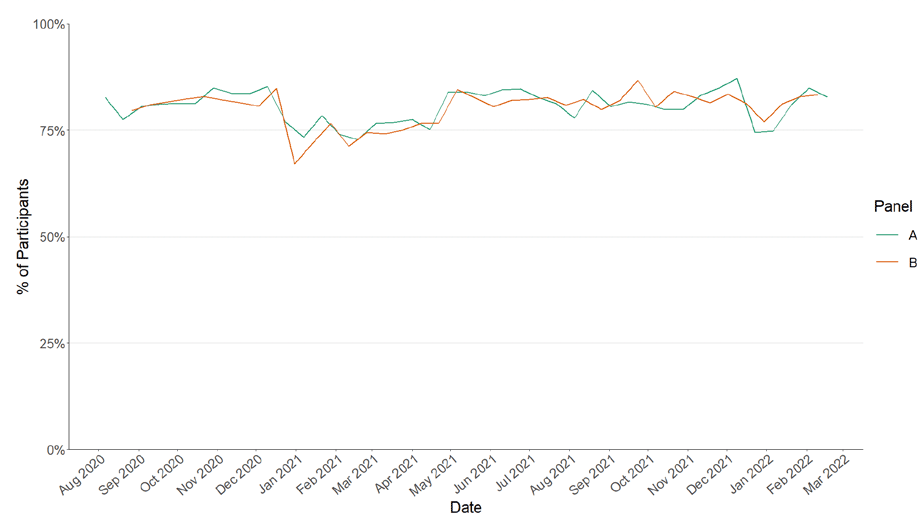
Average contacts from the most recent Panel A cohort of the Scottish Contact Survey (week ending 23rd February) indicate an average of 3.8 contacts. This has decreased by 14% compared to the previous Panel A of the survey (week ending 9th February), as seen in Figure 4. Mean contacts within the other setting (contacts outside home, school and work) have decreased by 34% within the last two weeks. Contacts within the home and work have remained at a similar levels over the same period.
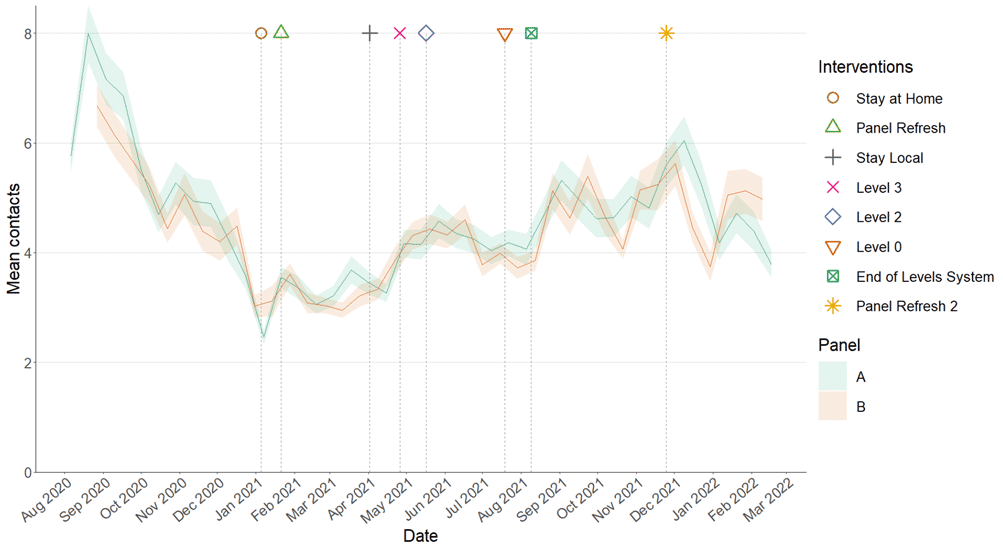
Figure 5 shows how contacts change across age group and setting. Those within the 18-39 age groups have reported the biggest decrease in contacts, by at least 26%. This was largely driven by a reduction in contacts in the other setting for those in the 18-29 age group and in the work setting for those within the 30-39 age group.
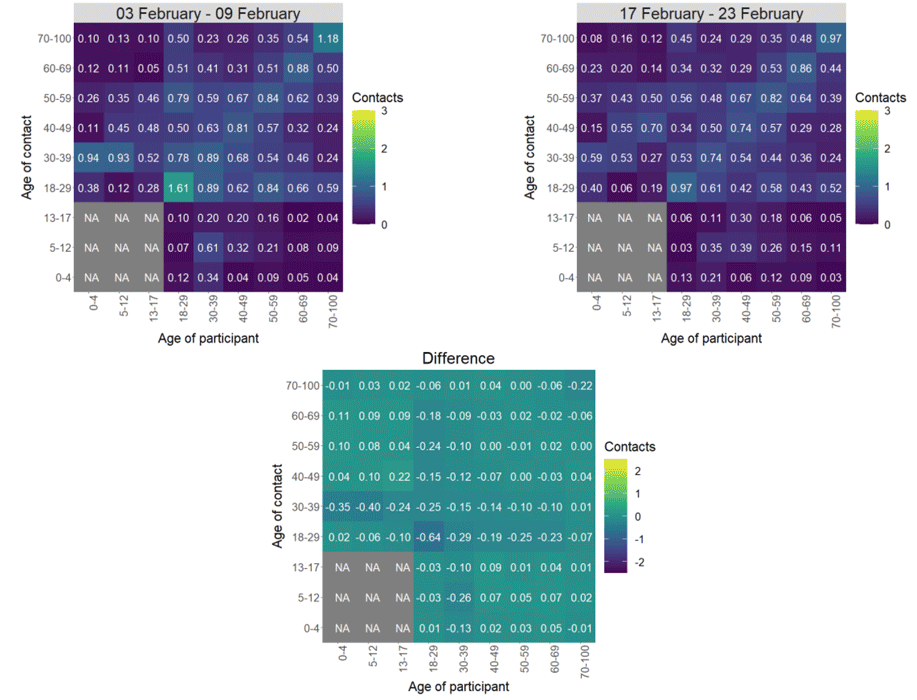
The heatmaps in Figure 6 show the mean overall contacts between age groups for the weeks relating to 3rd February - 9th February and 17th February - 23rd February and the difference between these periods. The biggest decrease in interactions between age groups is between those aged 18-29 with each other.
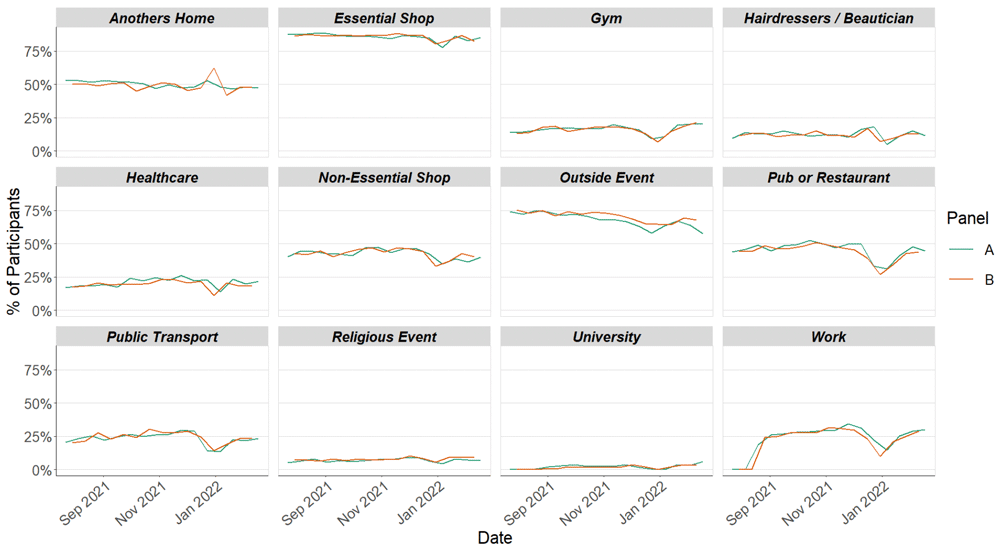
The biggest changes in the proportion of participants visiting different locations is seen in those visiting a non-essential shop and individuals visiting an outdoor event. Visits to a non-essential shop have shown the biggest increase, increasing from approximately 36% to 40% while visits to an outdoor event have shown the biggest decrease, decreasing from 64% to 58% in the last two weeks as shown in Figure 7.
Of those who have reported visiting a healthcare facility in the last 7 days, the most visited location was the general practitioner (GP) by 31%, followed by 21% of individuals attending an outpatient facility as shown in Figure 8.
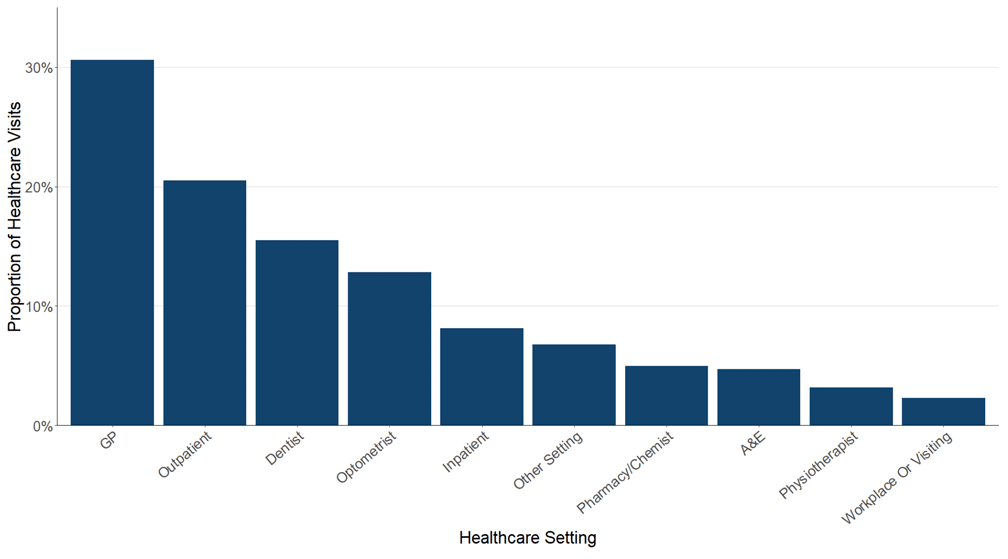
Figure 9 shows the number of people wearing a face covering where they have at least one contact outside of the home. This has decreased in the last two weeks from 85% to 83%.
Approximately 80% of individuals had taken at least one lateral flow test within the last 7 days for the survey pertaining to the 17th February - 23rd February, increasing from 76% two weeks prior as shown in Figure 10.
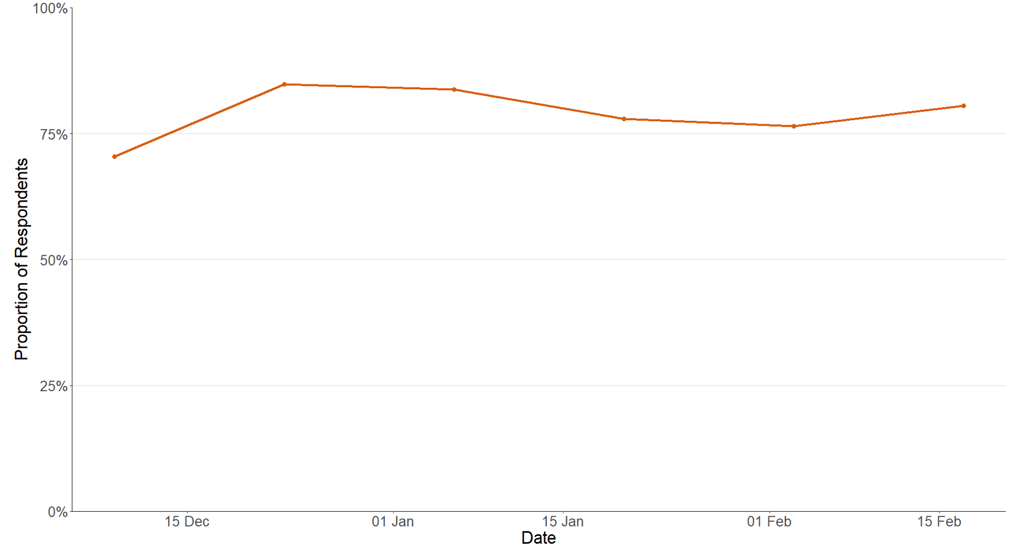
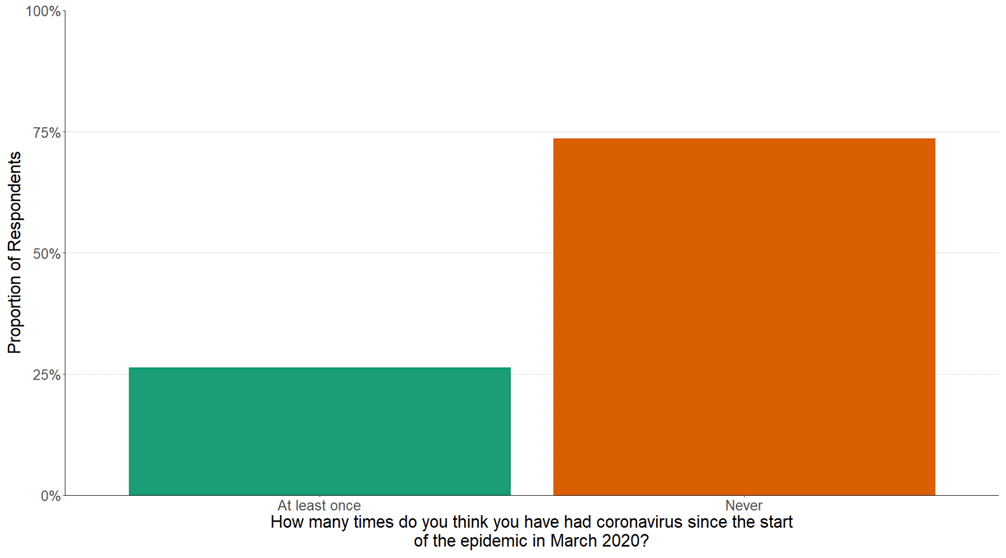
Figure 11 shows that approximately 26% of individuals believe they have had Covid-19 at least once since March 2020. Of those who think they have had Covid-19, 80% have had this confirmed through a test.
What the modelling tells us about estimated infections and hospitalisations
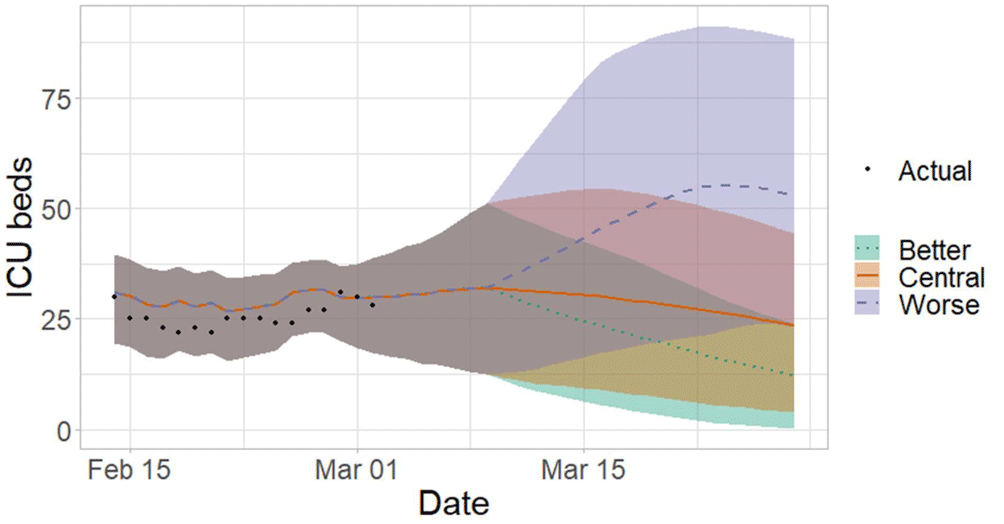
The Scottish Government assesses the impact of Covid-19 on the NHS in the next few weeks. Figures 12 - 14 show projections over four weeks.
'Central' assumes that transmissibility remains at current levels. 'Worse' assumes a higher transmissibility, whereas 'Better' assumes a lower transmissibility .
The future trajectory of infections is uncertain.
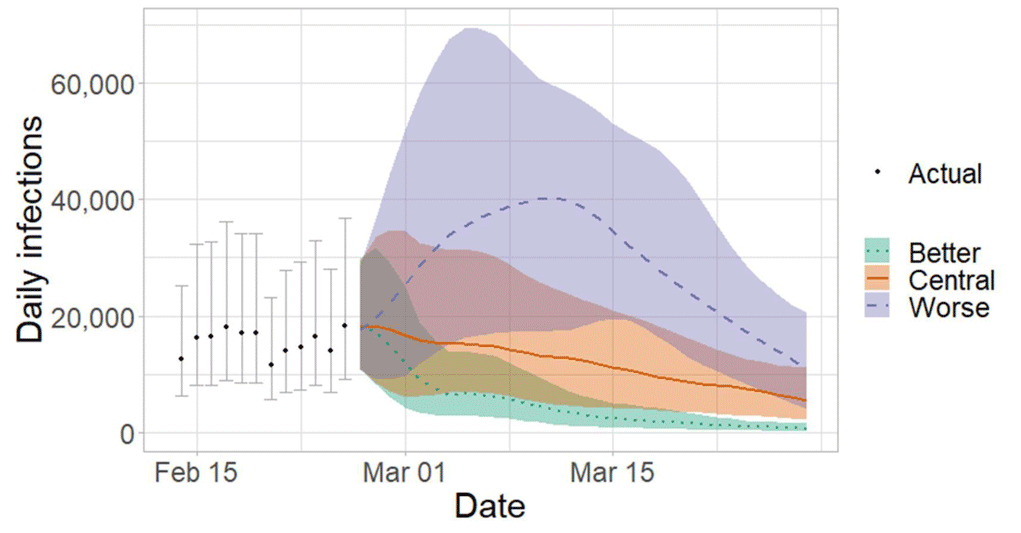
We estimate that daily infections could be up to 20,000 in late March.
Figure 13 shows the impact of the projections on the number of people in hospital. The modelling includes all hospital stays, whereas the actuals only include stays up to 28 days duration that are linked to Covid-19.
There continues to be uncertainty over hospital occupancy and intensive care in the next four weeks.
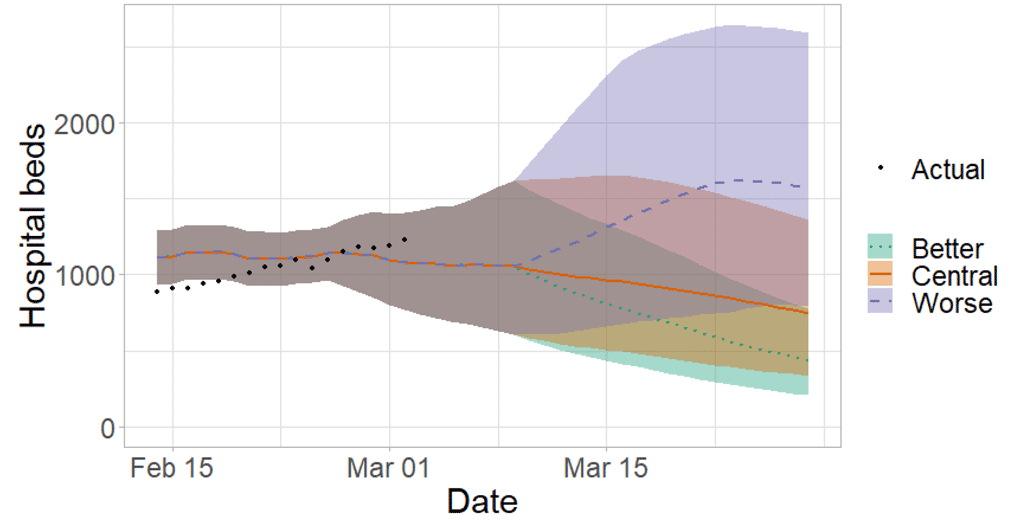
Figure 14 shows the impact of the projection on ICU bed demand.
What the modelling tells us about projections of hospitalisations, occupancy and deaths in the medium term
SPI-M-O produces projections of the epidemic (Figures 15 - 17), combining estimates from several independent models. These projections are not forecasts or predictions. They represent a scenario in which the trajectory of the epidemic continues to follow the trends that were seen in the data available to 28th February and do not include the effects of any future policy or behavioural changes.
The delay between infection, developing symptoms, the need for hospital care, and death means they cannot fully reflect the impact of behaviour changes in the two to three weeks prior to 28th February.
The projections include the potential impact of vaccinations over the next few weeks. Modelling groups have used their expert judgement and evidence from UKHSA, Scottish Universities & Public Health Scotland, and other published efficacy studies when making assumptions about vaccine effectiveness.
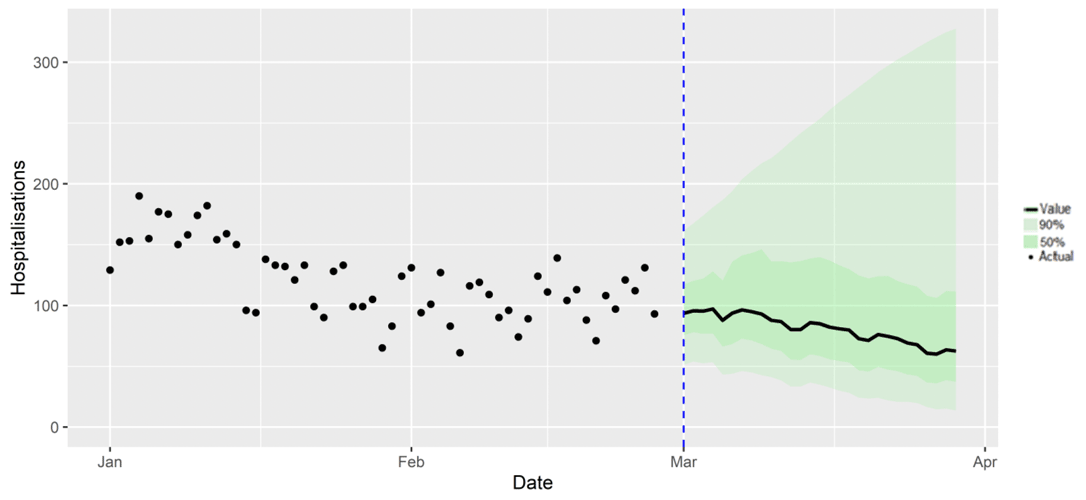
Figure 16 shows the SPI-M-O consensus on hospital occupancy. Hospital occupancy is determined by the combination of admissions and length of stay, the latter of which is difficult to model with confidence.
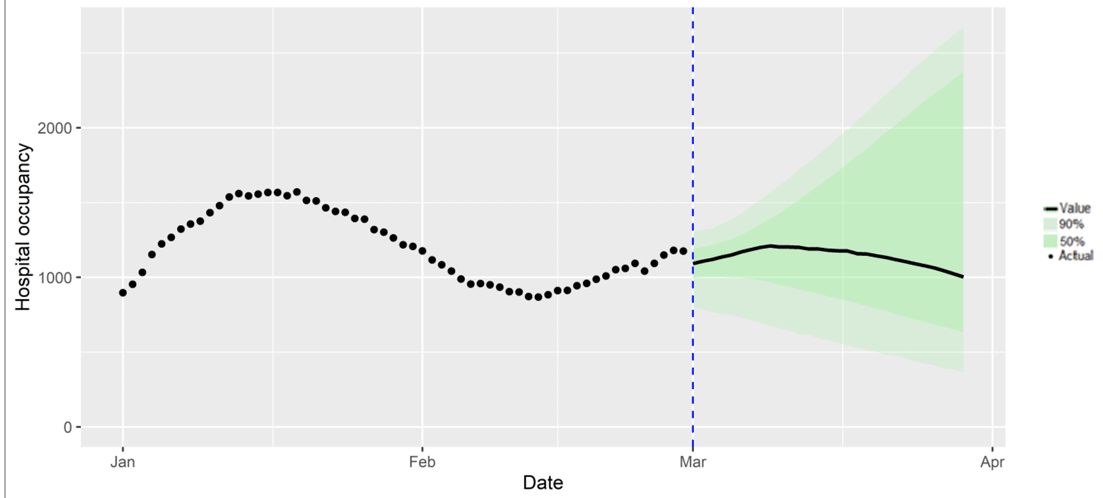
Figure 17 shows the SPI-M-O consensus on daily Covid-19 deaths.
What we know about which local authorities are likely to experience high levels of Covid-19 in two weeks' time
We continue to use modelling based on Covid-19 cases and deaths using data to 28th February from several academic groups to give us an indication of whether a local authority is likely to experience high levels of Covid-19 in the future. This has not been compiled via UKHSA into a consensus this week and is based on one modelling group.
In less populated regions in which case numbers are small, there is a greater variation in model estimates, and hence increased uncertainty. This has led to us not including Orkney Islands and Shetland Islands this week.
In this, an area is defined as a hotspot if the two week prediction of cases (positive tests) per 100K population is predicted to exceed a threshold, e.g. 500 cases.
Modelled rates of positive tests per 100K using data to 28th February (Figure 18) indicate that, for the week commencing 13th March, all 30 of the local authorities included are expected to exceed 50 cases per 100K with at least 75% probability. These same 30 local authorities also have at least a 75% probability of exceeding 100 cases per 100K.
Seven local authorities are expected to exceed 500 cases per 100K with at least 75% probability. These are Argyll & Bute, East Dunbartonshire, East Renfrewshire, Highlands, Moray, North Ayrshire and South Lanarkshire.
There are no local authorities which are expected to exceed 1000 cases per 100K with at least 75% probability.
Looking to the future
What may happen in the future around SARS-CoV-2 is uncertain and therefore there are a number of possible Covid-19 futures that may occur in the future. For example, the current Omicron wave may dissipate leaving low levels of Covid-19, or a new variant may emerge potentially having vaccine escape or increased severity, or people's behaviours may change. One approach to this uncertainty is to model alternative versions of the future through the development of different Covid-19 scenarios. See the Technical Annex in Issue 91 for more details on how we do this modelling.
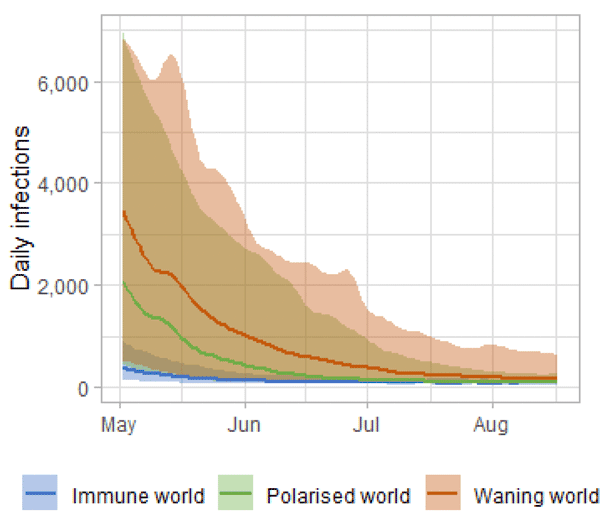
Given what we know about Covid-19 these possible futures range from a world where immunity reduces Covid-19 hospitalisations and deaths to low levels, through to variant world where a variant with immune escape enters Scotland and Covid-19 hospitalisations and deaths could increase. In between these two extremes could be possible futures where vaccine effectiveness wanes or where people's behaviour becomes polarised between those who continue with Covid-19 precautions e.g. hand washing etc. and those who do not (see Figure 19).
The scenarios we provide in the next section look at what could happen for planning purposes, not to forecast what will happen. These scenarios include no changes from the current baseline measures. The assumptions are based on our most up to date knowledge, but do not include the effect of future changes in treatment of Covid-19 e.g. widespread use of antivirals or changes in behaviour in response to high levels of infections e.g. in variant world. Therefore, in the most extreme scenarios the peak may be lower than suggested if behaviour or restrictions changed.
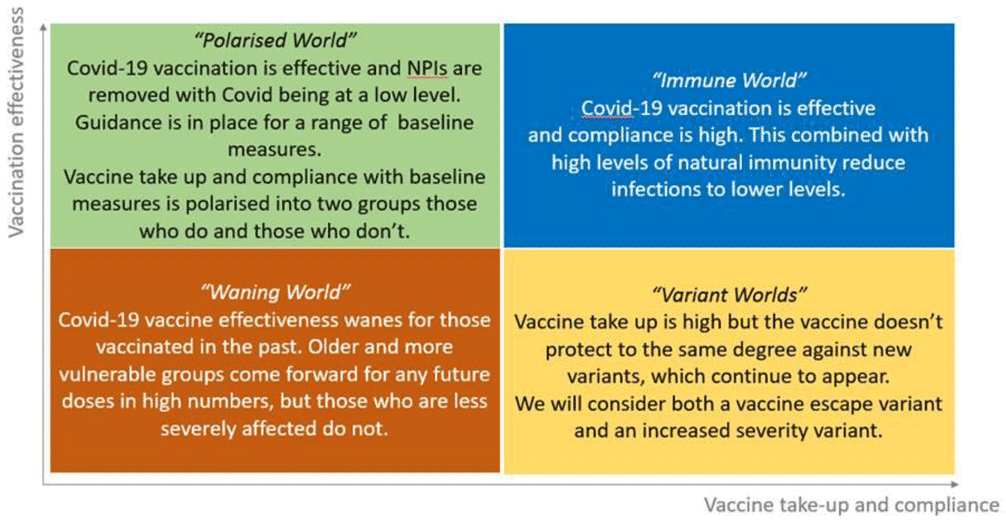
There is no linear progression between the worlds and all are plausible. Each world inherently contains a different threat level requiring a different approach to management.
Immune World
In this possible future vaccines and natural immunity are effective at keeping Covid-19 at low levels. Baseline measures and LFD testing are in place to protect the vulnerable e.g. elderly and immune compromised and adhered to by the public to high levels. New variants may emerge in Scotland but for the foreseeable future infections are based around Omicron.
Infections may decrease from current levels over the coming weeks and months to very low levels. Likewise hospital and ICU occupancy may follow this trend relieving the pressure on healthcare services. Issues with vaccine waning and new variants are not considered in this world and therefore levels of infections remain low (<1,000 per day).
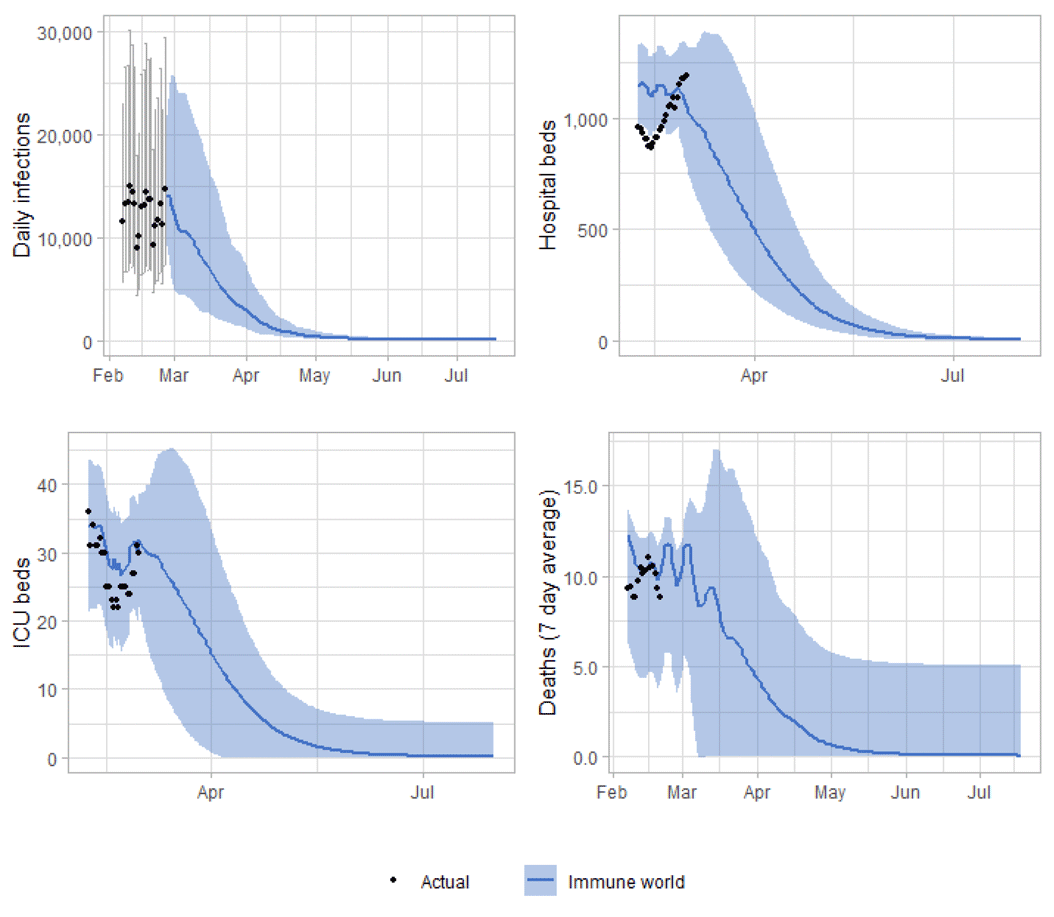
In Immune world Covid-19 in Scotland reduces below epidemic levels, becoming endemic. Cases of Covid-19 therefore spring up only as rare outbreaks which are controlled through public health measures. People's lives return to something close to normality e.g. physical distancing is not needed but people still choose to self-isolate and hygiene is good. As vaccines are effective, take-up of first/second/third doses are good and boosters become part of an annual cycle like flu. The numbers of people who need medical treatment or hospitalisation for Covid-19 remain low.
The focus moves away from Covid-19 response and into recovery. This includes addressing learning losses, treating Long Covid and working through the hospital backlog. Wellbeing measures improve with reduced anxiety and increased happiness. Those from the highest risk groups feel they can reintegrate without government interventions. The economy begins to recover from the effects of Covid-19. Travellers do not face significant issues with trips overseas.
Waning world
In this world Covid-19 vaccines are effective over several months, but waning then occurs. It is hard to keep pace with booster vaccinations which become increasingly difficult to justify. Demands for vaccines throughout the rest of the world and the increasing reluctance of people in Scotland to keep being boosted reduces the overall immunity levels of the population.
Infections may not substantially decrease from current levels initially before falling in March as the natural immunity begins to offset the waning of vaccine acquired immunity.
Impacts on hospital/ICU occupancy and deaths are uncertain. While at relatively low levels infections may be between 500 – 3,000 per day by summer. These levels would be higher than has been observed in summer 2020 and 2021 and higher than what may happen in immune world (see Figure 21).
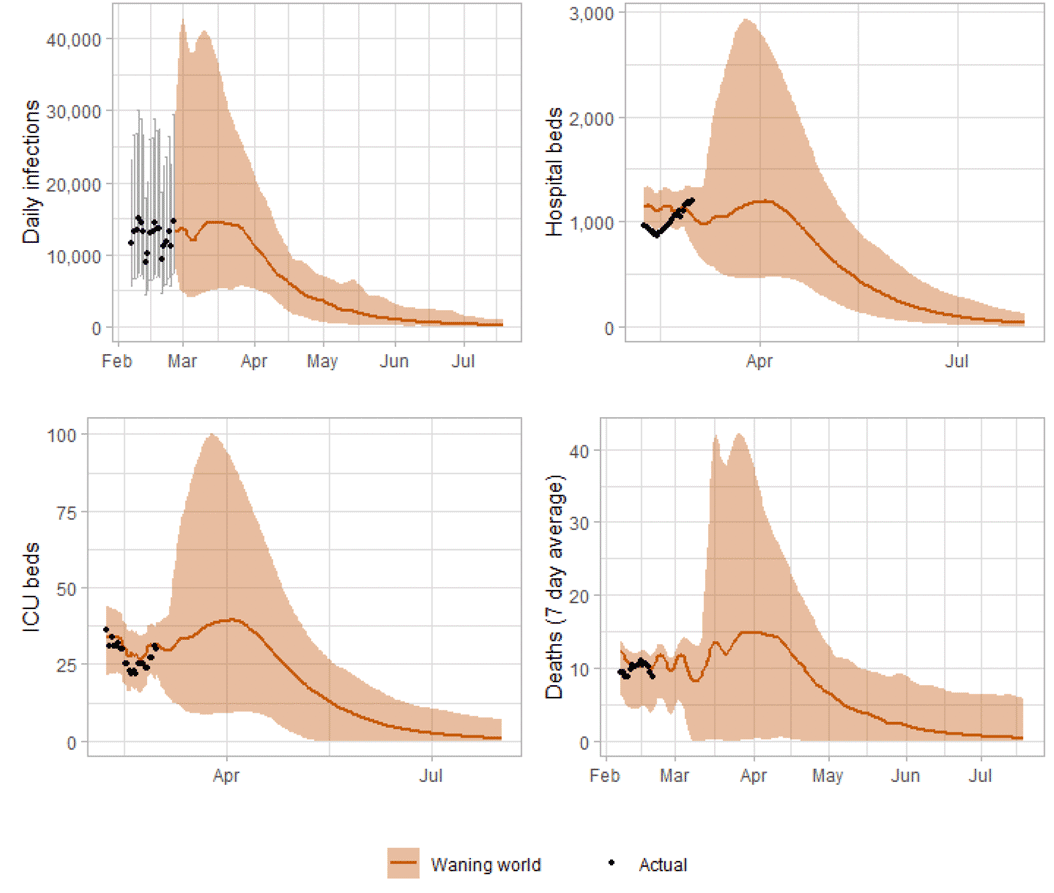
The number of people who need medical treatment or hospitalisation for Covid-19 rises particularly in vulnerable/older age groups where it is increasingly difficult to deliver an effective booster regime.
The focus continues to be on Covid-19 response and it is harder to shift on to recovery. Hospitals are still dealing with increasing cases of Covid‑19 putting pressure on healthcare services and workforce which also puts pressure on other public services and budgets. Work is ongoing on rectifying learning loss but continued cases of Covid-19 within education settings with children and staff being off school slows the effectiveness of this work.
The population becomes segmented as the most vulnerable due to vaccine waning lead restricted lives or accept significant risk of serious illness and experience high levels of anxiety and low levels of wellbeing. The rest of the population live a more normal life accepting the possibility of infection with mild illness. Anxiety reduces but does not disappear, likewise wellbeing increases but there is still concern about infection. The economy continues to be impacted by workforce absences, the self-shielding actions of a proportion of the population and risk adverse behaviours.
Polarised world
In this world, vaccines and natural immunity are effective at reducing infections. Baseline guidance remains in place, with face coverings, physical distancing and some testing. The approach followed relies on individual risk assessment and behaviours. However society becomes polarised as some continue to take up vaccines and follow guidance while others are more reluctant. Covid-19 becomes a disease associated with those who do not or cannot get full vaccine benefit and do not or cannot adopt a risk based approach maintaining baseline measures.
Infections may decrease from current levels over the coming weeks and months to low levels but more slowly than in other scenarios due to various groups behaving differently across society.
This world assumes that infections continue to decrease in the coming weeks with behavioural changes beginning to occur in response to this and to the better weather from March. Unvaccinated adults and those with one dose are assumed to return to pre-pandemic behaviours within six weeks. Adults with two doses are assumed to return to these behaviours over 12 weeks, with those with three doses assumed to have no significant changes in behaviour.
Vaccine waning is included in this world whereby only some of those with three doses come forward for a potential fourth dose.
While at relatively low levels infections may be between 500 – 3,000 per day by summer. These levels would be higher than has been observed in summer 2020 and 2021 and higher than what may happen in immune world (see Figure 22).
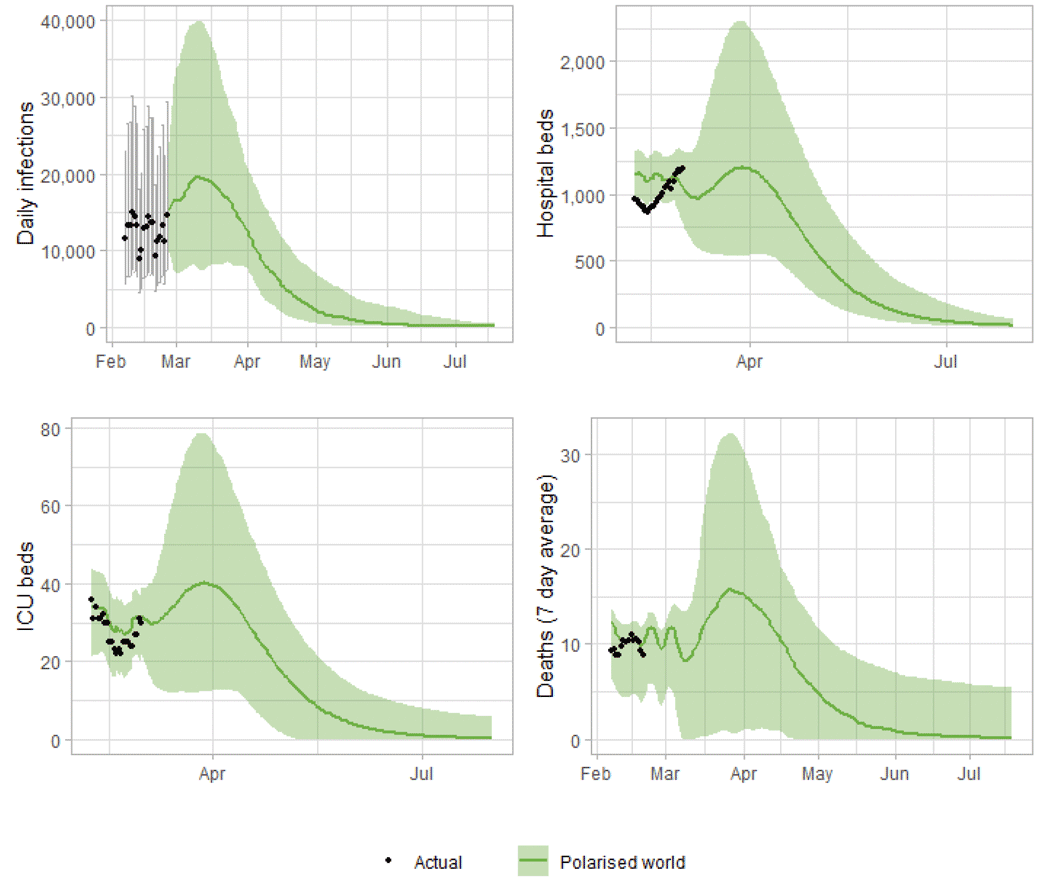
Cases of Covid-19 spring up and are hard to control in those who are not vaccinated or vulnerable. People's lives return to a "new normal" but, due to polarised groups in society with some following and some not following the guidance on baseline restrictions, infections remain.
Vaccines are effective so older and more vulnerable people come forward for future doses in high numbers but those who are less severely affected do not. Vulnerable groups such as the very elderly and immune compromised are at risk from infection from those not vaccinated or boosted.
The focus remains on Covid-19 and the shift onto recovery is slower. Existing learning losses are harder to rectify and continue to accrue due to infections within education settings. The hospital backlog is difficult to address as hospitals are still dealing with Covid-19 cases. The population becomes polarised in to those whose wellbeing improves e.g. lower risk people and those whose wellbeing deteriorates e.g. higher risk or poorer people whose levels of anxiety increase as Covid-19 circulates. They continue to experience greater illness, greater poverty or disruption to their income. The economy continues to be impacted from the effects of Covid-19. Unvaccinated travellers continue to face significant uncertainty with trips.
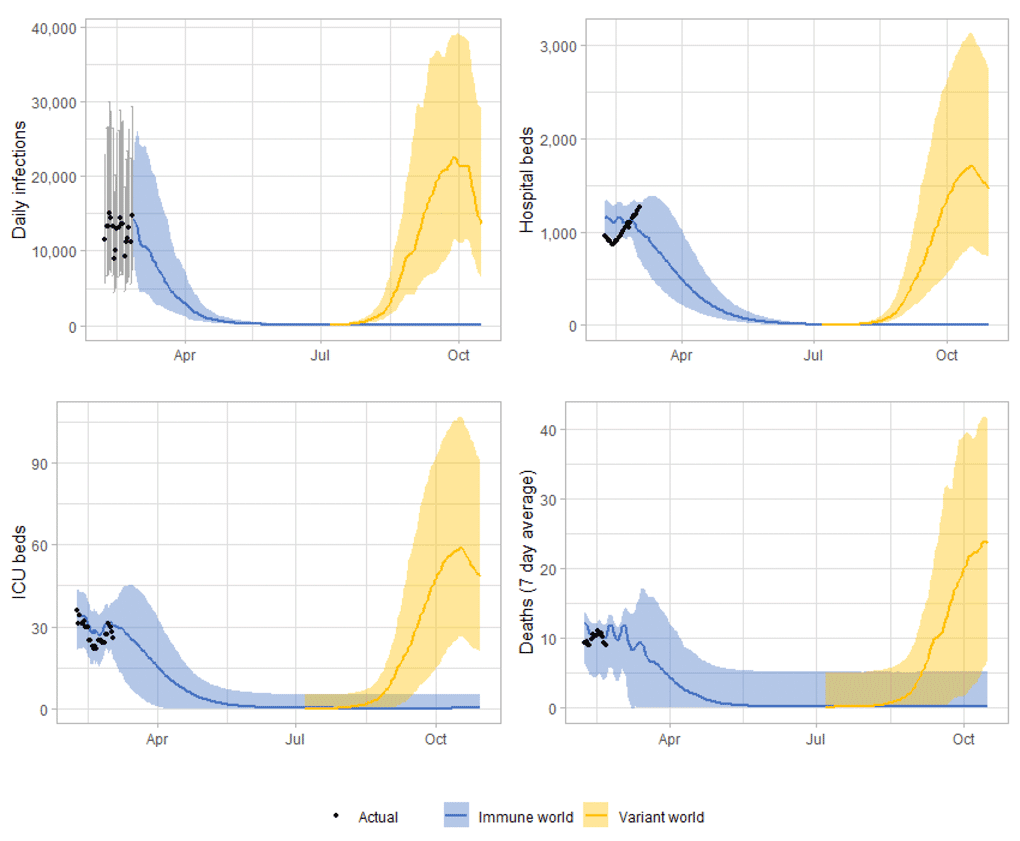
Variant world – vaccine escape with same severity as Delta
In this possible future a variant with vaccine escape emerges in Scotland presenting a challenge even for fully vaccinated people. This new variant leads to increased transmission, but not to increased severity. Baseline measures – face coverings, LFD, physical distancing remain and, in this scenario other NPIs may need to be put in place for a short time. This world is similar to what has happened in Scotland with the emergence of Omicron.
Omicron may be reduced to low levels within Scotland as a new variant takes over. This causes a new wave of Covid-19 infections. However this wave is not accompanied by significant numbers with serious illness and vaccines continue to protect. People's lives are disrupted due to the increasingly high levels of infections leading to time off work ill or isolating.
To show the potential impact assume a new variant appears in Scotland as people return from their summer holidays and return to work and school. The timing is uncertain and a potential new variant may appear sooner than the summer or significantly later but has currently been lined up with the summer holidays to show illustratively what could happen. The new variant may cause Omicron infections to decrease significantly or disappear entirely (Immune world has been used to illustrate this). The new variant is modelled with similar transmissibility and vaccine escape as Omicron with severity characteristics similar to Delta. It could lead to high levels of infections leading to hospital occupancy rising above capacity restrictions. With sustained high levels of infection we could again see increased staff absences in a number of sectors that were affected by this in the recent Omicron wave.
The focus remains on Covid-19 and it is hard to shift on to recovery. Continued infections within education settings and staff shortages make some school closures necessary. The Covid-19 strain on hospitals is high due to the very high numbers of infections and workforce pressures grow making it difficult to address the hospital backlog. Wellbeing measures deteriorate with people reporting low happiness and general 'tiredness with it all'. The economy continues to be impacted from the effects of Covid-19 with many people off work. Travellers may not want to come to the UK as the new variant sweeps through.
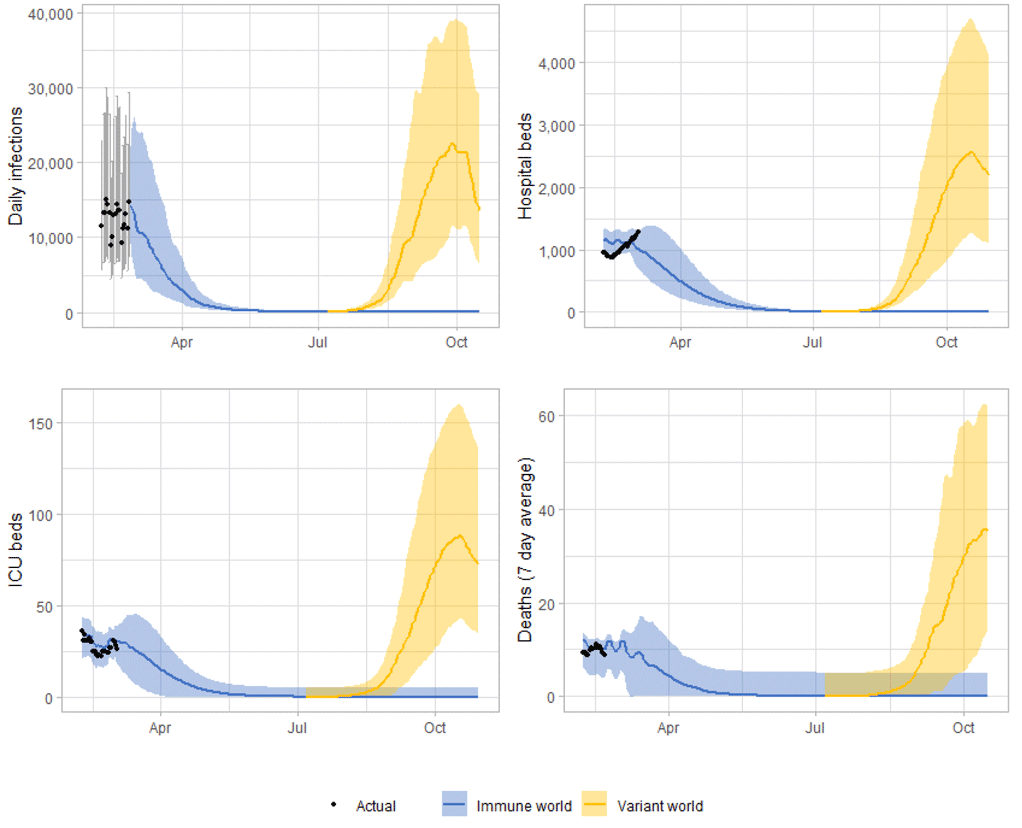
Variant world – vaccine escape with increased severity compared to Delta
As with the other example of Variant world, a new variant appears in Scotland as people return from their summer holidays and return to work and school. The timing is uncertain but has currently been lined up with the summer holidays where reduced travel restrictions may make it more likely that a new variant is brought into Scotland.
The new variant may cause Omicron infections to decrease significantly or disappear entirely. It is modelled with similar transmissibility and vaccine escape as Omicron with severity characteristics 50% higher than Delta, purely for illustrative purposes.
It could lead to high levels of infections leading to hospital occupancy rising well above capacity restrictions. With sustained high levels of infection we could again see increased staff absences in a number of sectors that were affected by this in the recent Omicron wave.
Background levels of Covid-19
In each of these possible futures there will be a background level of Covid-19 to plan for and manage. When comparing the worlds, Figure 19 shows the period May to September and what the background levels may look like. This ranges from under 1,000 Covid-19 infections in Scotland per day to over 6,000 in May, potentially dropping to below 1,000 in August. If a new variant appeared it could be substantially higher. Depending on this background level of Covid-19 different levels of pressure will be put on the public sector in Scotland as different numbers of people become sick and need medical treatment.
The four worlds plausible scenarios as presented in this section should not be considered predictions. It is difficult to ascertain which of these scenarios may be the more likely and in reality the situation is likely to move from one to the other and not in a linear fashion. Instead they provide some illustration of what each world could look like and the issues to be considered. Over the coming months they will be updated as circumstances change to support ongoing planning and management of the pandemic.
Summary of spatial analysis of Covid-19 spread in Scotland
Researchers at the Edinburgh Roslin Institute have conducted spatial analysis of Covid-19 Spread in Scotland. A summary of findings from the week from 22nd February to 28th February 2022 is included here. Risk factors indicate where the number of cases are higher than expected geographically (i.e. administrative data zones), but do not necessarily represent the risk to individuals in those areas.
The modelling shows that there remains a substantial variation in risk of infection by average census age in each datazone. Deprivation in this period is not a substantial factor when comparing across local authorities. Risk factors remain stable, when comparing to previous weeks.
The trend where numbers of PCR and LFD tests are both declining, but positivity is increasing, continues across all deprivation scores, suggesting ascertainment (ie the proportion of infections which are detected by testing) may be continuing to decrease.
The distribution of lateral flow/LFD tests being reported varies substantially by both age and deprivation status, with many fewer tests reported in younger adults across all deciles of deprivation, and for children in more deprived deciles. The high level of LFD positivity in the latter category is marked, and when compared to the high number of positives amongst the least deprived, suggests that ascertainment may be lower in younger people in deprived areas.
What can analysis of wastewater samples tell us about local outbreaks of Covid-19 infection?
Levels of Covid-19 RNA in wastewater (WW) collected at a number of sites around Scotland are adjusted for population and local changes in intake flow rate (or ammonia levels where flow is not available). See Technical Annex in Issue 34 of these Research Findings for the methodology.
Nationwide, wastewater Covid-19 RNA levels have been fairly stable without showing any consistent trend in the last three weeks. The week ending on 28th February saw levels of around 64 million gene copies per person per day (Mgc/p/d) compared to 79 Mgc/p/d the previous week (week ending 21st February).
The number of wastewater samples analysed was 180, compared to 193 in the previous week. Note that the reporting week ends on Monday 28th February due to unforeseen external issues at SEPA's facilities.
In Figure 28, we restrict the plotting to the period after the end of 2021, at which point S-gene dropout testing data suggest that nearly all cases are from the Omicron variant. In this period, WW testing should have a consistent relationship with Covid-19 prevalence, assuming that the change in relationship is due to the new dominant variant and there is no shedding difference with Omicron BA.2. In this graph, we see a flat trend in WW levels over the last week. We also superimpose data from the ONS Coronavirus Infection Survey (CIS), with scaling chosen to match case and wastewater trends last year. The latest CIS data covers the week ending 19th February. This shows Covid-19 levels appearing to show a slight increase. We will monitor whether this is just due to the CIS data lagging behind the WW data or whether there is a real divergence. Also note that the drop in levels between the last two weeks as mentioned above concerns the comparison of the very last point with its equivalent of the previous week and is not a comparison of the last two rolling averages shown on the graph.
Tracking variants using wastewater
In the Covid-19 wastewater monitoring programme, samples are taken regularly from wastewater treatment works (WWTW) by Scottish Water. The Scottish Environment Protection Agency (SEPA) extracts RNA from these samples, and then measures the concentration of SARS-CoV-2 RNA in the samples using quantitative PCR. More recently, a team from the University of Edinburgh has developed an approach to sequence the same SARS-CoV-2 RNA extracts, with a view to quantifying the percentages of specific variants. Biomathematics & Statistics Scotland (BioSS) has been charged with processing and reporting this sequencing data.
This work has shown that SARS-CoV-2 variants can both be detected and quantified in wastewater samples. This section describes this development process and provides some early results. It shows the emergence of Omicron (B.1.1.529 and sublineages) in December 2021 to become the dominant variant, and also maps the spread of the Omicron BA.2 during January and February 2022.
Sequencing of samples from wastewater is more difficult than for samples obtained from individuals through saliva or nose/throat swabs. In the case of samples from individuals, only one variant is expected to be present. For wastewater, there may be several variants present in the sample, but this also presents an opportunity, as the sample typically represents a large population. It is thus a cheaper and more comprehensive way to monitor variants.
In the approach adopted by the University of Edinburgh, sequencing focusses on the S-gene, the part of the genome related to the spike protein. Individual mutations are identified within a sample and assigned to a variant based on characteristic mutations for that lineage. The proportion of a particular variant, such as Omicron or Delta, is estimated via the proportions of SARS-CoV-2 sequences in the sample with those lineage-defining mutations.
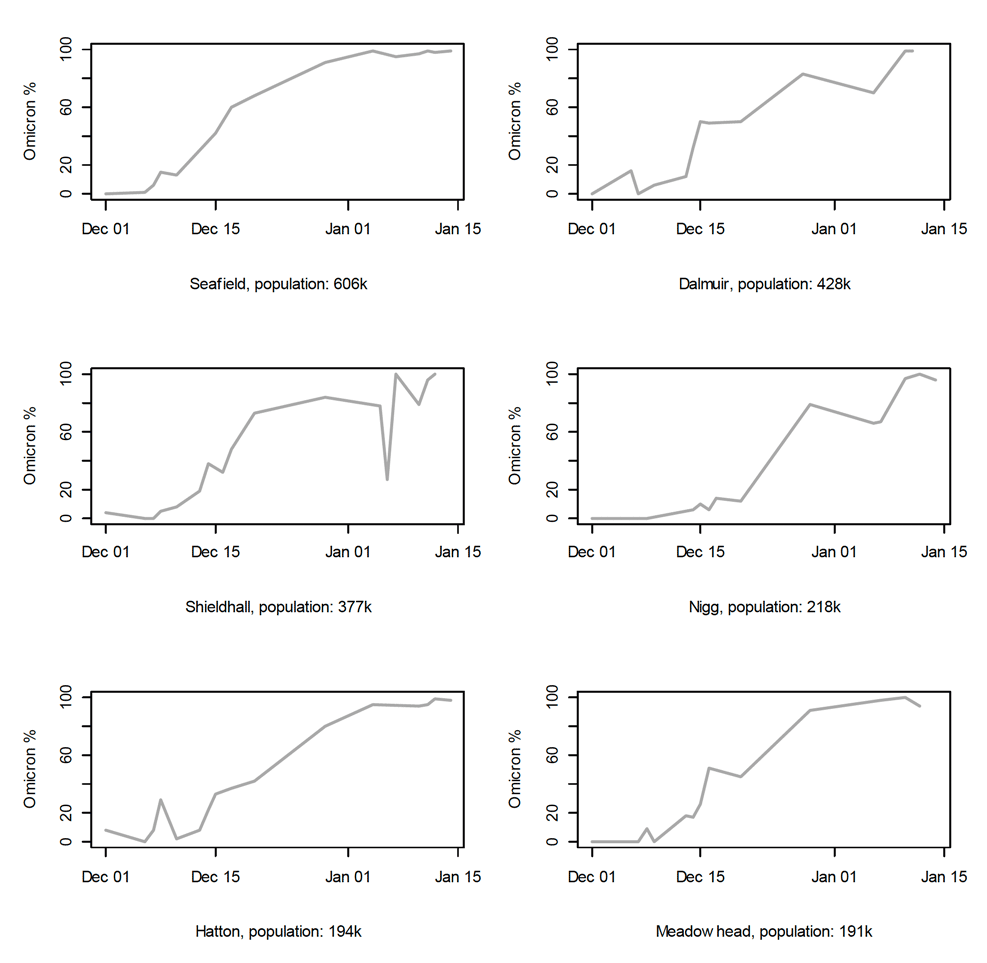
Figure 29 shows the percentage of Omicron (B.1.1.529 and sublineages) estimated in samples taken between 1st December 2021 and 15th January 2022. These are for six WWTW with large catchment populations (Seafield covers Edinburgh; Dalmuir and Shieldhall cover Glasgow; Nigg covers Aberdeen; Hatton covers Dundee; and Meadowhead covers parts of Ayrshire including Ayr, Irvine and Kilmarnock). These all show the increase in the prevalence of Omicron from near zero to nearly all cases by mid-January 2022. Understanding of sample-to-sample error in the estimated proportions is a subject of ongoing research. Also under investigation is the relationship between these results and proportions of cases of S-gene dropout in individuals found by PCR (S-gene dropout can be used to discriminate between Delta and Omicron (BA.1)). This could form a basis for estimating the difference in the amount of RNA produced by Delta and Omicron, and then to inform the adjustment of WW prevalence figures.
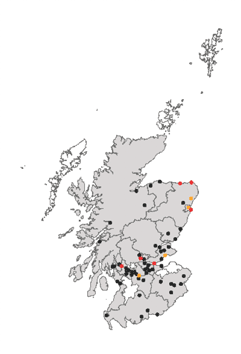
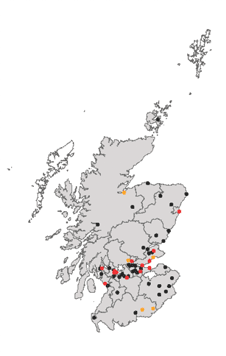
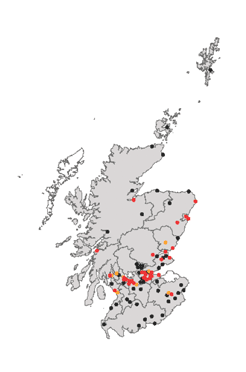
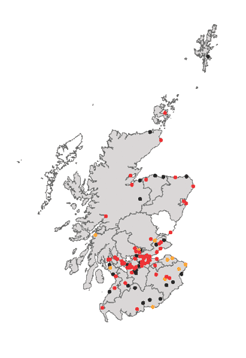
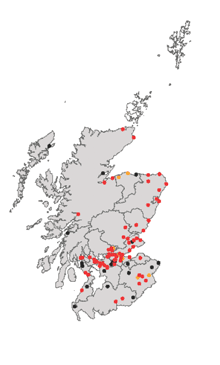
In Figure 30, we illustrate the emergence of Omicron BA.2 at the WWTWs sampled in January and February 2022. This shows the expansion in the number of sites with BA.2 detected, with the most recent period (14th to 18th February) having 78% of sites with BA.2 detected. Note that during this period, a technical issue meant that it was not possible to quantify variant levels at the WWTW sites. It also meant that sites with low BA.2 prevalence would have had a lower chance of being detected.
Figure 30: Locations of Wastewater Treatment Works where BA.2 has been detected during January and February 2022[12].
Long Covid
A report on the rate of long Covid has not been included this week. We will report the long Covid projections again once updated estimates of self-reported long Covid prevalence amongst those infected with the less severe Omicron variant become available.
What next?
Modelling will continue to look at the impact of Omicron, particularly the variant BA.2. The UKHSA Risk Assessment for BA.2 (23rd February 2022) stated that there is moderate confidence that BA.2 has a growth advantage compared to BA.1, from data reported by multiple countries. As the year progresses we will incorporate different models as and when it is appropriate to do so.
We hope to include our analysis on long Covid in future weeks.