Coronavirus (COVID-19): modelling the epidemic (issue no. 45)
Latest findings in modelling the COVID-19 epidemic in Scotland, both in terms of the spread of the disease through the population (epidemiological modelling) and of the demands it will place on the system, for example in terms of health care requirement.
Technical Annex
How the modelling compares to the real data as it emerges
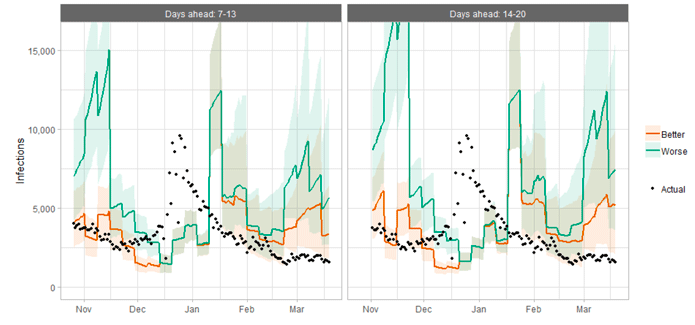
The following charts show the history of our modelling projections in comparison to estimates of the actual data. The infections projections were largely accurate during October to mid-December and from mid-January onward. During mid-December to mid-January, the projections underestimated the number of infections, due to the unforeseen effects of the new variant.
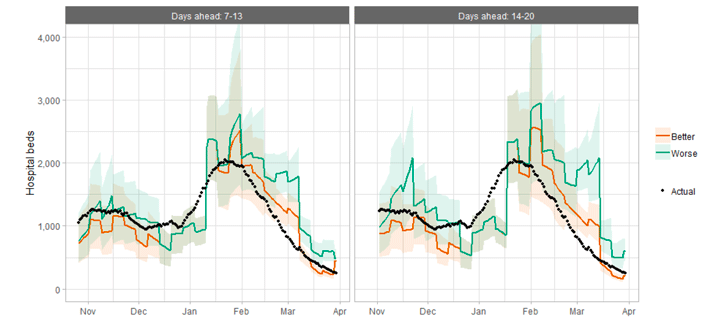
Hospital bed projections have generally been more precise than infections estimates due to being partially based on already known information about numbers of current infections, and number of people already in hospital. The projections are for number of people in hospital due to Covid, which is slightly different to the actuals, which are number of people in hospital within 28 days of a positive Covid test.
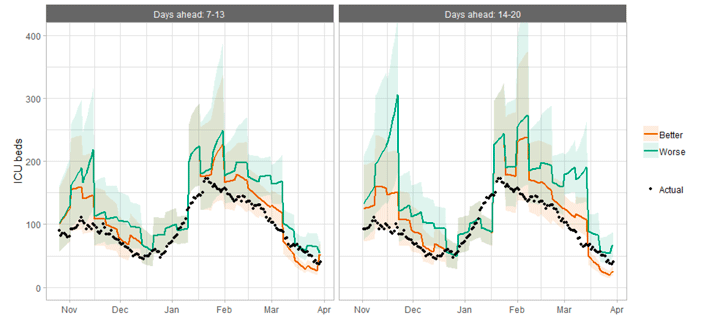
As with hospital beds, ICU bed projections have generally been more precise than infections. The projections are for number of people in ICU due to Covid. The actuals are number of people in ICU within 28 days of a positive Covid test up to 20 January, after which they include people in ICU over the 28 day limit.
| LA | P (Cases > 500) | P (Cases > 300) | P (Cases > 100) | P (Cases > 50) |
|---|---|---|---|---|
| Aberdeen City | 0-5% | 5-15% | 25-50% | 25-50% |
| Aberdeenshire | 0-5% | 0-5% | 15-25% | 25-50% |
| Angus | 0-5% | 0-5% | 5-15% | 15-25% |
| Argyll and Bute | 0-5% | 0-5% | 0-5% | 5-15% |
| City of Edinburgh | 0-5% | 5-15% | 25-50% | 50-75% |
| Clackmannanshire | 0-5% | 0-5% | 5-15% | 25-50% |
| Dumfries & Galloway | 0-5% | 0-5% | 5-15% | 25-50% |
| Dundee City | 0-5% | 0-5% | 25-50% | 50-75% |
| East Ayrshire | 0-5% | 0-5% | 15-25% | 25-50% |
| East Dunbartonshire | 0-5% | 0-5% | 15-25% | 50-75% |
| East Lothian | 0-5% | 0-5% | 5-15% | 25-50% |
| East Renfrewshire | 0-5% | 0-5% | 25-50% | 75-100% |
| Falkirk | 0-5% | 0-5% | 15-25% | 50-75% |
| Fife | 0-5% | 5-15% | 25-50% | 25-50% |
| Glasgow City | 15-25% | 15-25% | 25-50% | 75-100% |
| Highland | 0-5% | 0-5% | 5-15% | 5-15% |
| Inverclyde | 0-5% | 0-5% | 0-5% | 15-25% |
| Midlothian | 0-5% | 0-5% | 5-15% | 25-50% |
| Moray | 0-5% | 0-5% | 5-15% | 25-50% |
| Na h-Eileanan Siar | 0-5% | 0-5% | 0-5% | 0-5% |
| North Ayrshire | 0-5% | 5-15% | 25-50% | 75-100% |
| North Lanarkshire | 5-15% | 15-25% | 50-75% | 75-100% |
| Orkney Islands | 0-5% | 0-5% | 0-5% | 0-5% |
| Perth and Kinross | 0-5% | 0-5% | 15-25% | 25-50% |
| Renfrewshire | 0-5% | 5-15% | 25-50% | 75-100% |
| Scottish Borders | 0-5% | 0-5% | 0-5% | 5-15% |
| Shetland Islands | 0-5% | 0-5% | 0-5% | 5-15% |
| South Ayrshire | 0-5% | 0-5% | 5-15% | 25-50% |
| South Lanarkshire | 5-15% | 5-15% | 25-50% | 75-100% |
| Stirling | 0-5% | 0-5% | 5-15% | 25-50% |
| West Dunbartonshire | 0-5% | 0-5% | 15-25% | 50-75% |
| West Lothian | 5-15% | 15-25% | 75-100% | 75-100% |