Coronavirus (COVID-19): modelling the epidemic (issue no.101)
Latest findings in modelling the COVID-19 epidemic in Scotland.
Coronavirus (Covid-19): modelling the epidemic in Scotland (Issue No. 101)
Background
This is a report on the Scottish Government modelling of the spread and level of Covid-19 in Scotland. This updates the previous publication on modelling of Covid-19 in Scotland published on 26th May 2022. The estimates in this document provide an overview of the situation regarding the virus and help the Scottish Government, the health service and the wider public sector plan ahead.
This edition of the research findings does not include the estimates of R, growth rate or incidence. UKHSA is publishing R and growth rates next on the 24th June 2022. We therefore do not include the medium-term projections into infections, or hospital and ICU occupancy. These will be re-instated in the next research findings. This research findings summarises the main modelling outputs which are not reliant on the UKHSA consensus.
Key Points
- Average contacts from the most recent wave of the Scottish Contact Survey (26th May - 1st June) indicate an average of 4.9 contacts. This has remained at a similar level compared to the previous wave of the survey (12th May - 18th May) where average contacts were 5.0.
- Mean contacts within the work setting have increased in the last two weeks by 14% whereas contacts within the other setting (contacts outside home, school and work) have decreased by 13%. Contacts within the home have remained at a similar level over the same period.
- All age groups with the exception of those within the 50-59 age group have reported a decrease in contacts.
- Those within the 18-49 age group have reported a decrease in contacts with those aged under 18 whereas those aged over 49 have reported an increase in contacts with this age group.
- The biggest changes in the proportion of participants visiting different locations is seen in those visiting a pub or restaurant, increasing from 50% to 54% in the last two weeks.
- The percentage of people wearing a face covering where they have at least one contact outside of the home has decreased from 48% to 38% since the last wave of the survey.
- Approximately 37% of people had taken at least one lateral flow test in the previous 7 days, decreasing from 40% in the previous wave of the survey.
- 44% of participants believe they have had Covid-19 at least once since March 2020.
- Analysis by the Edinburgh University Roslin Institute indicates that there remains a substantial variation in geographical risk of infection when considering the average recorded census age and booster vaccination uptake.
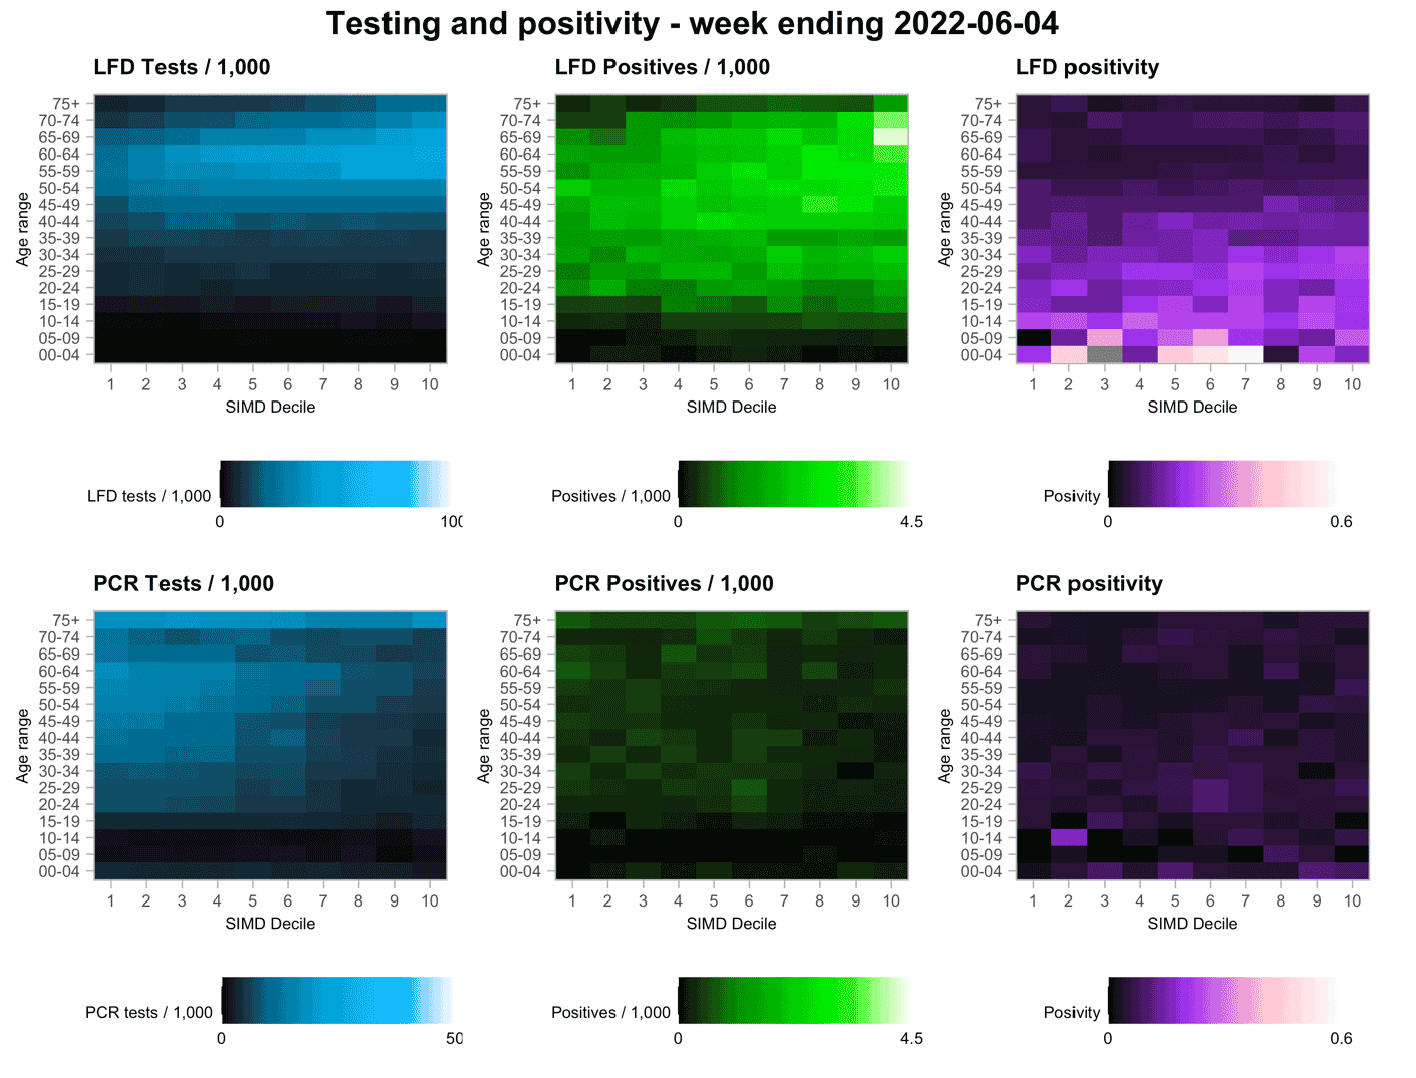
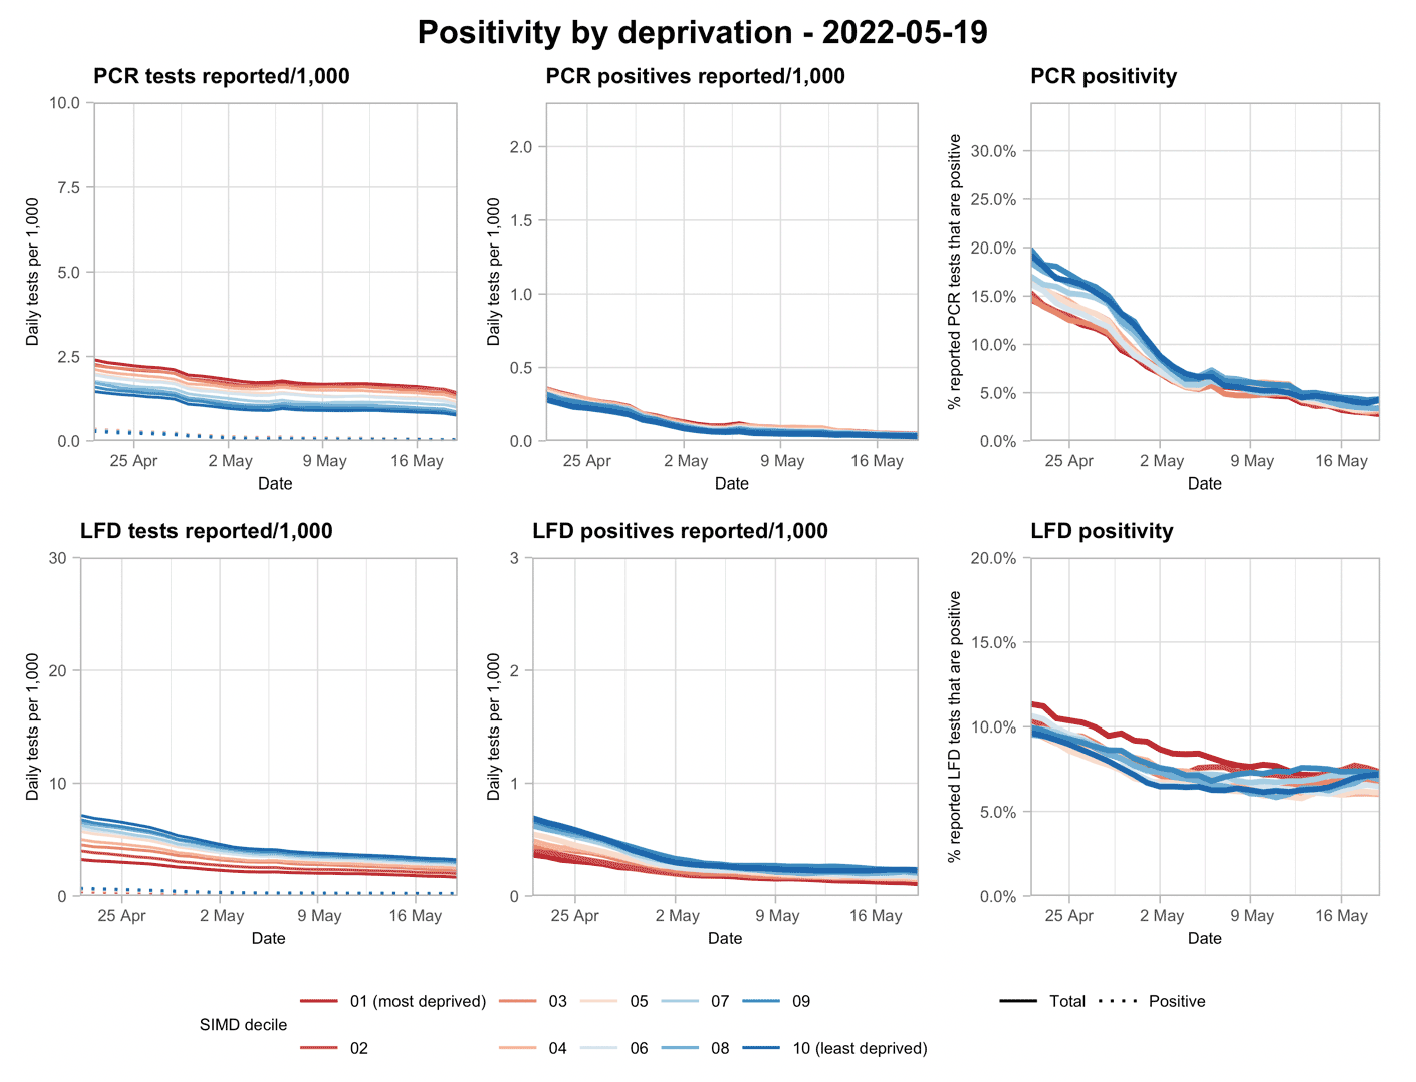
- The data show a continued decline in reported tests but increase in the overall positivity, and a slight increase in reported positives. This appears consistent across all deprivation deciles, with the slight "inversion" in LFD positivity with respect to deprivation (higher LFD positivity in the least deprived datazones, contrary to nearly all earlier periods of the epidemic) persisting. There is a slight rise in PCR positives and positivity, but the volume of testing is now very low.
- The distribution of lateral flow/LFD tests being reported continues to vary substantially by both age and deprivation status, with many fewer tests reported in younger adults across all deciles of deprivation, and for children in more deprived deciles. The high level of LFD positivity in the latter category is marked, and when compared to the high number of positives amongst the least deprived, is consistent with under ascertainment being concentrated (and in turn higher circulation than the cases data suggest) in particular groups.
- Nationwide, Covid-19 wastewater levels have remained between 50 and 100 million gene copies per person per day (Mgc/p/d) since the start of May, but there is variability in the data and the trend is uncertain.
What we know about how people's contact patterns have changed
Prior to the Covid-19 pandemic, the average daily contacts for adults in the UK were reported to be 10.8 from the UK-wide POLYMOD study[1].
Average contacts from the most recent wave of the Scottish Contact Survey (26th May - 1st June) indicate an average of 4.9 contacts. This has remained at a similar level compared to the previous wave of the survey (12th May - 18th May) where average contacts were 5.0, as seen in Figure 1.
Mean contacts within the work setting have increased in the last two weeks by 14% whereas contacts within the other setting (contacts outside home, school and work) have decreased by 13%. Contacts within the home have remained at a similar level over the same period.
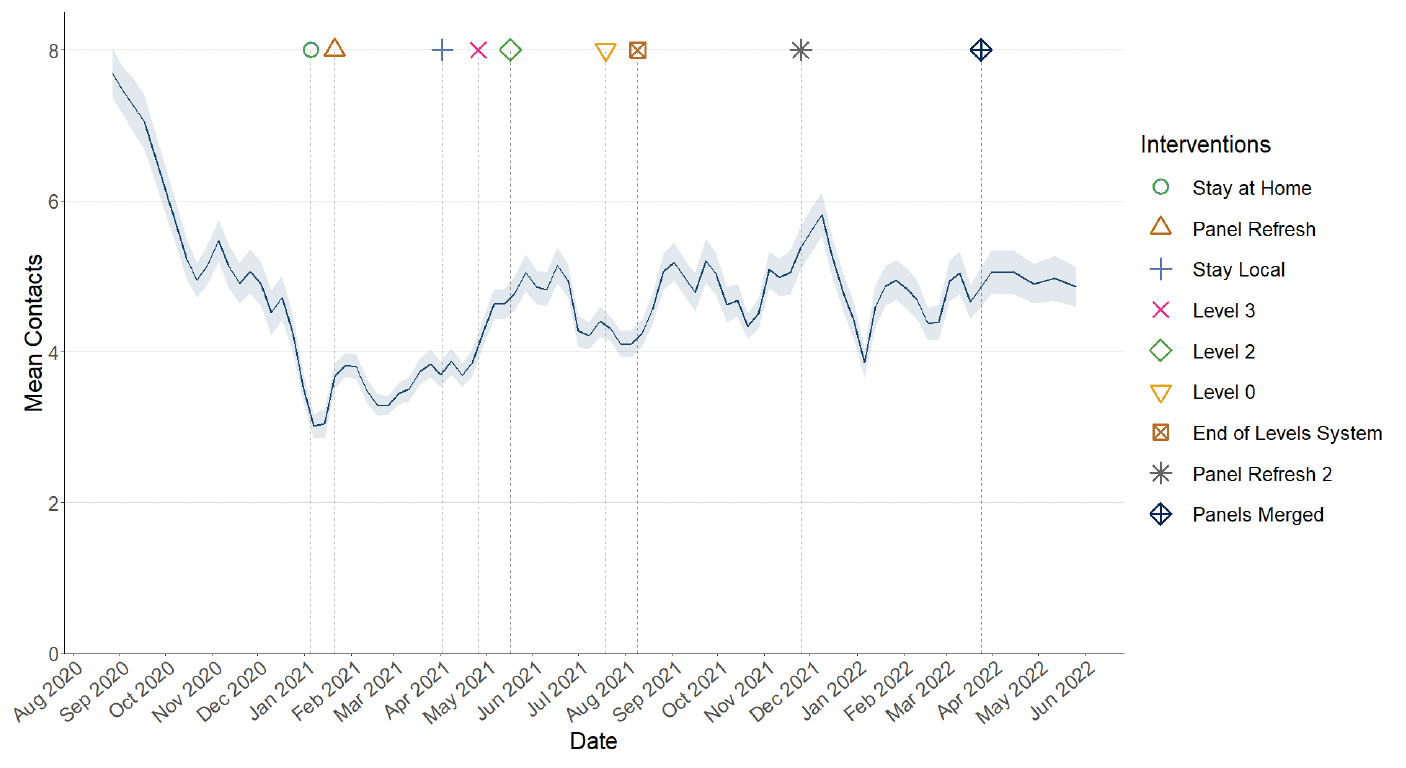
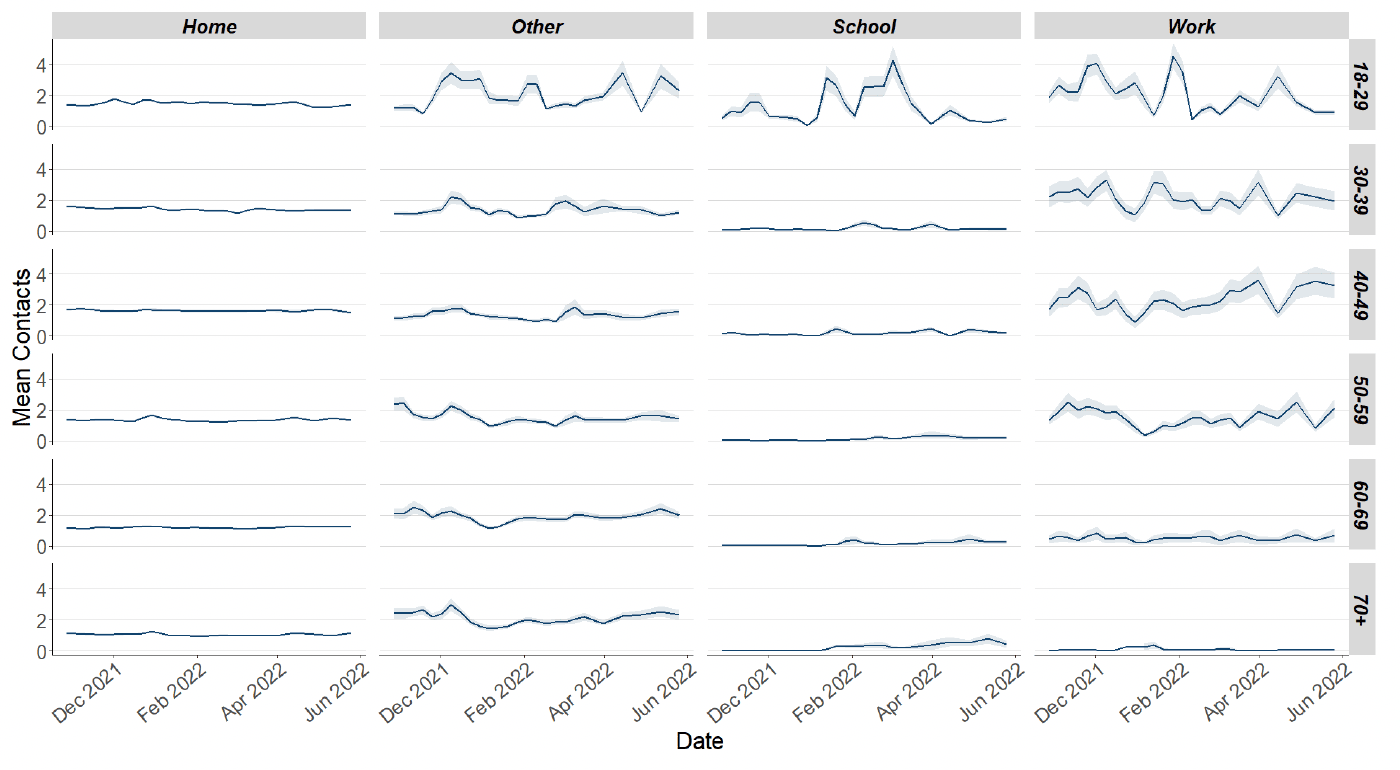
Figure 2 shows how contacts change across age group and setting. All individuals with the exception of those within the 50-59 age group have reported a decrease in contacts.
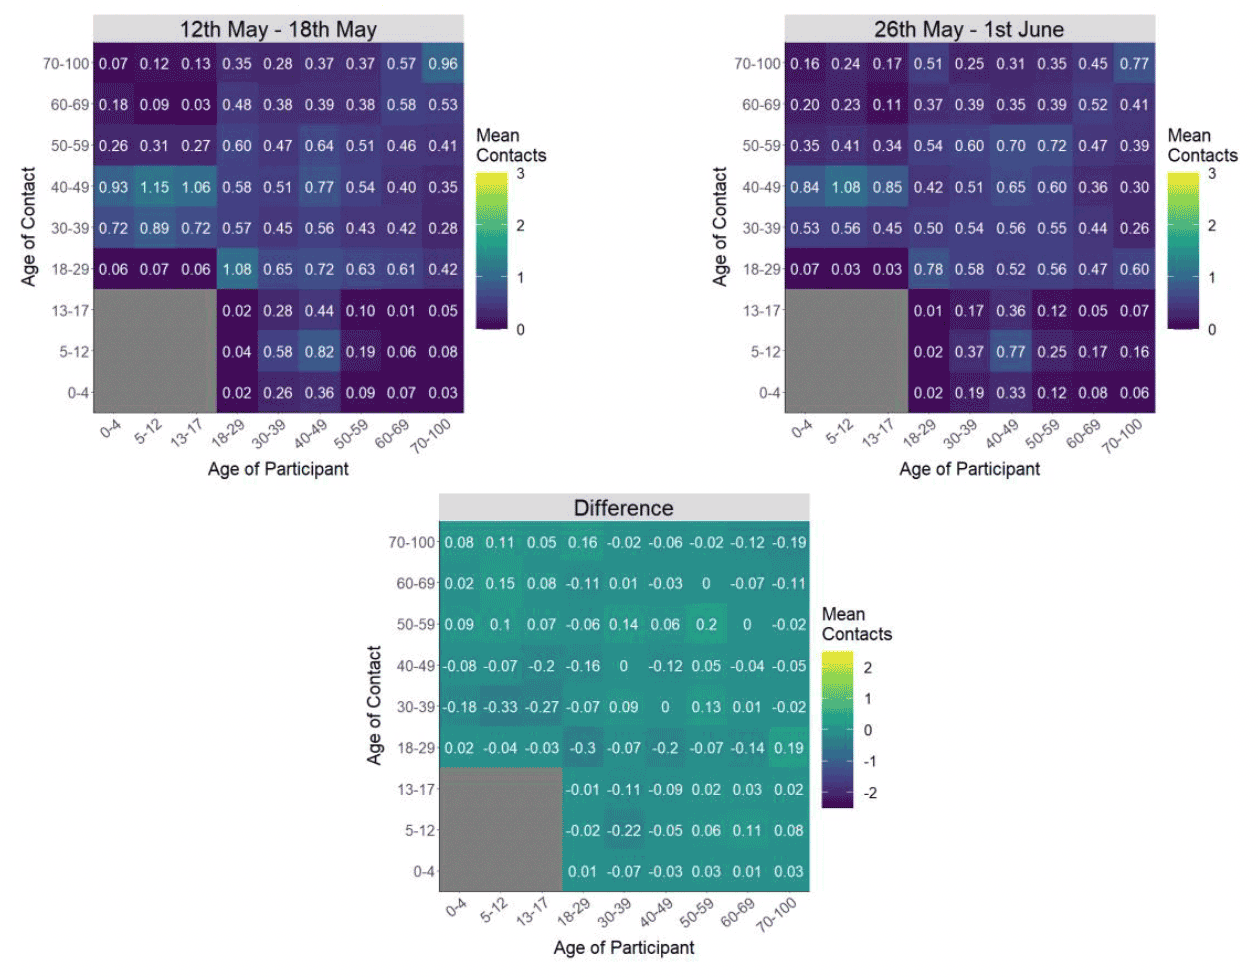
The heatmaps in Figure 3 show the mean overall contacts between age groups for the surveys relating to 12th May - 18th May and 26th May - 1st June and the difference between these periods. Those within the 18‑49 age group have reported a decrease in contacts with those aged under 18 whereas those aged over 49 have reported an increase in contacts with this age group.
The biggest changes in the proportion of participants visiting different locations is seen in those visiting a pub or restaurant. This increased from 50% to 54% in the last two weeks as shown in Figure 4.
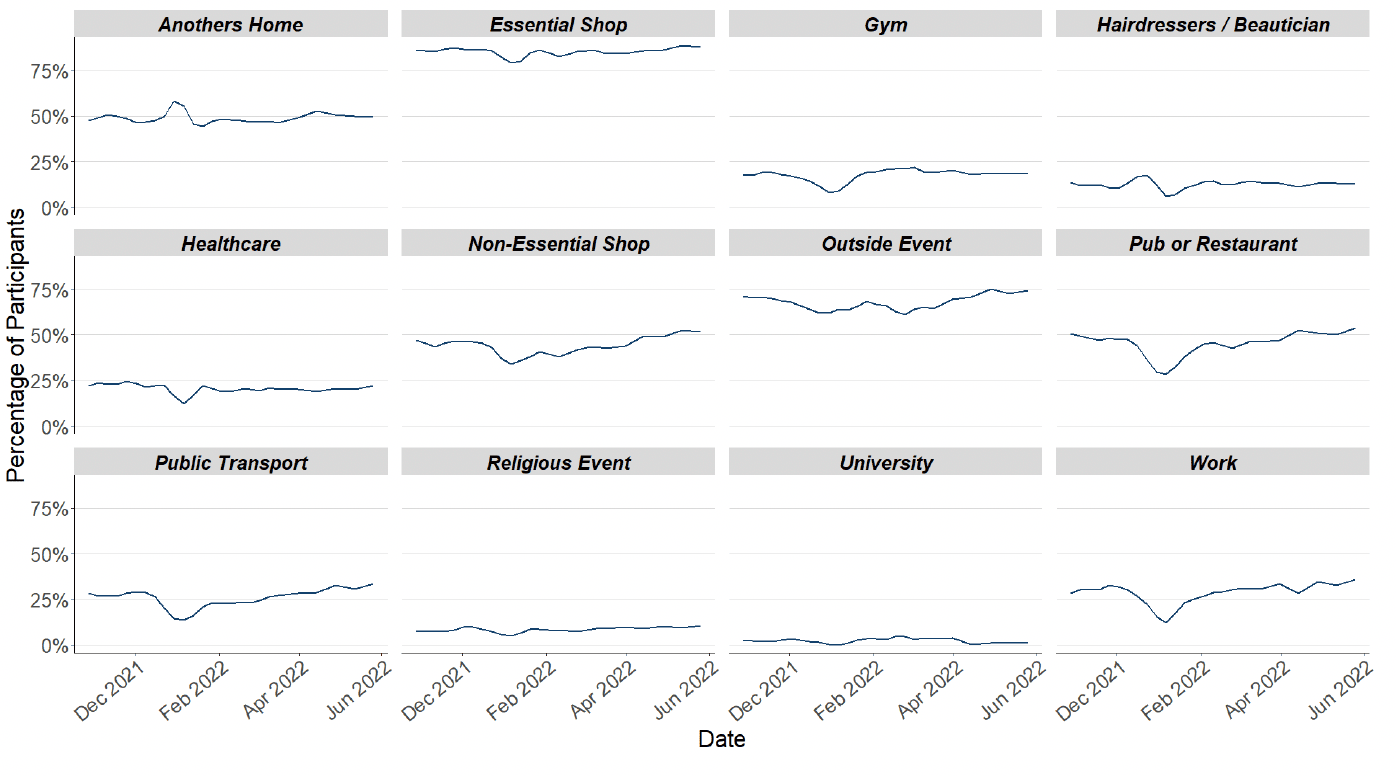
Figure 5 shows the percentage of people wearing a face covering where they have at least one contact outside of the home. This has decreased from 48% to 38% since the last wave of the survey.
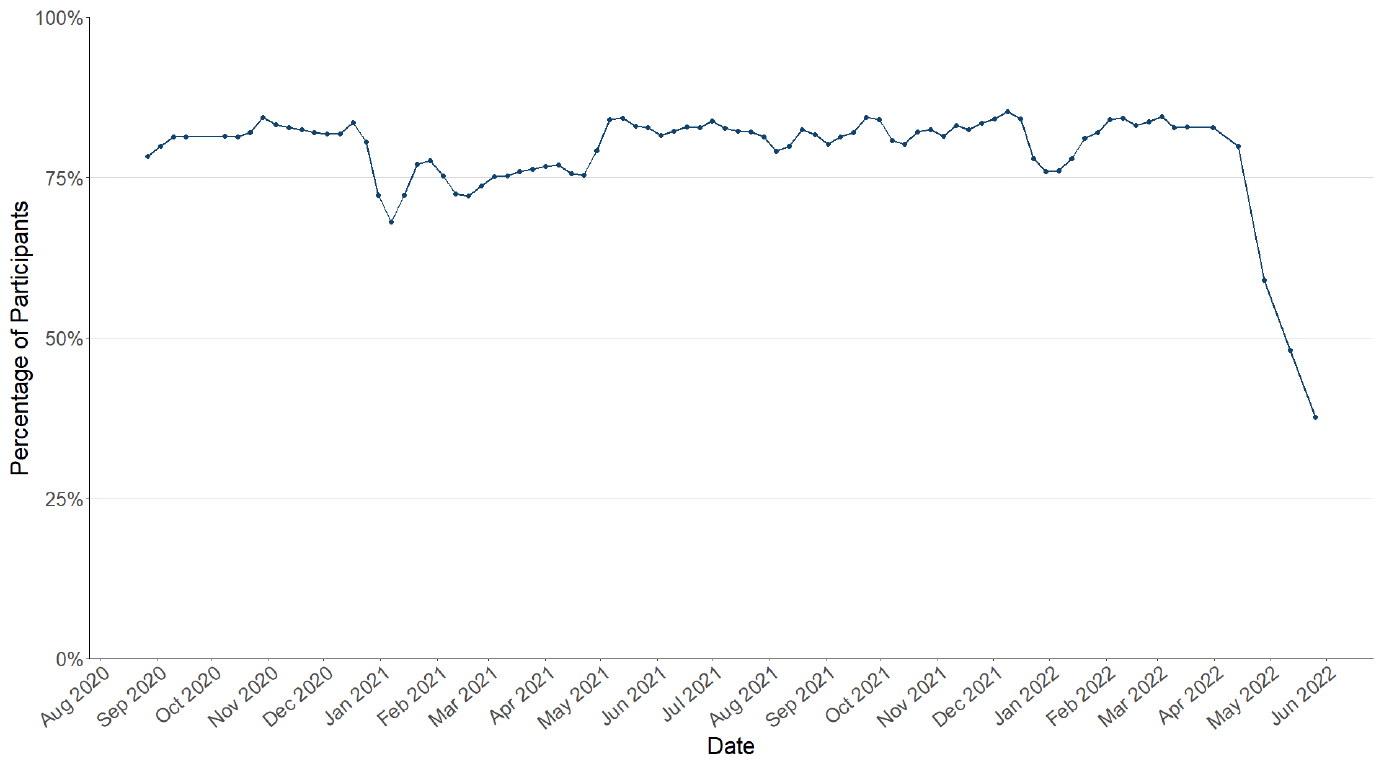
In the survey pertaining to 26th May - 1st June, 37% of people had taken at least one lateral flow test in the previous 7 days, decreasing from 40% in the previous wave of the survey pertaining to the 12th May - 18th May.
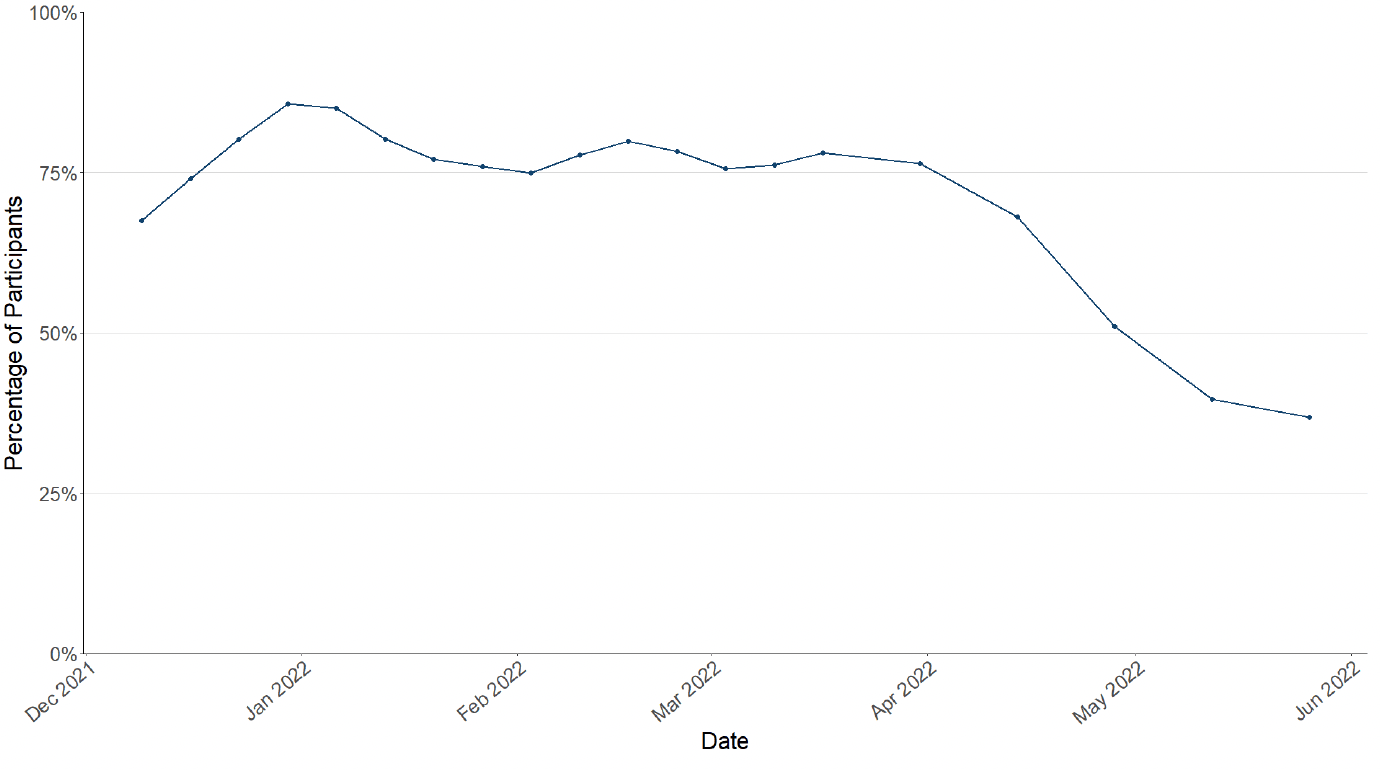
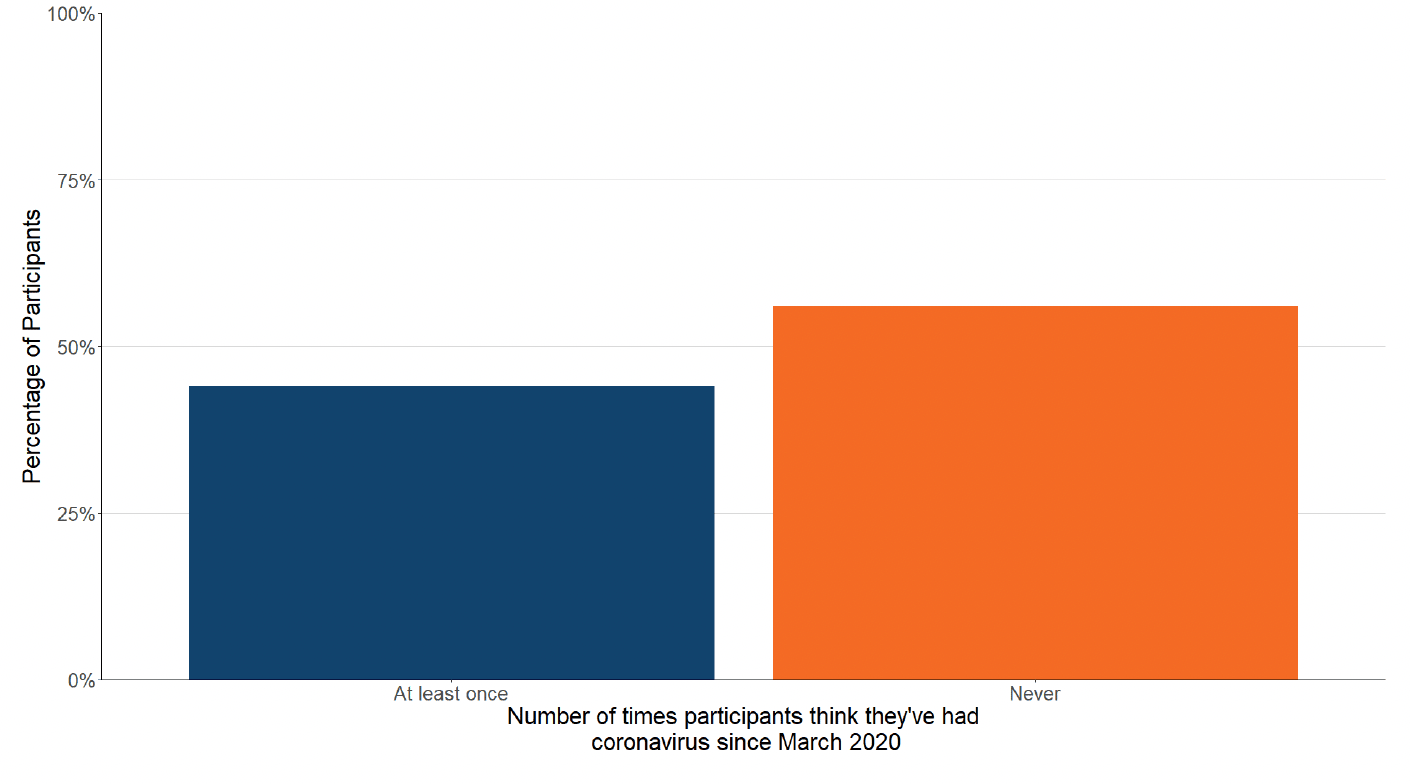
Figure 7 shows that 44% of participants believe they have had Covid-19 at least once since March 2020. Of those who think they have had Covid-19, 95% have had this confirmed through a test.
Summary of spatial analysis of Covid-19 spread in Scotland
Researchers at the Edinburgh Roslin Institute have conducted spatial analysis of COVID-19 Spread in Scotland. A summary of findings from 22nd May to 5th June 2022 is included here.
There remains a substantial variation in risk of infection by average census age in each datazone. Deprivation in this period is not a substantial factor when comparing across local authorities.
The trend where numbers of PCR and LFD tests are both declining, continues across all deprivation scores.
The distribution of lateral flow/LFD tests being reported varies substantially by both age and deprivation status, with many fewer tests reported in younger adults across all deciles of deprivation, and for children in more deprived deciles. The high level of LFD positivity in the latter category is marked, and when compared to the high number of positives amongst the least deprived, suggests that ascertainment may be lower in younger people in deprived areas.
What can analysis of wastewater samples tell us about local outbreaks of Covid-19 infection?
Levels of Covid-19 RNA in wastewater (WW) collected at a number of sites around Scotland are adjusted for population and local changes in intake flow rate (or ammonia levels where flow is not available). See Technical Annex in Issue 34 of Scottish Government Research Findings for the methodology. These reports are based on the most recent data available. Future updates to data may lead to small retrospective changes.
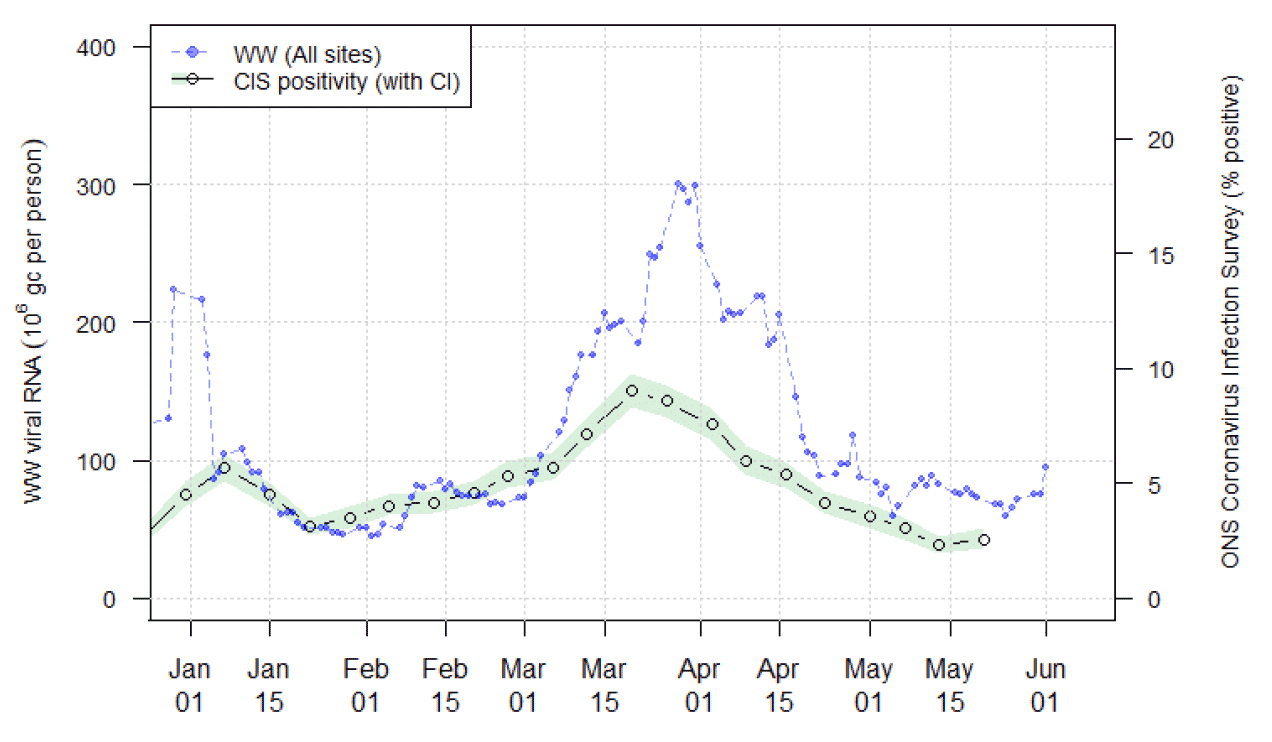
Nationwide, Covid-19 wastewater levels have remained between 50 and 100 million gene copies per person per day (Mgc/p/d) since the start of May 2022, but there is variability in the data and the trend is uncertain.
There was a reduction in the number of samples collected and a delay in analysing samples due to the recent public holiday. For the same reason, the most recent update to the ONS Coronavirus Infection Survey (CIS) is the one published on 27th May covering the period up to 21st May.
We have observed that some recent analysis runs give systematically higher or lower values than other runs. This sort of bias increases uncertainty. We are exploring possible future adjustments.
We show in Figure 10 national running average trends in wastewater Covid-19 as of 1st June 2022. The figure shows an apparent increase in viral levels in the most recent set of samples that were collected on 1st June and analysed on 2nd June. However, this may be attributable to the variability in the data.
What next?
UKHSA is expected to provide a consensus statement in the week beginning 20th June. We will therefore continue our modelling outputs which are reliant on UKHSA consensus positions in our next publication.
Archiving of models is currently being undertaken via the Data Science Scotland GitHub organisation. Details of the Canna Model has most recently been made available. More models will be added over the coming weeks - see the Technical Annex of issue 96 for further details.