Seabird flight height data collection at an offshore wind farm: final report
Understanding seabird flight heights and behaviour in and around operational offshore wind farms is a priority knowledge gap. Using aircraft mounted LiDAR technology, this study collected data on seabird flight height and shows the potential for using it in offshore windfarm impact assessments.
3. Results
The raw species count results and the distribution maps were calculated (Appendix III).
3.1 Comparing Flight Height in the Different Study Areas
The flight height of each of the core bird species were identified in the imagery-LiDAR system (Figure 3; Figure 4). Data were presented in the lowest species or group level the individual was identified to except for large gull which were grouped because of low sample sizes. In June only two groups (kittiwake, large gull) were detected in the survey, whereas all species of interest were recorded in July.
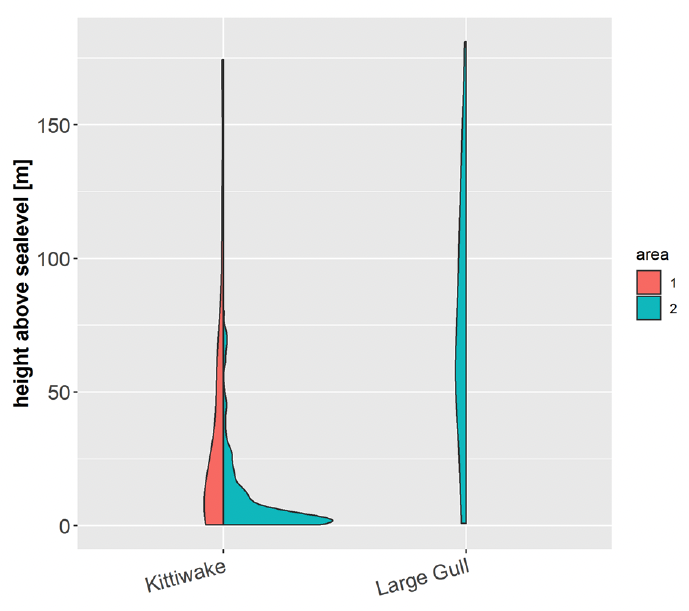
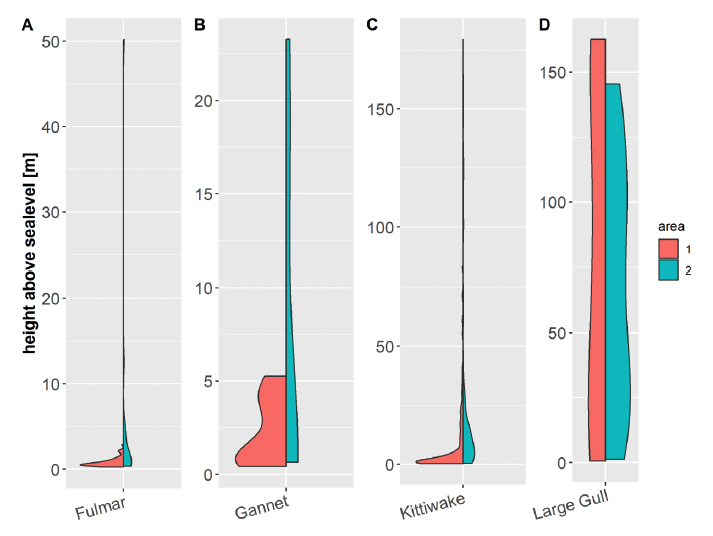
Statistical tests were performed to study the difference in flight height between Survey Area 1 and Survey Area 2 for all four core species combined (fulmar, kittiwake, gannets and large gulls) and for each species separately. For all species the mean height above sea surface level was 11.32 m (SD= 26.61) in Survey Area 1 and 20.03 m (SD= 33.73) in Survey Area 2. The Wilcoxon rank sum test with continuity correction showed highly significant results between the flight height of Survey Area 1 and Survey Area 2 for all four species (p=<0.001).
For the four species analysed separately significant and highly significant differences were found in the flight height of kittiwakes and gannets. There was no difference for fulmars and large gulls. The number of detected species were low in both areas for some areas (kittiwakes (Survey Area 1 = 220, Survey Area 2 = 413), fulmars (Survey Area 1 = 70, Survey Area 2 = 45, gannet (Survey Area 1 = 17, Survey Area 2 = 41) and large gull (Survey Area 1 = 8, Survey Area 2 = 37).
| Total detected Area 1 |
Total detected Area 2 |
Mean height Survey Area 1(m) |
SD |
Mean height Survey Area 2 (m) |
SD |
P value |
|
|---|---|---|---|---|---|---|---|
| Kittiwake |
220 |
413 |
12.49 |
24.87 |
17.84 |
30.83 |
<0.001 |
| Fulmar |
70 |
45 |
1.72 |
5.34 |
3.53 |
7.89 |
0.053 |
| Gannet |
17 |
41 |
2.45 |
2.96 |
12.89 |
18.44 |
0.004 |
| Large gull |
8 |
37 |
81.92 |
72.49 |
72.40 |
48.05 |
0.870 |
3.2 Modelling fight height in relation to WTG distance
3.2.1 All species combined
The results of the flight height of each species relative to the distance to the nearest WTG in Survey Area 1 are shown in Figure 5. There was a slight tendency for birds flying higher closer to the WTG. However, the closest bird recorded to a WTG was at a distance of 44 m and the second closest bird was at a distance of 189 m, furthermore, the sample of birds of interest in Survey Area 1 in the two survey months was low (n= 315).
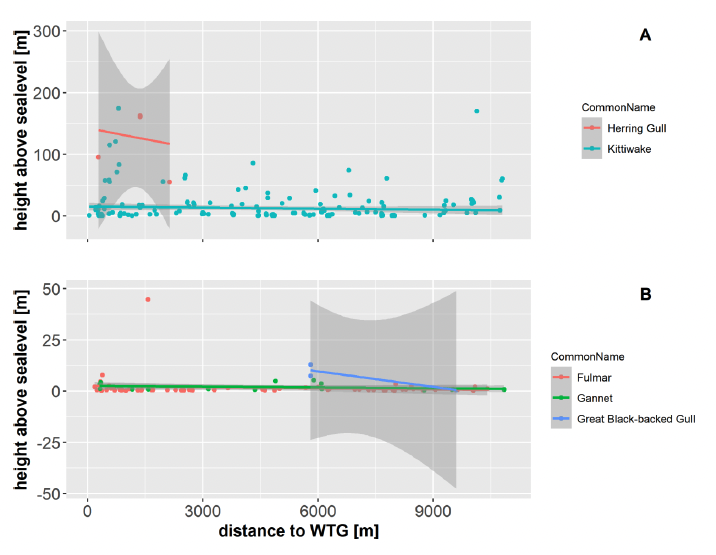
For the combined species a linear mixed model (LMM) was conducted for the LiDAR flight heights with distance to nearest WTG and random effects were included for species type and survey month. A plot of the model shows that height does not vary with distance to WTG, demonstrated by the straight line through the plot.
The model output suggests there was no relationship between the fixed variable of distance from WTGs (DistanceScaled) and the height relative to sea surface level (BirdZ_SeaL), with a p-value of 0.427.
The model fit is evaluated with a residual and a Q-Q plot (Appendix IV). Residual plots show the difference between predicted and actual data and therefore the error in the predicted values. Visually this should represent a random cloud of points around zero with no general pattern in the data. This is similar to our data showing a reasonable error for our models. The Q-Q plot gives an indication of the distribution of residuals of the model (i.e., if they are normally distributed). In the best case, the points of a model would match a diagonal straight 45degree line. If the pattern of the data is deviating from this line, then the model is not presenting the data in full, however, it is important to evaluate the amount of this deviation and a low deviation is generally expected. For this data the model fit is generally good as the points are fitting the lines well for most of the data. However, the data is lightly tailed to the right and left sides indicating that the model doesn't predict extreme values equally well. However, the overall fit of the model is good.
The model output can be explained by the fact that the different species are behaving differently, and separate models are needed at species level. Additionally, the results can be explained by the low sample size and the lack of birds recorded in the close proximity of the WTGs.
3.2.2 Kittiwake
A generalized linear mixed model (GLMM) was used to analyse the flight height against the distance to the closest WTG for kittiwakes. A random effect for month was included in the model and residual and Q-Q line plots were reported (Appendix IV). There is no significant effect of the distance to WTGs (p = 0.540).
In the residual plot for kittiwakes, two clouds can be observed indicating a lack of observed data in some parts. However, the spread of data for lower fitted values could indicate heteroscedasticity, which is not clear as there are two disconnected clouds. The Q-Q plot is showing a good fit for medium values, however a slightly worse fit for large values and the worst fit for very small values. These results could be driven by the fact there were likely two types of behaviours recorded. A large number of kittiwakes were recorded very close to the surface and a smaller amount of birds in flight at higher altitudes and few birds were recorded in between. For future analysis this difference in bird behaviour should potentially be considered.
3.2.3 Fulmar
Fulmars were detected in June and July and a LMM was performed to study the effect of flight height to the distance of the nearest turbine (Appendix IV). There was no correlation between the flight height and the distance to the nearest turbine (p = 0.399). The residual plot for fulmars is generally centred as a random cloud around zero with one outlier. Model fit in the Q-Q plot is good for medium values with a slightly worse fit for the extreme values. There is no large effect of the outlier and the model should be a good representation of the data. However, birds were detected too far away from the WTGs to study the relationship of distance to the flight height of the birds. The closest fulmar was detected 189.4 m away from the WTGs.
3.2.4 Gannet
A LMM was performed for gannets to study the effect of flight height to the distance of the nearest turbine (Appendix IV). There was a significant correlation between the flight height and the distance to the nearest turbine (p < 0.001) with Gannets flying lower closer to the WTGs. The residual plot is showing a clear pattern and one outlier and Q-Q plots are heavy-tailed. The low sample size and lack of birds recorded close to OWF is limiting the conclusions which can be drawn from this model. Comparing flight height against the distance to nearest WTGs shows that a larger sample size is needed for more robust results.
3.2.5 Large Gull
Large gulls were only detected in July and a LM was performed to study the effect of flight height to the distance of the nearest turbine (Appendix IV). There was a significant correlation between the flight height and the distance to the nearest turbine (p =0.002). Large gulls are showing the opposite effect than the other species with higher flight height closer to the WTGs. However, the sample size is very low (n=8) and the Q-Q plot shows a heavy-tailed fitted line. Visual examination of Figure 5 for large gulls shows that there is an indication that there could be an underlying effect. However, a higher sample size is needed for a more robust evaluation.
Contact
Email: REEAadmin@gov.scot