Collaborative and Compassionate Cancer Care: cancer strategy for children and young people 2021–2026

This Managed Service Network (MSN) for Children and Young People with cancer (CYPC) strategy celebrates the achievements to date as well as setting out ambitions for the coming 5 years.


Section 2 - The Current Landscape

Within Scotland when a child or young person is diagnosed with cancer or a condition which may lead to cancer, healthcare staff record details regarding the diagnosis and the treatments received. This information is then recorded within the national Scottish Cancer Registry. This service is provided by Public Health Scotland. By collecting information nationally, health care services can plan and improve care for patients in the future. National cancer incidence statistics are published annually, with the next report to be published later in September 2021.

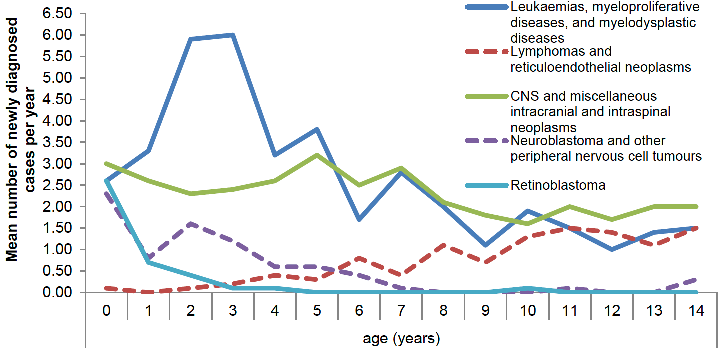
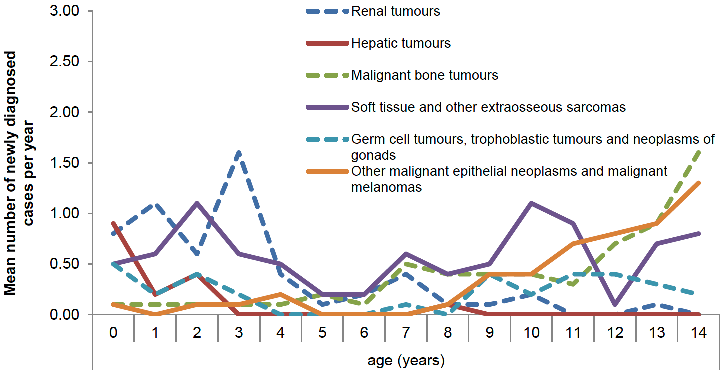
Whereas the Scottish Cancer Registry regularly publishes data on cancer at all ages, the classification used (the 10th edition of the International Classification of Diseases or ICD-10) is more suited to adult cancers. These cancers are classified primarily by the part of the body where the cancer is located; whereas cancers in children and young people are more appropriately classified by the type of tumour (i.e. which cell types are involved). Therefore to ensure appropriate reporting and recording for children and young people the MSN CYPC and NHS National Services Scotland in partnership began publishing annual reports based on the type of tumour and also developed an 'Enhanced Cancer Registry' to support the appropriate recording of childhood related cancers.

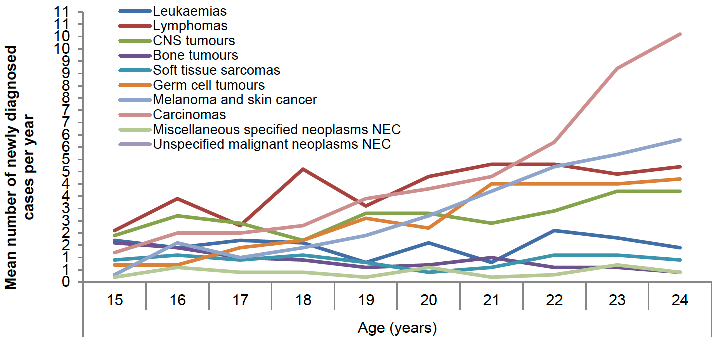
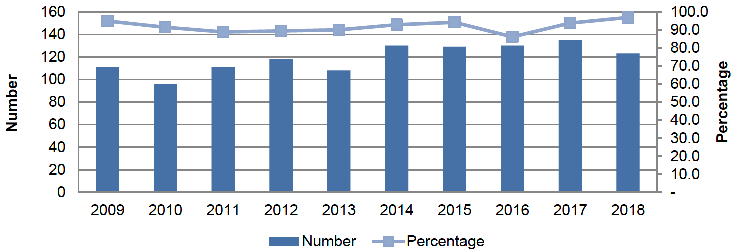
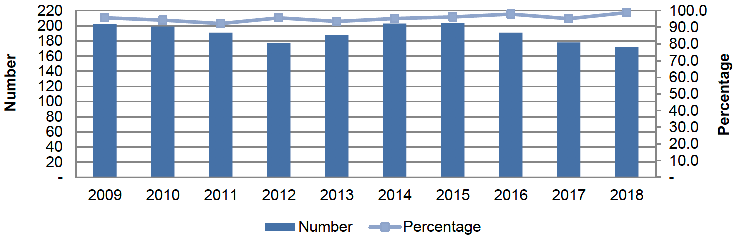
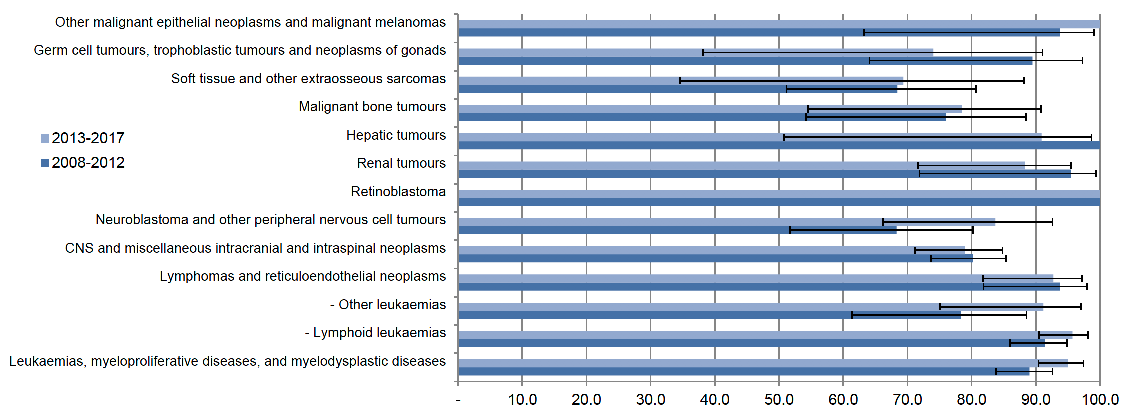
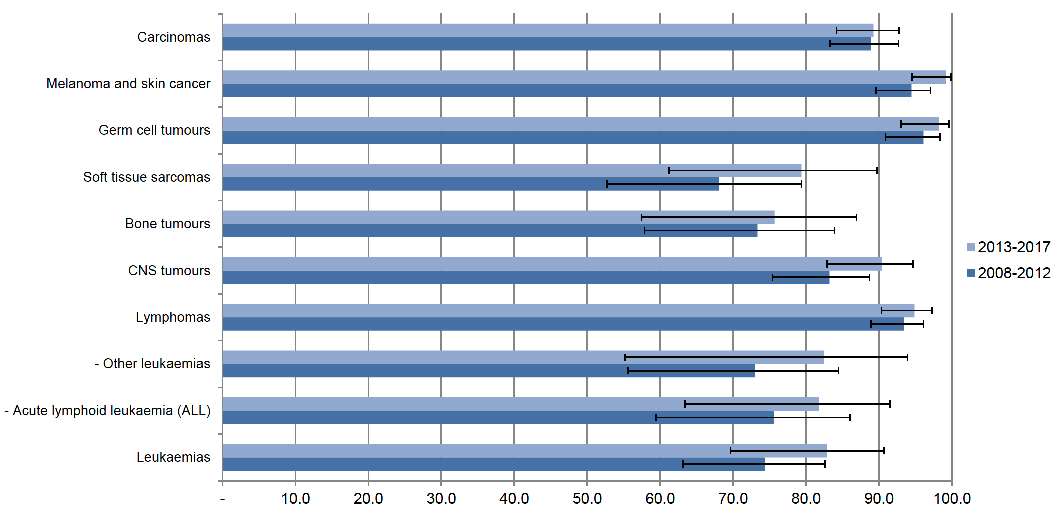
In February 2019 the first jointly produced 10 year report (2007-2016) on occurrence and outcomes of cancer in children (0-14 years) and young people (15-24 years) in Scotland was published (NHS National Services, 2019). The most recent report, published in September 2020, demonstrates that cancer in children and young people is rare, accounting for <1.5% of the cancer burden. In the ten year period 2009-2018, 1,298 children (ages 0-14, 53% male) were diagnosed with some form of cancer. Amongst 15-24 year olds 1,996 (51% female) were diagnosed with some form of cancer. The most common cancer diagnoses in children were leukaemia (31%) and central nervous system tumours (27%), while in the older group lymphomas (19%), melanomas and skin cancers (14%) predominate; with all carcinomas combined forming the largest group (22%). One year survival rates have remained fairly stable, with the most recent figures (patients diagnosed between 2013 and 2017) at around 93.6% for children and 96.7% for young people. Scotland has over 5,000 children and young people who have survived a diagnosis of cancer after 1999 (Public Health Scotland, 2020). Their ongoing health care needs form part of this strategy.

Stepwise improvements in treatments mean that most children and adolescents can be cured of their disease, with five year survival around 88% in children and 92% in young people for those diagnosed in 2013-2017. For teenagers and young adults, carcinomas continue to lag behind successes in haematological malignancies and germ cell tumours. With around 41 deaths each year (stable), cancer remains the leading cause of disease related death in children and young people in Scotland (Royal College of Paediatrics and Child Health, 2020). Our outcomes are comparable to England and our data was part of the first UK report published in 2021 on cancer outcomes for children and young people (Public Health England, 2021).

The following data presented have been provided by Public Health Scotland and provides information relating to cancer incidence and survival rates for children and young people within Scotland. Cancer registration is a dynamic process therefore the data presented may be subject to future change.

Figures 1 and 2 – Children Aged 0-14: Mean Number of Cancer [6] Diagnoses per Year by Age and Diagnostic Grouping, [7] Scotland, 2009-2018
Figure 1 shows a graph the mean number of newly diagnosed cases per year by age in Scotland between 2009-2018, for children aged 0-14. Along the X axis is age in years, reading from 0 to 14. Along the Y axis is the mean number of newly diagnosed cases per year, moving in 0.5 decimals from 0.00 to 6.50. There are 5 categories of lines displayed on the graph to show the difference between cancer types. Line 1 represents Leukaemias, myeloproliferative diseases and myelodysplastic diseases. It starts at 2.50 for age 0, peaks at 6.00 for ages 2 and 3, before falling to 3.00 by age of 4 and slowly levelling out to 1.50 by age 14. Line 2 represents Lymphomas and reticuloendothelial neoplasms. It starts at just above 0.00 for age 0, and over the course of the age groups slowly increases, peaking at around 1.50 by age 14. Line 3 represents CNS and miscellaneous intracranial and intraspinal neoplasms. It starts at 3.00 for age 0 and curves down and back to peak at 3.00 again for age 5, before declining to 2.00 for age 14. Line 4 represents Neuroblastoma and other peripheral nervous cell tumours. It starts at just under 2.50 for age 0, and falls to 0.00 by age 8 and remains there until age 14, where it rises to between 0.00 and 0.50. Finally, Line 5 represents Retinoblastoma. It starts at 2.50 for age 0 and falls away rapidly to 0.00 by age 5, staying there or close to there until age 14.
Figure 2
Figure 2 shows a graph the mean number of newly diagnosed cases per year by diagnostic grouping in Scotland between 2009-2018, for children aged 0-14. Along the X axis is age in years, reading from 0 to 14. Along the Y axis is the mean number of newly diagnosed cases per year, moving in 0.5 decimals from 0.00 to 3.00. There are 5 categories of lines displayed on the graph to show the difference between diagnostic grouping. Line 1 represents Renal tumours. It shows a starting point of just under 1.00 for age 0, peaks at 1.50 for age 3 before rapidly decreasing to under 0.50 for age 4. It only varies slightly from then on, reaching 0.00 at both age 12 and 14. Line 2 represents Hepatic Tumours. It shows a starting point of just under 1.00 for age 0 and immediately drops to just above 0.00 for ages 1 and 2. From age 3 onwards it remains at 0.00, only appearing slightly above this at age 8. Line 3 represents Malignant bone tumours. This starts at just above 0.00 for age 0, and stays here until age 6. At age 7 it hits 0.50, before increasing constantly until age 14 where it peaks at 1.50. Line 4 represents Soft tissue and other extraosseous sarcomas. This starts at 1.50 for age 0, and peaks and troughs for the whole graph. Peaks include just above 1.00 for ages 2 and 10, and lows show between 0.00 and 0.50 for ages 2 & 3 and near 0.00 for age 12. It ends slightly above 0.50 for age 14. Line 5 represents Germ cell tumours, trophoblastic tumours and neoplasms of gonads. This starts at 0.50 for age 0, and this is the peak. From then until age 14 it fluxuates between just below this peak, and 0.00, ending at the midway point between these two. Finally, Line 6 represents Other malignant epithelial neoplasms and malignant melanomas. It starts just above 0.00 for age 0 and continues to be between this and 0.00 until age 7. From then, it steadily increases until peak at age 14 at between 1.00 and 1.50.
Figure 3 – Young People Aged 15-24: Mean Number of Cancer [6] Diagnoses per Year by Age and Diagnostic Grouping, [8] Scotland, 2009-2018
Figure 3 shows a graph the Mean Number of Cancer Diagnoses per Year by Age and Diagnostic Grouping in Scotland between 2009-2018, for young people aged 15-24.  Along the X axis is age in years, reading from 15 to 24. Along the Y axis is the mean number of newly diagnosed cases per year, reading from 0 to 11. There are 10 categories of lines displayed on the graph to show the difference between diagnostic grouping. Line 1 represents Leukaemias, and shows a fairly stable line intermixing between 1 and 2 for all ages. Line 2 represents Lymphomas, and shows 2 for age 15, rising to a peak of 5 for age 18, falls to 3 for age 19 but then rises steadily to end at peak of 5 again at 24. Line 3 represents CNS tumours and shows 2 for age 15 and fluctuates with a generally upward trajectory, ending at age 24 at 3. Line 4 represents Bone tumours and shows 2 cases per year at age 15, which slowly reduces over time to age 24 having 1. Line 5 represents Soft tissue sarcomas and shows a broadly steady line staying between 1 and 2 throughout the ages. Line 6 represents Germ cell tumours starts at 1 for age 15, but steadily rises over the length of the graph, peaking at 4 for age 24. Line 7 represents Melanoma and skin cancer and starts at 0 for age 15, and steadily rises throughout to peak at 6 by age 24. Line 8 represents Carcinomas and shows a starting point of 1 for age 15, and rapidly rises across the graph and peaks at 10 by age 24. Line 9 represents Miscellaneous specified neoplasms NEC and shows a steady line between 0 and 1 for the length of the graph. Finally, Line 10 represents Unspecified malignant neoplasms NEC is not displayed.
Figure 4 – Children Aged 0-14: Microscopically Verified Cancer [6] Diagnosis by Year of Diagnosis, Scotland, 2009-2018 ( Males and Females combined)
Figure 4 shows a bar chart for Children Aged 0-14 showing Microscopically Verified Cancer Diagnosis by Year of Diagnosis in Scotland between 2009-2018. Along the X axis is years, ranging from 2009 to 2018 and representing the bars. The Y axis is the number of diagnosis, ranging from 0 to 160. Percentages are also displayed on the opposite axis, represented by a line above the bars. 2009 shows 110 diagnoses, which is approx. 96%. 2010 shows 95 diagnoses, which is approx. 92%. 2011 shows 110 diagnoses, which is approx. 90%. 2012 shows just under 120 diagnoses, which is approx. 90%. 2013 shows just over 100 diagnoses, which is approx. 90%. 2014 shows 130 diagnoses, which is approx. 95%. 2015 shows 130 diagnoses, which is approx. 96%. 2016 shows 130 diagnoses, which is approx. 88%. 2017 shows just under 140 diagnoses, which is approx. 95%. 2018 shows just over 120 diagnoses, which is approx. 98%.
Figure 5 – Young People Aged 15-24: Microscopically Verified Cancer [6] Diagnosis by Year of Diagnosis, Scotland, 2009-2018 ( Males and Females combined)
Figure 5 shows a bar chart for Young People Aged 15-24 showing Microscopically Verified Cancer Diagnosis by Year of Diagnosis in Scotland between 2009-2018. Along the X axis is years, ranging from 2009 to 2018 and representing the bars. The Y axis is the number of diagnosis, ranging from 0 to 220. Percentages are also displayed on the opposite axis, represented by a line above the bars. 2009 shows 200 diagnoses, which is approx. 95%. 2010 shows 200 diagnoses, which is approx. 94%. 2011 shows 190 diagnoses, which is approx. 92%. 2012 shows just under 180 diagnoses, which is approx. 95%. 2013 shows just over 180 diagnoses, which is approx. 93%. 2014 shows 200 diagnoses, which is approx. 95%. 2015 shows 200 diagnoses, which is approx. 96%. 2016 shows 190 diagnoses, which is approx. 98%. 2017 shows just under 180 diagnoses, which is approx. 95%. 2018 shows just over 170 diagnoses, which is approx. 98%.
Figure 6 – Children Aged 0-14: Cancer [6] survival [9] by Diagnostic Grouping [7,10,11] and Period of Diagnosis, Scotland, 2008-2017 [12] ( Observed (Kaplan-Meier) survival (%) at 5 years following diagnosis,[13] with 95% confidence intervals[14] and result of chi-squared test for trend by year of diagnosis
Figure 6 shows a bar chart, for Children Aged 0-14, Cancer survival by Diagnostic Grouping and Period of Diagnosis in Scotland between 2008-2017. The X axis contains the survival %, ranging from nil to 100. The Y axis contains the bars, split into grouping for 2008-2012 and 2013-2017 for the diagnostic grouping. There are 13 diagnostic groupings. For Leukaemias, myeloproliferative diseases, and myelodysplastic diseases it shows 95% for 2013-2017, and approx.. 89% for 2008-2012. For Lymphoid leukaemias it shows 95% for 2013-2017, and approx.. 91% for 2008-2012. For Other leukaemias it shows approx. 91% for 2013-2017, and approx.. 78% for 2008-2012. For Lymphomas and reticuloendothelial neoplasms it shows approx. 93% for 2013-2017, and approx. 94% for 2008-2012. For CNS and miscellaneous intracranial and intraspinal neoplasms it shows approx. 79% for 2013-2017, and approx. 80% for 2008-2012. For Neuroblastoma and other peripheral nervous cell tumours it shows approx. 84% for 2013-2017, and approx. 68% for 2008-2012. For Retinoblastoma it shows approx. 100% for 2013-2017, and approx. 100% for 2008-2012. For Renal tumours it shows approx. 88% for 2013-2017, and approx. 95% for 2008-2012. For Hepatic tumours it shows approx. 91% for 2013-2017, and approx. 100% for 2008-2012. For Malignant bone tumours it shows approx. 78% for 2013-2017, and approx. 76% for 2008-2012. For Soft tissue and other extraosseous sarcomas it shows approx. 69% for 2013-2017, and approx. 68% for 2008-2012. For Germ cell tumours, trophoblastic tumours and neoplasms of gonads it shows approx. 74% for 2013-2017, and approx. 89% for 2008-2012. For Other malignant epithelial neoplasms and malignant melanomas it shows approx. 100% for 2013-2017, and approx. 93% for 2008-2012.
Figure 7– Young People Aged 15-24: Cancer [6] survival [9] by Diagnostic Grouping [8,15,11] and Period of Diagnosis, Scotland, 2008-2017 [12] ( Observed (Kaplan-Meier) survival (%) at 5 years following diagnosis, with 95% confidence intervals[14] and result of chi-squared test for trend by year of diagnosis)
Figure 7 shows a bar chart, for Young People Aged 15-24, Cancer survival by Diagnostic Grouping and Period of Diagnosis in Scotland between 2008-2017. The X axis contains the survival %, ranging from nil to 100. The Y axis contains the bars, split into grouping for 2008-2012 and 2013-2017 for the diagnostic grouping. There are 10 diagnostic groupings. For Leukaemias it shows approx. 82% for 2013-2017, and approx. 74% for 2008-2012. For Acute Lymphoid Leukaemia (ALL) it shows approx. 81% for 2013-2017, and approx. 75% for 2008-2012. For Other leukaemias it shows approx. 82% for 2013-2017, and approx. 73% for 2008-2012. For Lymphomas it shows approx. 95% for 2013-2017, and approx. 94% for 2008-2012. For CNS tumours it shows approx. 90% for 2013-2017, and approx. 83% for 2008-2012. For Bone tumours it shows approx. 75% for 2013-2017, and approx. 73% for 2008-2012. For Soft tissue sarcomas it shows approx. 79% for 2013-2017, and approx. 68% for 2008-2012. For Germ cell tumours it shows approx. 98% for 2013-2017, and approx. 96% for 2008-2012. For Melanoma and skin cancer it shows approx. 99% for 2013-2017, and approx. 94% for 2008-2012. For Carcinomas it shows approx. 89% for 2013-2017, and approx. 88% for 2008-2012.

"I would like to say thank you for the amount of time that has gone into creating this, the fact that the Youth Advisory Forum is being heard and is going to make a difference. It is incredibly rewarding and I am honoured to be able to be a part of it. With this new strategy I have hopefully been able to make a difference for future young people going through cancer"

MSN CYPC Youth Advisory Forum Member

Contact

Email: CancerPolicyTeam@gov.scot

Back to top