Children's social work statistics: 2019 to 2020
Children's social work statistics for Scotland for 2019 to 2020, including data on children and young people looked after, on the child protection register and in secure care.
Children Looked After
The total number of children looked after has increased for the first year after seven years of consecutive decline.
The number of children starting to become looked after decreased by 9%, compared with 2019.
The number of children ceasing to be looked after decreased by 18%, compared with 2019.
This section presents data on looked after children from 1 August 2019 to 31 July 2020. This is referred to as 2020 for ease of reporting, with 2018-19 referred to as 2019, and so on.
Local authorities have a responsibility to provide support to certain children and young people, known as 'looked after children'. A child may become looked after for a number of reasons, including neglect, abuse, complex disabilities requiring specialist care, or involvement in the youth justice system.
At 31 July 2020, there were 14,458 looked after children – an increase of 196 (1%) from 2019. This is the first year of increase after seven consecutive years of decline, falling from a peak of 16,248 in 2012 to 14,262 in 2019. The number of children ceasing to be looked after each year was consistently greater than the number becoming looked after between 2012 and 2019. However, the number of children ceasing to be looked after fell by 18% from 4,068 in 2019 to 3,325 in 2020. The number of children becoming looked after also fell – by 9% from 3,824 in 2019 to 3,490 in 2020. This figure was higher than the number of children ceasing to be looked after, as shown in the supporting publication tables 1.3,1.4 and Charts 2a-2b.
Placement type
There are several types of care setting in which looked after children or young people could be looked after, including:
- at home (where a child is subject to a Compulsory Supervision Order and continues to live in their usual place of residence)
- in kinship care (where they are placed with friends or relatives)
- with prospective adopters
- foster care
- residential unit or school
- a secure unit
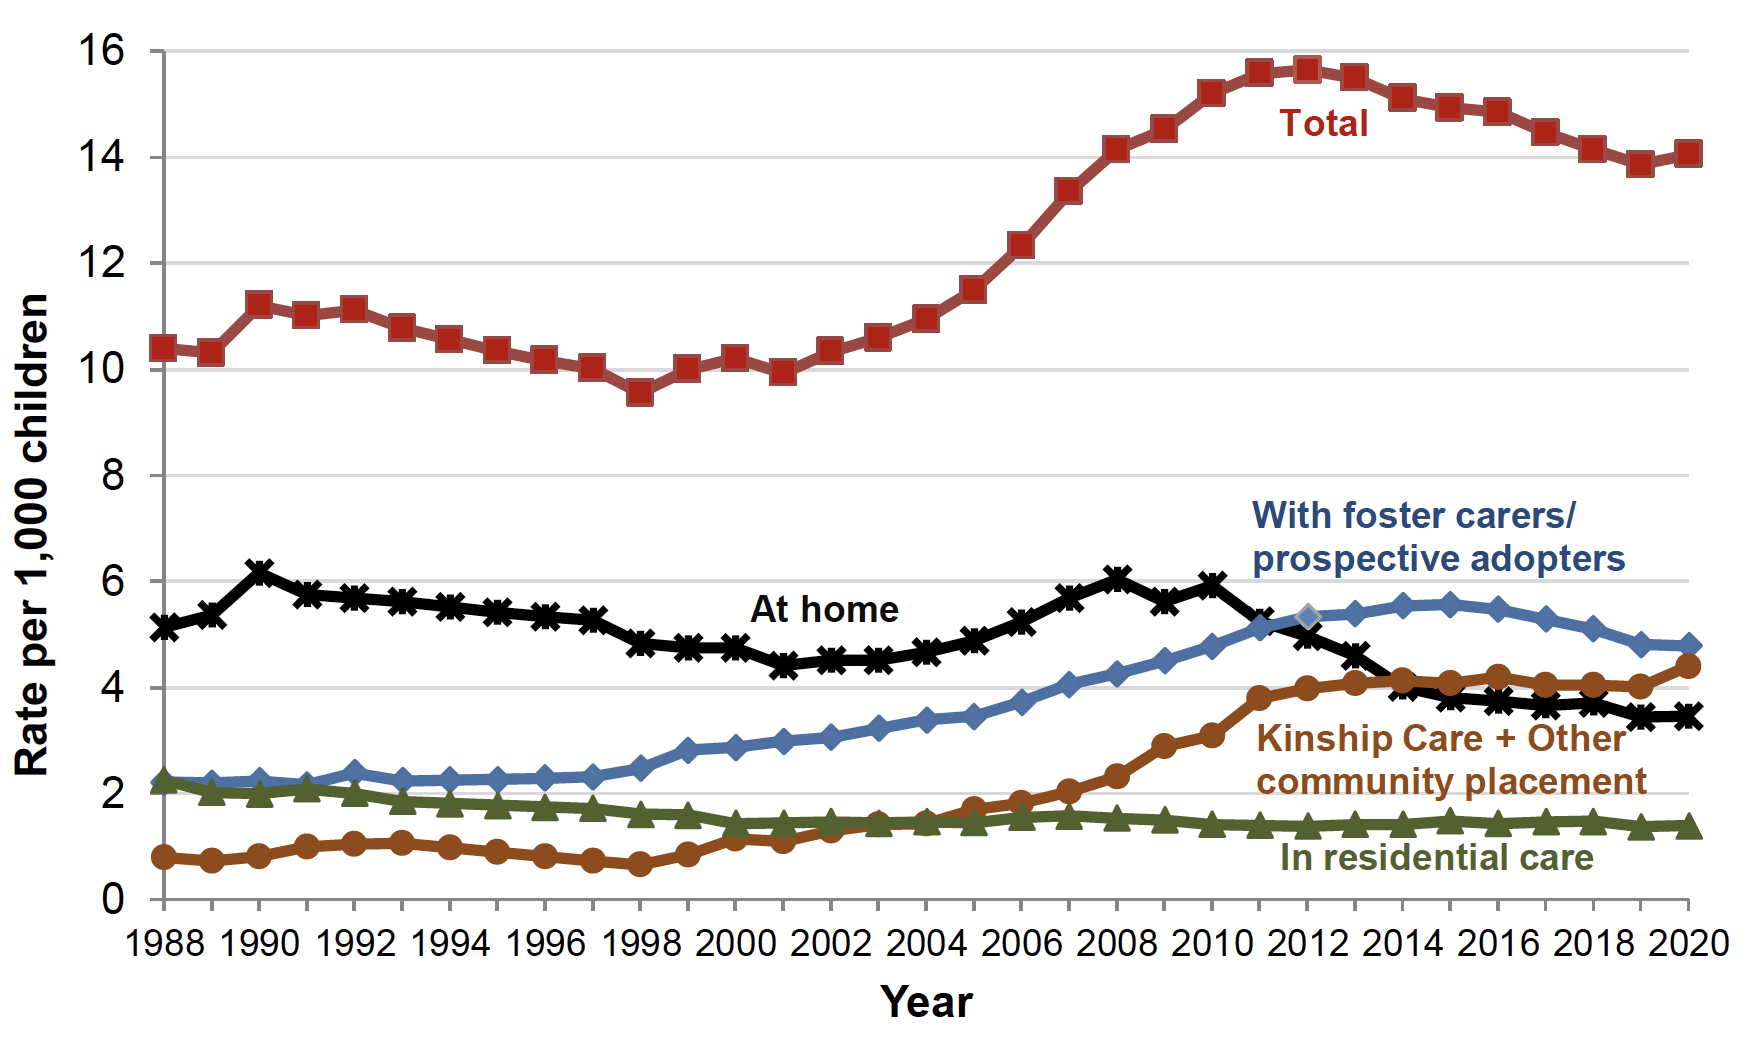
Table 1.1 and Chart 1 show the proportion of children being looked after at home has decreased over the last decade, with 25% of the total in this group in 2020 compared to 39% in 2010. Increasing proportions of children are being looked after away from home in community settings. In particular, 4,456 children were placed formally with kinship carers in 2020 (31% of the total in 2020 compared with 20% in 2010). There has also been an increase in the proportion of children placed with foster carers – up from 30% in 2010 to 33% in 2020 – and this remains the most common accommodation type for looked after children. The proportion of children looked after in residential care settings remained static at around 10% of the overall total.
| 2010 | 2019 | 2020 | |
|---|---|---|---|
| In the community | 14,412 | 12,814 | 13,022 |
| At home with parents | 6,193 | 3,569 | 3,563 |
| With Kinship Carers: friends/relatives | 3,172 | 4,175 | 4,456 |
| With Foster Carers provided by LA | 3,651 | 3,335 | 3,315 |
| With Foster Carers purchased by LA | 1,046 | 1,463 | 1,429 |
| With prospective adopters | 299 | 212 | 185 |
| In other community | 51 | 60 | 74 |
| Residential Accommodation | 1,480 | 1,448 | 1,436 |
| In local authority home | 620 | 581 | 556 |
| In voluntary home | 82 | 127 | 130 |
| In residential school | 471 | 344 | 329 |
| In secure accommodation | 82 | 63 | 59 |
| Crisis care | 17 | 0 | 0 |
| In other residential (1) | 208 | 333 | 362 |
| Total looked after children | 15,892 | 14,262 | 14,458 |
(1) Information on the number of children looked after by accommodation type is available back to 1988 in chart 1 data of the spreadsheet version of the associated downloadable publication tables
(2) 'In other community' is a category that captures those people in community placements outside those listed, such as supported accommodation
(3) The bulk of the 'other residential' placements are private/independent residential placements for young people with complex needs
Care Plan
When children become looked after, a care plan should be produced by the local authority. The care plan should include detailed information about the child's care, education and health needs, as well as the responsibilities of the local authority, the parents, and the child. A care plan is considered 'current' if it has been produced or reviewed in the past 12 months.
Table 1.2 shows that 96% of the 14,458 children who were looked after at the end of July 2020 had a current care plan, up from 94% in 2019. The proportion with a current care plan was 96% among those looked after at home and those looked after away from home. Of those looked after away from home, the proportion with a current care plan was slightly higher among those placed with foster carers (97%) or in residential care (97%), compared to those with kinship carers (95%) or with prospective adopters/ other community placement (93%).
| Away from home - breakdown by category | |||||||
|---|---|---|---|---|---|---|---|
| At home | Away from home | With Kinship Carers: friends/relatives | With Foster Carers | With prospective adopters/ other community | In Residential Care | Total | |
| With current care plan | 3,406 | 10,479 | 4,230 | 4,619 | 242 | 1,388 | 13,885 |
| Without current care plan | 157 | 416 | 226 | 125 | 17 | 48 | 573 |
| Total | 3,563 | 10,895 | 4,456 | 4,744 | 259 | 1,436 | 14,458 |
| With current care plan | 96% | 96% | 95% | 97% | 93% | 97% | 96% |
| Without current care plan | 4% | 4% | 5% | 3% | 7% | 3% | 4% |
| Total | 100% | 100% | 100% | 100% | 100% | 100% | 100% |
(1) Some children without a current care plan may have one in progress on this date; local recording may differ with regard to when a care plan is recorded as being in place.
Children starting and ceasing to be looked after
The increase in total numbers being looked after is because fewer children or young people left care than started it.
As shown in table 1.3, 3,490 episodes of care began between 1 August 2019 and 31 July 2020. This represents a 9% decrease from the 3,824 episodes of care beginning in 2019.
| Age | Number | Percentage | ||||
|---|---|---|---|---|---|---|
| 2010 | 2019 | 2020 | 2010 | 2019 | 2020 | |
| Under 1 | 650 | 565 | 531 | 13% | 15% | 15% |
| 1-4 | 1,146 | 891 | 815 | 24% | 23% | 23% |
| 5-11 | 1,463 | 1,137 | 1,060 | 30% | 30% | 30% |
| 12-15 | 1,555 | 1,128 | 922 | 32% | 29% | 26% |
| 16-17 | 45 | 102 | 158 | 1% | 3% | 5% |
| 18-21 | 0 | * | * | 0% | * | * |
| Not known | 0 | * | * | 0% | * | * |
| Total | 4,859 | 3,824 | 3,490 | 100% | 100% | 100% |
(1) A child may start to be looked after more than once in a year and so may be counted more than once.
(2) Table cells containing * have been suppressed to maintain confidentiality
Table 1.3 also shows a reduction in the proportion of children becoming looked after aged 12-15, from 32% in 2010 to 26% in 2020. The longer term pattern of children starting to be looked after at younger ages than this is offset by a slightly increased proportion of children becoming looked after aged 16-17 - up to 5% in 2020 from 1% in 2010. Fifteen percent of children starting episodes of care were less than one year old, increasing from thirteen percent in 2010.
There were more boys than girls starting episodes of care in 2020 – 55% of those starting episodes of care were boys compared with 45% girls (the Scotland-wide population of under eighteens was 51% male in 2019[3]). This is the most pronounced gender split of those starting episodes of care since 2007, during which period the proportion of those starting episodes of care who were boys has ranged from 51% to 55%.
Table 1.4 shows the number of episodes of care which ceased, by length of time looked after. There were 3,325 episodes of care which ceased between 1 August 2019 and 31 July 2020, a decrease of 18% from the previous year.
The length of time for which children ceasing to be looked after had been looked after remained similar between 2019 and 2020. However, when compared with 2010, there are a higher proportion of children who had been looked after for more than five years, and a lower proportion who had been looked after for under one year.
| Length of time looked after |
Number |
Percentage |
||||
|---|---|---|---|---|---|---|
| 2010 |
2019 |
2020 |
2010 |
2019 |
2020 |
|
| Under 6 weeks |
342 |
259 |
264 |
8% |
6% |
8% |
| 6 weeks to under 6 months |
349 |
321 |
301 |
8% |
8% |
9% |
| 6 months to under 1 year |
764 |
543 |
400 |
17% |
13% |
12% |
| 1 year to under 3 years |
1,811 |
1,474 |
1,184 |
40% |
36% |
36% |
| 3 years to under 5 years |
672 |
643 |
496 |
15% |
16% |
15% |
| 5 years and over |
566 |
828 |
680 |
13% |
20% |
20% |
| Not known |
0 |
0 |
0 |
0% |
0% |
0% |
| Total |
4,504 |
4,068 |
3,325 |
100% |
100% |
100% |
(1) A child may cease to be looked after more than once during the year and will be counted once for each episode of care ending.
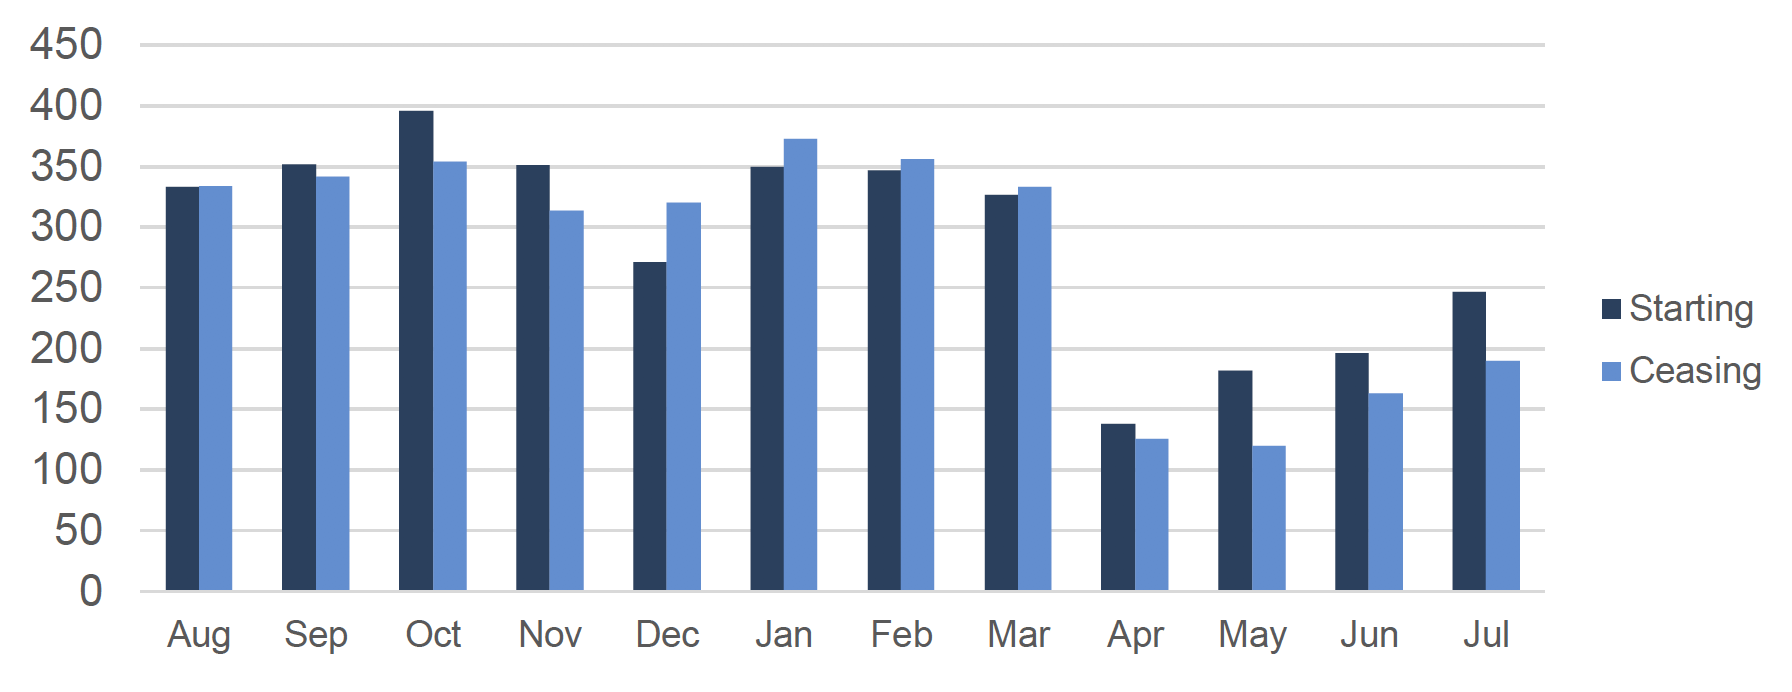
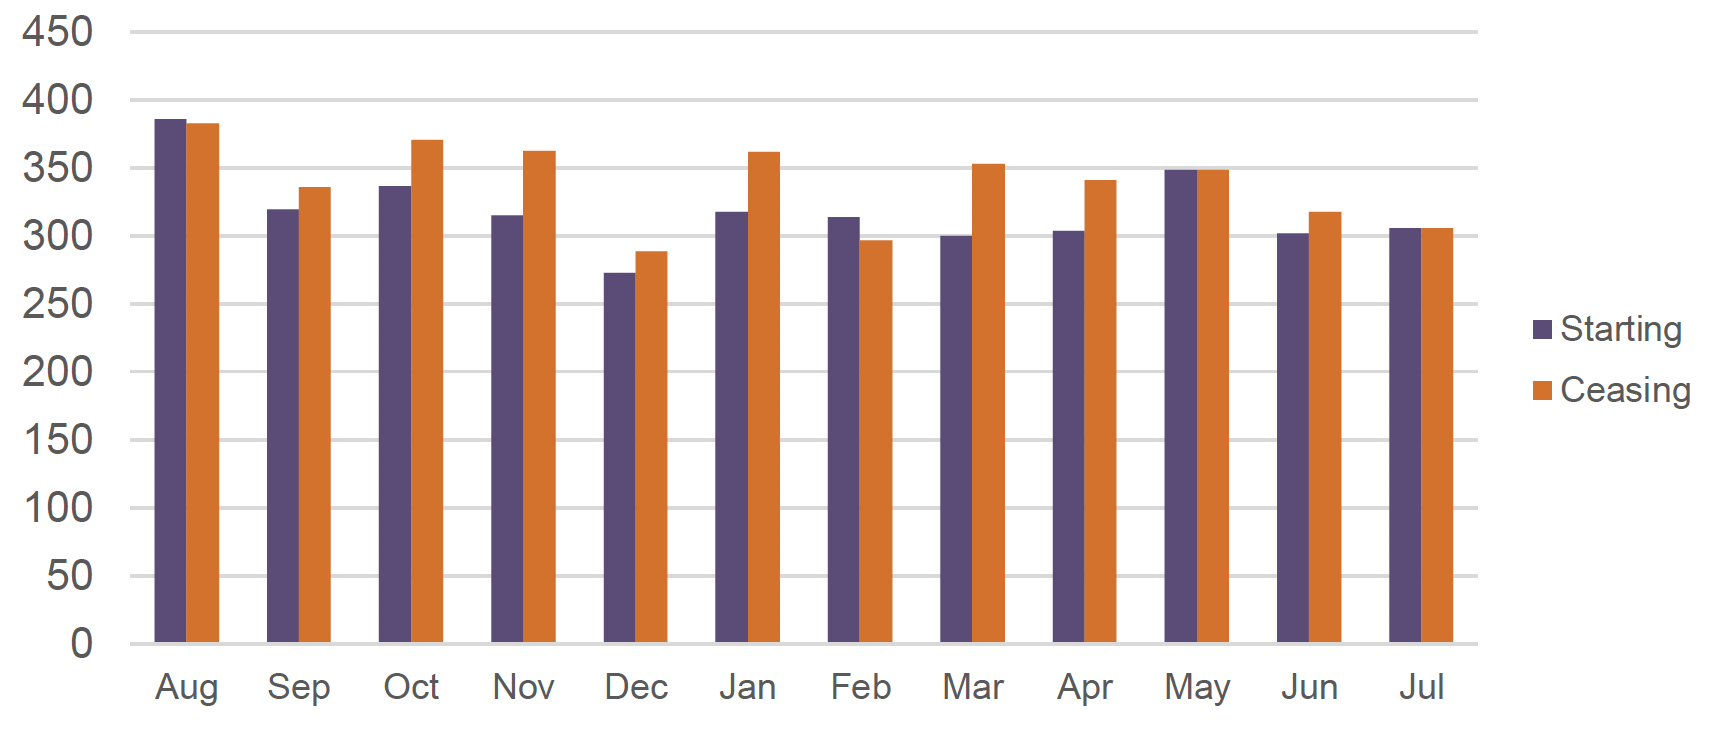
Charts 2a and 2b show the pattern of children becoming and ceasing to be looked after by month within each of the last two years. In 2018-19, the number of children ceasing to be looked after was lower than the number of children becoming looked after in only two out of twelve months, with no clear pattern emerging over the year except lower numbers of cases in December. In 2019-20, the pattern of more children ceasing to be looked after reversed at the beginning of the year, but again with no clear pattern until a step change from April 2020 – the first full month of the COVID-19 pandemic. From April to July 2020, the numbers of children becoming and ceasing to be looked after were considerably lower than earlier in the year, although the figures rose steadily throughout those months. While from 1 August 2019 to 31 March 2020, the number of children starting (2,727) and ceasing (2,726) to be looked after was almost identical, there was a clear difference from April 2020 onwards (763 becoming looked after; 599 ceasing to be looked after).
When a child ceases being looked after, a destination is recorded (Table 1.5). This is the third year that Kinship Care Order and Continuing Care were included as destination categories in the Looked After Children data collection. A Kinship Care Order is a court order that confers all or part of parental responsibilities and rights to a friend or relative of the child and can be a trigger for receipt of kinship care assistance. More information on Continuing Care is available in the Continuing Care section.
Although most children go home to their biological parents when they cease to be looked after, the proportion has declined from 62% in 2010 to 54% in 2020. A further 16% went to live in kinship care with friends or relatives or left care through a Kinship Care Order in 2020. The proportion of children leaving care due to being adopted was 6% in 2020, down 1 percentage point from 2019. The majority of adoptions (73%) are of children aged under five years old, as shown in Additional Table 1.9. There is a much more even spread of ages of young people leaving care to go home or to live with friends and relatives.
| Destination after leaving care | Number | Percentage | ||||
|---|---|---|---|---|---|---|
| 2010 | 2019 | 2020 | 2010 | 2019 | 2020 | |
| Home with (biological) parents | 2,794 | 2,365 | 1,807 | 62% | 58% | 54% |
| Kinship carers: Friends/relatives(1) | 532 | 563 | 481 | 12% | 14% | 14% |
| Kinship Care Order(2) | - | 70 | 53 | - | 2% | 2% |
| Former foster carers(1) | 84 | 110 | 85 | 2% | 3% | 3% |
| Continuing Care(2) | - | 167 | 229 | - | 4% | 7% |
| Adoption | 218 | 265 | 192 | 5% | 7% | 6% |
| Supported accommodation / own tenancy | 257 | 223 | 245 | 6% | 5% | 7% |
| Other(3) | 303 | 281 | 202 | 7% | 7% | 6% |
| Not known | 316 | 24 | 31 | 7% | 1% | 1% |
| Total | 4,504 | 4,068 | 3,325 | 100% | 100% | 100% |
(1) A child may cease to be looked after more than once during the year and will be counted once for each episode of care ending.
(2) New destination categories of 'continuing care' and 'kinship care order' were added in 2018. Children who left care for these destinations in previous years were mostly recorded in the friends/relatives category for 'kinship care order' and the former foster carers category for 'continuing care', which partly explains the decrease in these 2 categories in 2018.
(3) "Other" includes residential care, homeless, in custody and other destination.
Pathway Plans
Local authorities have a duty to provide advice, guidance and assistance for young people who at the point of leaving care have reached 16 years of age. This is referred to as 'aftercare services'. Local authorities are required to carry out a pathway assessment for aftercare services for all currently looked after young people who are over the age of sixteen and every 'compulsorily supported person' (a care leaver who has not yet reached their nineteenth birthday). These young people should be provided with a pathway co-ordinator who assesses their needs and a pathway plan which outlines how the local authority plans to meet the needs of the young person. The pathway assessment should be done within three months of a young person becoming a compulsorily supported person but it is expected that all young people over age 16 will have had their pathway assessment, and will have a completed pathway plan in place as to their future, before they cease to be looked after.
Of those young people who had reached 16 years of age at the time they ceased to be looked after during 1 August 2019 to 31 July 2020, 79% (up from 71% in 2019) had a pathway plan and 70% had a pathway co‑ordinator (Table 1.6), an increase from 60% in 2019. Where a young person's final placement type was 'at home' they were less likely to have a pathway plan or a pathway co-ordinator than if the final placement type was 'away from home'. Of young people whose last placement was at home, 68% had a pathway plan and 57% a pathway coordinator, compared with 83% and 74% respectively of those whose final placement type was 'away from home'.
| Number looked after | Percentage looked after | Away from home - breakdown by category | ||||||||
|---|---|---|---|---|---|---|---|---|---|---|
| at home | away from home | Total | at home | away from home | Total | With Kinship Carers: friends/relatives | With Foster Carers | With prospective adopters/ other community | In Residential Care | |
| With a pathway plan | 200 | 759 | 959 | 68% | 83% | 79% | 182 | 271 | 40 | 266 |
| Without a pathway plan | 92 | 156 | 248 | 32% | 17% | 21% | 65 | 26 | 5 | 60 |
| With a pathway co-ordinator | 165 | 675 | 840 | 57% | 74% | 70% | 161 | 228 | 28 | 258 |
| Without a pathway co-ordinator | 127 | 240 | 367 | 43% | 26% | 30% | 86 | 69 | 17 | 68 |
| Total | 292 | 915 | 1,207 | 100% | 100% | 100% | 247 | 297 | 45 | 326 |
(1) Figures include all episodes of ceasing to be looked after beyond 16 years of age (i.e. a child may be counted more than once).
(2) It may be the case that some young people who don't have a relevant pathway plan/coordinator may be receiving similar support from adult services instead.
Aftercare services
Table 1.7 shows the number of young people eligible for aftercare services by age and the percentage of these young people in receipt of aftercare on 31 July 2020.
From April 2015, aftercare eligibility has been extended to cover all care leavers up to and including people aged 25 where it previously only covered up to their 21st birthday. This extension of the original policy has now reached maturity so age groups entering eligibility for aftercare should broadly equal those sufficiently mature to leave aftercare. Figures for those eligible for aftercare have risen from 4,602 in 2016 to 6,492 in 2019 and increasing further to 7,198 in 2020.
For young people eligible for aftercare, Table 1.7 shows that 57% have taken up these services, in line with the proportion in receipt of aftercare services in 2019. As in 2019, the proportion of eligible young people in receipt of aftercare was highest among those aged 19-21, with 65% of those eligible and aged 19-21 being in receipt of aftercare services (67% in 2019).
| Status | 16 | 17 | 18 | 19-21 | 22+ | Total |
|---|---|---|---|---|---|---|
| In receipt of aftercare | 177 | 348 | 639 | 1,688 | 1,278 | 4,129 |
| Not in receipt of aftercare | 199 | 281 | 479 | 926 | 1,184 | 3,069 |
| Total eligible for aftercare | 377 | 629 | 1,118 | 2,614 | 2,461 | 7,198 |
| In receipt of aftercare | 47% | 55% | 57% | 65% | 52% | 57% |
| Not in receipt of aftercare | 53% | 45% | 43% | 35% | 48% | 43% |
| Total eligible for aftercare | 100% | 100% | 100% | 100% | 100% | 100% |
(1) Age on 31 July 2020
Table 1.7b: Young people eligible for and in receipt of aftercare services by age(1), 2019
| Status | 16 | 17 | 18 | 19-21 | 22+ | Total |
|---|---|---|---|---|---|---|
| In receipt of aftercare | 200 | 396 | 576 | 1,616 | 922 | 3,710 |
| Not in receipt of aftercare | 159 | 222 | 404 | 791 | 1,206 | 2,782 |
| Total eligible for aftercare | 359 | 618 | 980 | 2,407 | 2,128 | 6,492 |
| In receipt of aftercare | 56% | 64% | 59% | 67% | 43% | 57% |
| Not in receipt of aftercare | 44% | 36% | 41% | 33% | 57% | 43% |
| Total eligible for aftercare | 100% | 100% | 100% | 100% | 100% | 100% |
| (1) Age on 31 July 2019 |
Continuing Care
Continuing Care is the continued provision of the accommodation and other assistance that was being provided by the local authority immediately before the young person ceased to be looked after. Only children who cease to be looked after aged 16 years or over and were looked after away from home are eligible for Continuing Care. Continuing Care has been available to eligible care leavers from April 2015, enabling eligible young people aged 16 or older to stay in the same kinship, foster or residential care placements when they ceased to be looked after. The 'higher age' for continuing care eligibility rose annually as part of a roll out strategy. Continuing Care became fully operational in April 2020, allowing all eligible care-leavers to remain in their care setting from age 16 until their 21st birthday.
The data in Table 1.5 shows that 229 children who ceased to be looked after between 1 August 2019 and 31 July 2020 received Continuing Care. Additional data on the population in Continuing Care is collected as part of the above statistics on eligibility for aftercare. Table 1.8 uses that data to show that, in addition to the 229 young people recorded as ceasing to be looked after and staying in Continuing Care, there were an additional 77 young people in a Continuing Care placement, identified in the eligible for aftercare data. Therefore, in total there were 306 young people recorded as being in Continuing Care in 2019-20, up from 286 in 2018-19.
| Recorded as ceasing to be looked after with a destination of Continuing Care | Recorded as being in Continuing Care | Total | |
|---|---|---|---|
| Number of children | 229 | 77 | 306 |
(1) There were 11 additional children recorded as being in Continuing Care in the eligible for aftercare data, but they were also included in the ceasing to be looked after with a destination of Continuing Care figures. They have been omitted from the 'Recorded as being in continuing care' figures to avoid double counting.
Cross-UK looked after comparisons
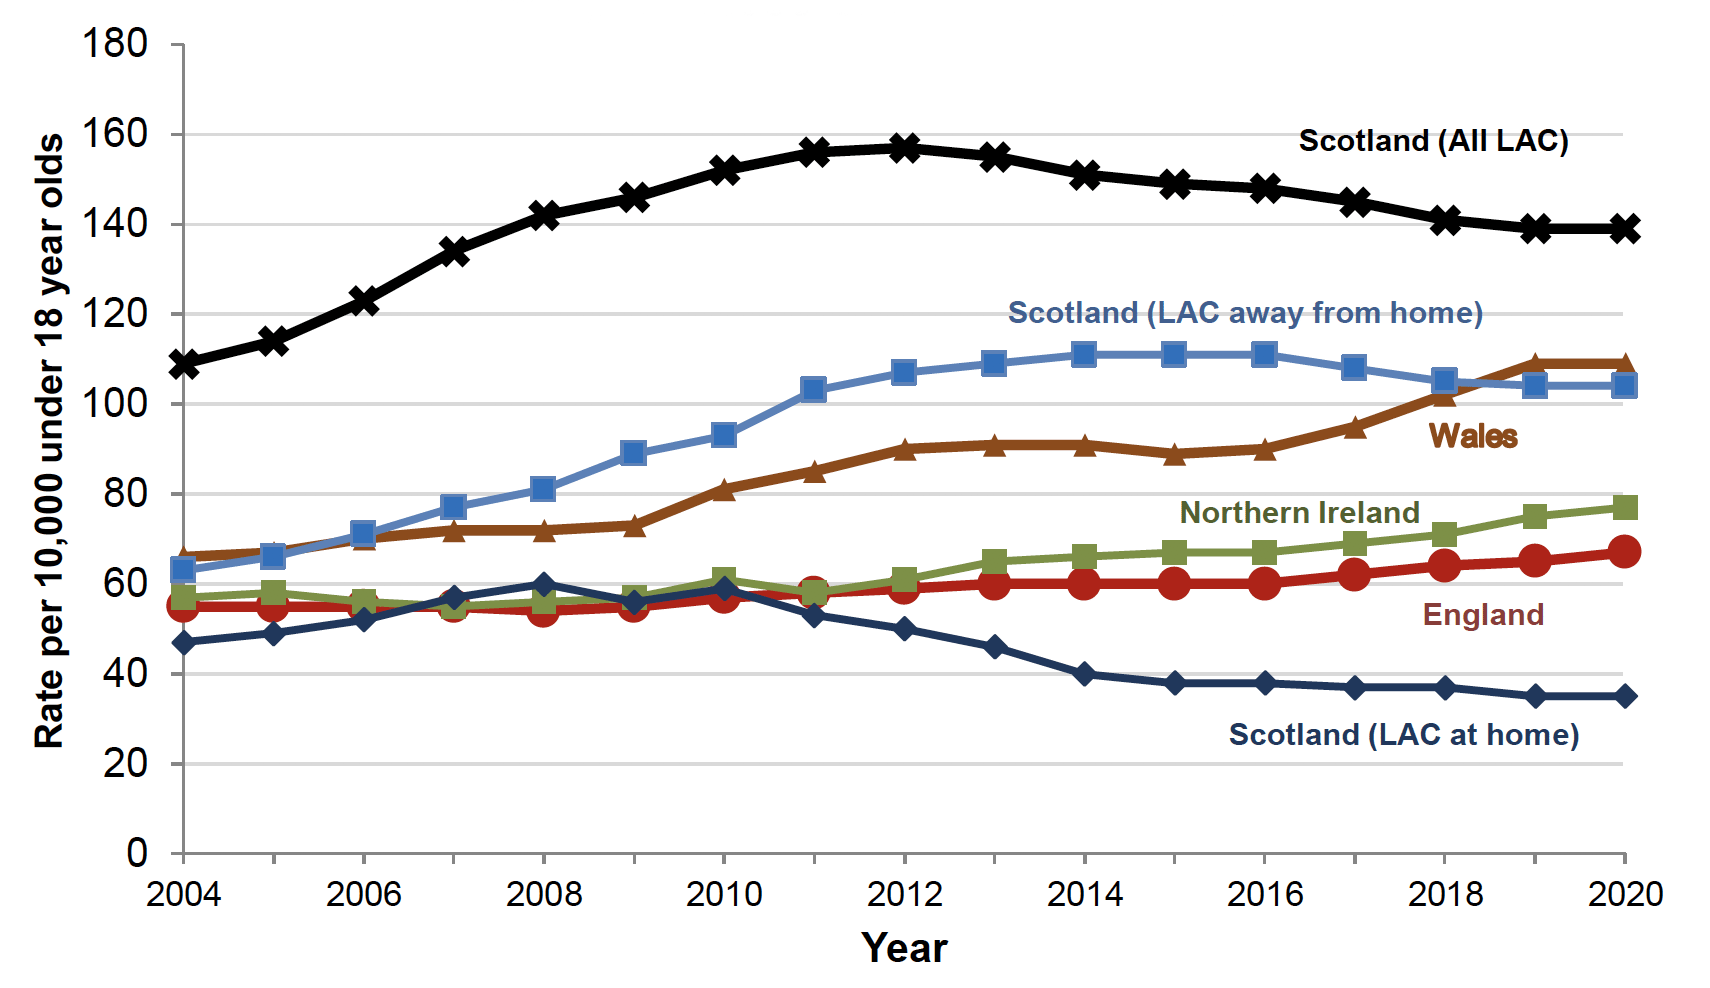
The definition of "looked after children" varies across the countries within the UK, which makes cross-UK comparisons difficult. To improve comparability, the Scotland figure at 31 March has been used, rather than the published 31 July figure, as the other nations publish figures as at this date.
Chart 3 gives Scottish figures including a breakdown for children looked after at home and away from home for comparability with the other nations. Scotland has a much higher proportion of children looked after at home than the rest of the UK, a placement which in Scotland requires a supervision order from the Children's Panel. Overall, Scotland had the highest rate of looked after children in 2020 at 139 children per 10,000 under 18 population. The rate of looked after children in Wales is lower, at 109 per 10,000, while the rates in Northern Ireland (77 per 10,000) and England (67 per 10,000) are much lower still.
Links to the cross-UK data underlying the chart can be found in Background Note 1.7. There is more information on the comparability of looked after children data across the UK on the Scottish Government website.
The data used to produce the charts and tables on looked after children in the publication are available in the supporting files accompanying the publication. There are also additional tables available in the supporting files.