Child poverty modelling: update
This report estimates the impacts of Scottish Government policies on child poverty, updating the modelling that was originally undertaken for the second Tackling Child Poverty Delivery Plan. It also analyses the impacts of current and hypothetical UK Government welfare policies.
4. Welfare reform
4.1 Current policies
This section presents analysis on the impacts of a selection of welfare policies that are currently in place, namely the two-child limit, the benefit cap, and cuts to Local Housing Allowances. These policies all reduce UC income directly, including for many households with children.
4.1.1 The two-child limit
The two-child limit restricts support through UC to the first two children in a family. Before April 2025, when the tax credit system was due to end, Child Tax Credit (CTC) was also subject to the limit. The policy was introduced on 6 April 2017 and applies to all third and subsequent children born from that date onwards, though there are exemptions in specific circumstances.[12] A key result of this age threshold is that an increasing proportion of children are affected over time. The Scottish Government has committed to mitigate the two-child limit from 2026, or earlier if feasible to do so safely and securely.
Figure 5 shows the number of households and the estimated number of children affected by the two-child limit over time. This includes all children in affected households and therefore differs from estimates produced by the Scottish Fiscal Commission (SFC) which focus on the number of children for whom entitlement is removed – that is, only the third and subsequent children in the household. Note however that the figure only includes households for whom CTC or UC is withheld for at least one child; in other words, it excludes households that are fully exempt.
The number of households affected by the two-child limit has steadily risen over time to reach over 25,000 as of April 2024, representing over 90,000 children. We estimate that, by the end of 2024-25, the two-child limit will have withheld a cumulative total of £377 million from Scottish households since it was introduced, equivalent to £424 million in 2024-25 prices. Section 5.2.1 sets out the methodology underpinning these estimates.
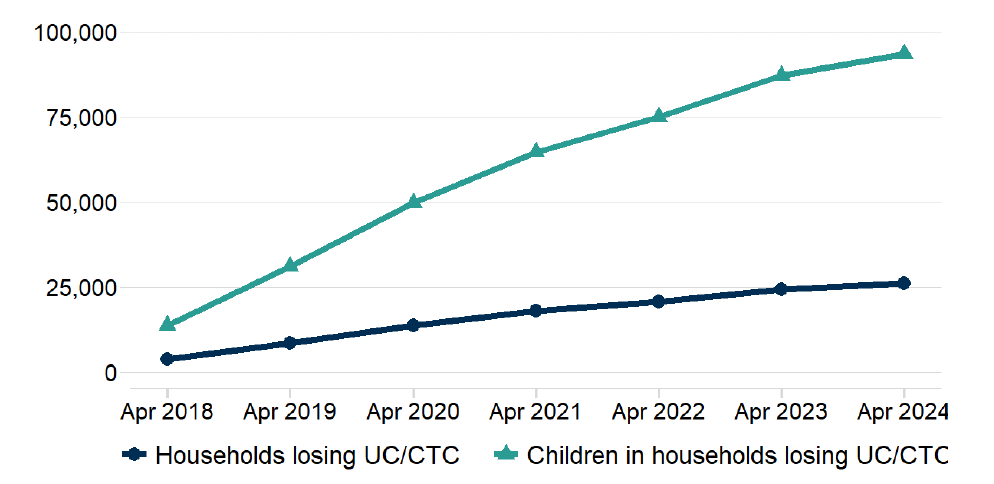
Notes: UC = Universal Credit, CTC = Child Tax Credit. For further details see Section 5.2.1. Source: SG analysis of Universal Credit and Child Tax Credit claimants: statistics related to the policy to provide support for a maximum of 2 children - GOV.UK
As shown in Figure 6, the child poverty rate in households with three or more children has been increasing over time, after falling considerably in the late 1990s and early 2000s. By contrast, households with fewer children have seen relatively stable poverty rates over the last few decades. Children in households with three or more children are now twice as likely to be in poverty as children in households with fewer children, with a poverty rate of 38% compared to 19% in 2020-23.[13]
This turnaround began around 2011, when the wider austerity programme started to affect the social security system, but has been particularly pronounced since around 2017, when the two-child limit began to take effect. While other factors could also have contributed to the acceleration, it has not been evident in households with fewer children. In any case, it is clear that large families are already at higher risk of poverty; and without mitigation the policy would be expected to push an increasing number of children into poverty over time. The Resolution Foundation has estimated that half of children in families with three or more children will be in poverty by 2029-30 across the UK if the two-child limit is retained, with the New Economics Foundation projecting a similar trend.[14]
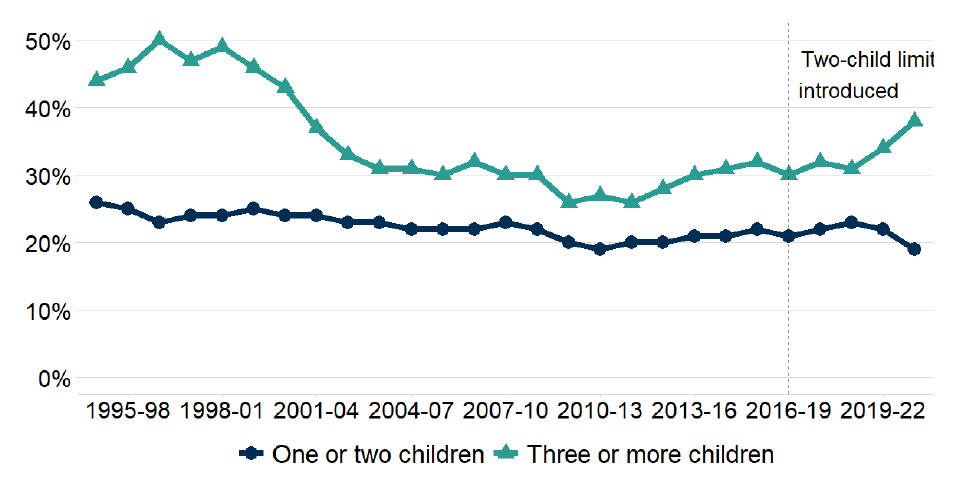
Source: Poverty and Income Inequality in Scotland 2020-23
4.1.2 The benefit cap
The benefit cap limits the total amount of income from certain benefits that each household can receive by reducing either its UC or Housing Benefit (HB), though some households are exempt.[15] Originally introduced in 2013 at a rate equivalent to £26,000 per year (£18,200 for a single person with no children), the cap was lowered to £20,000 (£13,400) in 2016. It was then frozen until 2023, when it was uprated by inflation to £22,020 (£14,753), but has since remained frozen again. In Scotland, the policy is mitigated through Discretionary Housing Payments.
The benefit cap affects a relatively small number of households, but these are overwhelmingly families with children – usually three or more children – and are mostly lone parents. As shown in Table 5, the level of the benefit cap is below the relative poverty threshold for a large majority of affected households. These gaps will widen over time as the poverty line rises while the benefit cap remains indefinitely frozen.
| Household type | Composition of households on the benefit cap | Projected poverty threshold before housing costs | Minimum difference between benefit cap and poverty threshold |
|---|---|---|---|
| Single, no children | <1% | £14,867 | -£114 |
| Couple, no children | 0% | £29,734 | -£7,714 |
| Single, one child | <1% | £19,305 | £2,715 |
| Couple, one child | <1% | £34,173 | -£12,153 |
| Single, two children | <1% | £23,743 | -£1,723 |
| Couple, two children | 1% | £38,611 | -£16,591 |
| Single, three children | 4% | £28,181 | -£6,161 |
| Couple, three children | 2% | £43,049 | -£21,029 |
| Single, four children | 10% | £32,619 | -£10,599 |
| Couple, four children | 4% | £47,487 | -£25,467 |
| Single, five children | 13% | £37,057 | -£15,037 |
| Couple, five children | 7% | £51,925 | -£29,905 |
| All | 100% | N/A | N/A |
Notes: Percentages as of September 2024. All children are assumed to be aged fourteen or younger. As older children attract a higher weighting in calculating when equivalising incomes, the poverty thresholds shown here – and therefore the gaps between the benefit cap and those thresholds – are labelled as minimums. In addition, households with five or more children are assumed to have five children – the gaps will be larger for households with more children. The table excludes other forms of income besides benefits. Whereas poverty is measured on a household basis, the benefit cap is applied at the level of the benefit unit, so some households with multiple benefit units may have incomes above the benefit cap and above the relevant poverty thresholds. Source: SG analysis using UKMOD; DWP Stat-Xplore
Figure 7 shows the number of households and the estimated number of children affected by the benefit cap over time. As of November 2024, nearly 3,000 households containing over 9,000 children were subject to the cap. The figure also shows how the affected population tends to grow when the benefit cap is frozen or reduced – particularly when benefit rates are uprated or increased – and tends to fall when the benefit cap is uprated. We estimate that, between its introduction in July 2013 and the end of 2024-25, the benefit cap will have withheld a cumulative total of £57 million in UC or HB from Scottish households, equivalent to £71 million in 2024-25 prices. The vast majority of this income was withheld from households with children.
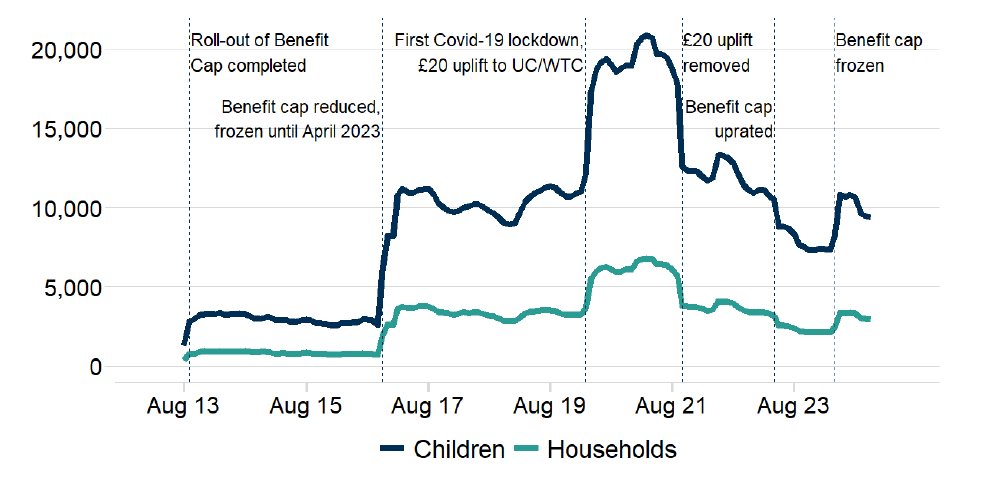
Notes: For further details see Section 5.2.2. Source: SG analysis of DWP, Stat-Xplore
4.1.3 Cuts to Local Housing Allowances
Local Housing Allowances (LHAs) determine the maximum amount of support that households in the private rented sector can receive through HB or the housing element of UC. Unlike the two-child limit and the benefit cap, which affect households with children either exclusively or predominantly, LHAs apply to all private sector tenants on UC and HB. LHAs vary by the number of bedrooms for which the household is eligible, based on the age, sex, disability status, and number of individuals in the household; and by the area in which the household lives, with Local Authorities grouped into Broad Rental Market Areas (BRMAs). In Scotland, shortfalls in income associated with LHAs are one of the reasons for which Local Authorities can grant Discretionary Housing Payments.
When they were introduced across the UK in 2008-09, LHAs were set at the 50th percentile (median) of rents for each property size in each BRMA and were uprated on a monthly basis. However, in 2011-12, this level was reduced to the 30th percentile, and in 2012-13 the monthly uprating regime was replaced by an annual one. This was followed by nearly a decade of caps and freezes which led to divergences between LHAs and the 30th percentile of rents.[16] LHAs were rebased at the 30th percentile in 2020-21 and 2024-25, with a freeze in the interim period, but are currently set to remain frozen at their 2024-25 levels indefinitely.[17]
Figure 8 shows the estimated number of households and children affected by LHAs diverging from the annual 30th percentile in each year since 2011. These are households on UC or HB – and children in those households – that would have received more in benefits had LHAs been annually pegged at the 30th percentile of market rents. The chart clearly shows how the affected population grew between 2011 and 2020, when LHAs were rebased, before growing again as LHAs were once again frozen. We estimate that, between 2011-12 and 2023-24, freezes and caps to LHAs reduced the income of households in Scotland by a cumulative total of £66 million (or £81 million in 2024-25 prices), of which £26 million (£32 million in 2024-25 prices) was withheld from households with children.
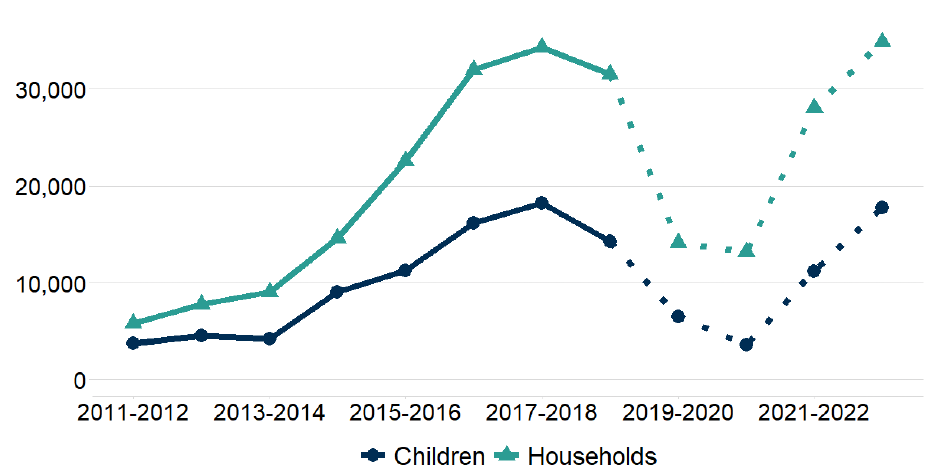
Notes: Dotted line indicates break in the time series resulting from remote data collection during Covid-19 lockdowns during 2020 and 2021; see Section 5.2.3 for more details. Source: SG analysis of Scottish Household Survey
4.2 Hypothetical reforms
This section estimates the child poverty impacts of three hypothetical welfare reforms in 2025-26: abolishing the two-child limit; introducing an Essentials Guarantee; and replicating the Scottish Child Payment in UC. We also model a cumulative scenario in which all three of these reforms are introduced and the benefit cap is additionally removed.
In terms of methodology, the baseline scenario remains the same as in the CIA, but the counterfactuals now represent hypothetical worlds in which each of the welfare reforms are introduced. The impacts of these reforms are therefore additional to the impacts of the SG policy package and would represent reductions to the child poverty rates projected in the CIA baseline. As per Section 3.3, each reform is added to that baseline separately, rather than building up to the cumulative scenario in an incremental manner.
As noted in previous sections, the Scottish Government has committed to mitigate the two-child limit from 2026, or earlier if feasible to do so safely and securely. For the sake of modelling, we assume throughout this report that this mitigation will come into force in April 2026 (see Section 5.1). The results presented in this section, which pertain to 2025-26, are therefore based on a world without mitigation. In other words, for all the reforms modelled here, including the abolition of the two-child limit, there is no mitigation of the two-child limit in either the baseline or the counterfactual.
The Scottish Government has called on the UK Government to adopt an Essentials Guarantee in UC. To ensure that recipients can afford basic necessities, analysis by the Joseph Rowntree Foundation (JRF) shows that the UC standard allowance should be raised to £120 per month for a single person and £200 for a couple in 2024-25 prices.[18] Besides reducing poverty, this would address the age discrimination present in the system by allocating the same standard allowance to under-25s as older people, rather than the lowered rate that they currently receive, and would limit the amount by which UC awards can be reduced due to sanctions and debt deductions. Uprating the Guarantee by inflation implies a weekly rate of £123 for a single person and £204 for a couple in 2025-26, representing an increase of between 33% and 78% over the published rates depending on the number and age of adults in the family.[19]
The Scottish Child Payment (SCP) will pay £27.15 per week for every child in the family under 16 in 2025-26, equivalent to around £118.05 per month. Replicating SCP within UC would involve adding this amount to the UC child element, which is worth £292.81 per child in 2025-26. Policies such as the two-child limit and the benefit cap would constrain this increase for some families, although any mitigation of these policies would increase concomitantly. Note that the analysis presented here assumes that all dependents as defined by UC would be eligible for the increase – meaning it would additionally include 16-year-olds as well as 17-19-year-olds who are in education or training – and that SCP itself would remain in place. This is in line with modelling undertaken by the Institute for Fiscal Studies.[20]
The cumulative scenario takes into account the interactions between these policies. For example, abolishing the two-child limit will have a greater impact if the amount that this policy would otherwise withhold from third and subsequent children increases, as it does under the option to replicate SCP in the UC child element; and conversely, replicating SCP will have a greater impact if the two-child limit is removed, as otherwise the payment will not reach third and subsequent children. As in the CIA, the policies also interact in terms of household poverty status, particularly since all households on UC receive the standard allowances that are increased under the Essentials Guarantee. The upshot is that the cumulative impact of the policies can be more or less than the sum of their respective, individual impacts.
The hypothetical reforms modelled here would to some extent be constrained by the benefit cap. Under each reform, households already subject to the cap would receive no additional income from UC, while other households would be pushed onto the cap and so receive only a partial increase. Mitigation of the benefit cap may not be able to fully offset these constraints if the income withheld through the cap exceeds a household’s housing costs, which determines the maximum that can be paid out through Discretionary Housing Payments. Since this issue would be particularly acute if all three reforms were to be introduced together, we assume that the benefit cap is removed in the cumulative scenario.
Table 6 shows the estimated impacts of each set of reforms on child poverty. Introducing an Essentials Guarantee would be the single most impactful reform, reducing the relative child poverty rate by 4 percentage points, representing around 40,000 children. Abolishing the two-child limit and replicating the Scottish Child Payment would each have an impact of 2 percentage points, while the cumulative package would have an impact of 10 percentage points. The fact that this is greater than the sum of the individual policy impacts reflects the removal of the benefit cap as well as the other interactions highlighted above.
| Reform | Impact on relative child poverty |
|---|---|
| Abolish the two-child limit | 2 ppts |
| Replicate the Scottish Child Payment | 2 ppts |
| Introduce an Essentials Guarantee | 4 ppts |
| All of the above, plus remove the benefit cap | 10 ppts |
Notes: As each set of reforms is modelled separately, impacts are not incremental. Source: SG analysis using UKMOD
Contact
Email: spencer.thompson@gov.scot