Child poverty modelling: update
This report estimates the impacts of Scottish Government policies on child poverty, updating the modelling that was originally undertaken for the second Tackling Child Poverty Delivery Plan. It also analyses the impacts of current and hypothetical UK Government welfare policies.
3. Cumulative impact assessment
This section sets out the estimated impacts of Scottish Government policies on two of our target measures, namely relative and absolute child poverty. We also present analysis on how these policies are affecting children at different points in the income distribution.
The original CIA sets out the full details of our methodology.[6] As in previous modelling, we run two scenarios in each year: a baseline (or ‘policy’) scenario, which represents our main projection, and a counterfactual scenario, which represents a hypothetical world in which a package of Scottish Government policies did not exist. The difference between the two scenarios represents the cumulative impact of these policies.
The policy package has been updated to include mitigation of the two-child limit. In addition, we have improved our modelling of Free School Meals (FSM) to include more accurate assumptions on take-up and a value per meal that is consistent with the FRS. Otherwise, the same policies are included in the policy package as in the original CIA, along with any changes to these policies that have been announced or implemented in the interim period. Section 5.1 includes further details on our methodology, including the policies included in the package and the changes we have introduced.
3.1 Target measures
Figure 1 and Table 1 summarise the results of our analysis in terms of relative child poverty, with the results for absolute child poverty shown in Figure 2 and Table 2. Relative poverty is defined as having equivalised household income below 60% of the UK median, while absolute poverty uses 60% of the UK median in 2010-11, adjusted for inflation.
Our projections of child poverty as represented by the baseline scenario have deteriorated since our last update. As noted above, this is largely due to the incorporation of the 2022-23 FRS data – particularly the process of calibrating the model to this data, as set out in Section 6. Upward revisions to forecasts for inflation and earnings growth have also contributed by raising the absolute and relative poverty lines respectively, with the latter additionally affected by changes in UK Government tax policy that favour households at the median.
Given unevenness in the income distribution combined with the scale of the policy package, these changes have affected the baseline scenario more than the counterfactual scenario, resulting in a reduction in the measured impact of the policy package.[7] The revisions to FSM modelling set out in Section 5.1 have reduced this impact more directly, further explaining the deterioration in the projections. In 2025-26, we estimate that the policy package will keep 70,000 children out of poverty, with the relative child poverty rate seven percentage points lower than it would be without these policies in place. In terms of absolute child poverty, the impact is estimated to be six percentage points, representing 60,000 children who would otherwise be in poverty on this measure.
The impacts increase from 2026-27 onwards on both measures, translating into lower child poverty rates. By the end of the forecast horizon, the impact of the policy package is estimated to be 10 percentage points on the relative child poverty rate and 11 percentage points on the absolute child poverty rate, representing 100,000 and 110,000 children respectively. This increase reflects the introduction of two-child limit mitigation, as well as other factors such as benefit rates catching up with prices as elevated rates of inflation fall back to the Bank of England’s target.
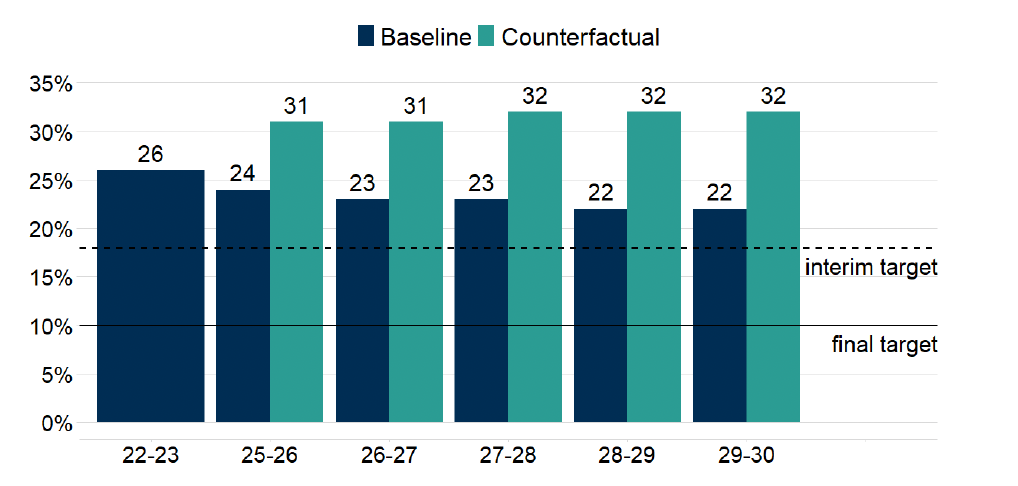
Notes: Counterfactual scenario represents a hypothetical world in which a package of Scottish Government policies does not exist. See Section 5.1 for further details. Source: SG analysis using UKMOD
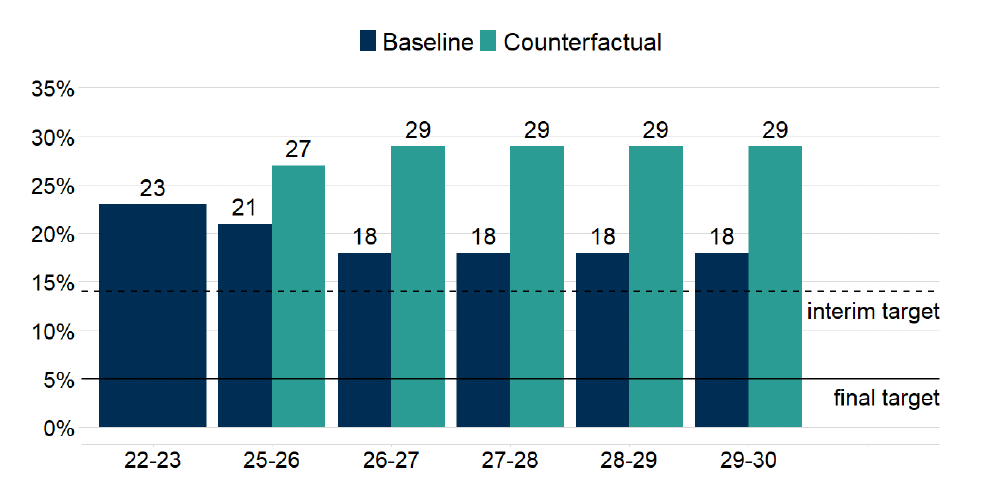
Notes: Counterfactual scenario represents a hypothetical world in which a package of Scottish Government policies does not exist. See Section 5.1 for further details. Source: SG analysis using UKMOD
| Baseline – February 2024 | Counter-factual – February 2024 | Impact of policy package – February 2024 | Baseline – March 2025 | Counter-factual – March 2025 | Impact of policy package – March 2025 | |
|---|---|---|---|---|---|---|
| 2021-22 | 23% | 26% | 4 ppts | - | - | - |
| 2022-23 | - | - | - | 26% | - | - |
| 2023-24 | 16% | 26% | 10 ppts | - | - | - |
| 2024-25 | 18% | 28% | 10 ppts | - | - | - |
| 2025-26 | - | - | - | 24% | 31% | 7 ppts |
| 2026-27 | 17% | 27% | 10 ppts | 23% | 31% | 8 ppts |
| 2027-28 | - | - | - | 23% | 32% | 9 ppts |
| 2028-29 | - | - | - | 22% | 32% | 10 ppts |
| 2029-30 | - | - | - | 22% | 32% | 10 ppts |
Notes: Dash indicates that year was not modelled. Figures may not sum due to rounding. Counterfactual scenario represents a hypothetical world in which a package of Scottish Government policies does not exist. Impact of policy package represents difference between baseline and counterfactual scenarios and is therefore affected by exogenous changes that affect these scenarios differentially. See Section 5.1 for further details. Source: SG analysis using UKMOD
| Baseline – February 2024 | Counter-factual – February 2024 | Impact of policy package – February 2024 | Baseline – March 2025 | Counter-factual – March 2025 | Impact of policy package – March 2025 | |
|---|---|---|---|---|---|---|
| 2021-22 | 19% | 22% | 2 ppts | - | - | - |
| 2022-23 | - | - | - | 23% | - | - |
| 2023-24 | 13% | 22% | 8 ppts | - | - | - |
| 2024-25 | 15% | 23% | 7 ppts | - | - | - |
| 2025-26 | - | - | - | 21% | 27% | 6 ppts |
| 2026-27 | 14% | 23% | 8 ppts | 18% | 29% | 11 ppts |
| 2027-28 | - | - | - | 18% | 29% | 11 ppts |
| 2028-29 | - | - | - | 18% | 29% | 11 ppts |
| 2029-30 | - | - | - | 18% | 29% | 11 ppts |
Notes: Dash indicates that year was not modelled. Figures may not sum due to rounding. Counterfactual scenario represents a hypothetical world in which a package of Scottish Government policies does not exist. Impact of policy package represents difference between baseline and counterfactual scenarios and is therefore affected by exogenous changes that affect these scenarios differentially. See Section 5.1 for further details. Source: SG analysis using UKMOD
3.2 Distributional impacts
To gain a more complete understanding of the impacts of the policy package, Table 3 compares the impacts on relative poverty with those on deep poverty and low income. Whereas the relative poverty line is set at 60% of UK median household income, deep poverty is set at 50% of the median, and low income at 70%. Deep poverty is therefore a more stringent definition of poverty, while low income captures households that are above the relative poverty line but still at risk of poverty.
The impact of the policy package on deep poverty is estimated to be seven percentage points in 2025-26, representing some 70,000 children who would otherwise be in deep poverty, rising to 10 percentage points or 100,000 children over the forecast horizon. This is consistent with our last update, which estimated the impact to be seven percentage points in 2024-25. The fact that this impact has remained stable further demonstrates how the reduction in impact on the relative measure is particularly sensitive to shifts in the poverty line driven by macroeconomic factors and UK Government policies.
The table shows that the policy package disproportionately benefits children further down the income distribution, with equal or greater impacts on deep poverty than on relative poverty. This demonstrates that the policy package is not just pushing households over the relative poverty line, but is also reducing the depth of poverty for tens of thousands of children. The lower impacts on the low-income measure reflect the fact that the policy package is mainly comprised of means-tested benefits, but still show that Scottish Government policies are significantly reducing the risk of child poverty for many households.
| Deep poverty (50% median) | Relative poverty (60% median) | Low income (70% median) | |
|---|---|---|---|
| 2025-26 | 7 | 7 | 5 |
| 2026-27 | 9 | 8 | 7 |
| 2027-28 | 10 | 9 | 7 |
| 2028-29 | 10 | 10 | 8 |
| 2029-30 | 10 | 10 | 8 |
Notes: Deep poverty defined as having household income below 50% of UK median; relative poverty defined as having household income below 60% of UK median; low income defined as having household income below 70% of UK median. Household income defined as net equivalised household income after housing costs. Source: SG analysis using UKMOD
There are by definition fewer children living in deep poverty than in relative poverty, and fewer living in relative poverty than in low income. In this sense, an impact of one percentage point is proportionately larger for deep poverty than it is for relative poverty – and proportionately larger for relative poverty than for low income – because it represents a higher percentage of children who would meet that definition of poverty if the policy package was not in place.
An alternative way to compare impacts across the three measures is to calculate this percentage for each measure – that is, the percentage of children in poverty in the counterfactual scenario who are not in poverty in the baseline scenario.[8] This is shown in Table 4. The table demonstrates that, when expressed as a proportion of the counterfactual poverty rate, the impacts of the policy package are even more targeted at children on the lowest incomes. In 2025-26, an estimated 41% of children who would have been in deep poverty if the policy package was not in place will not be in deep poverty, compared to 26% and 14% for relative poverty and low income respectively. By 2026-27, this proportion rises to 55%.
| Deep poverty (50% median) | Relative poverty (60% median) | Low income (70% median) | |
|---|---|---|---|
| 2025-26 | 41 | 26 | 14 |
| 2026-27 | 55 | 32 | 19 |
| 2027-28 | 55 | 33 | 21 |
| 2028-29 | 55 | 36 | 22 |
| 2029-30 | 55 | 37 | 21 |
Notes: Deep poverty defined as having household income below 50% of UK median; relative poverty defined as having household income below 60% of UK median; low income defined as having household income below 70% of UK median. Household income defined as net equivalised household income after housing costs. Source: SG analysis using UKMOD
We see a similar picture if we examine the impacts of the policy package across the income distribution. The following figures divide the population into ten equally sized groups, or deciles, in order of household income. Figure 3 presents the impacts of the package on average income in each decile in absolute terms, while Figure 4 shows the impact in percentage terms.
The figures show that the policy package is worth an average of £2,600 per year to households with children in the bottom decile in 2025-26, representing 21% of their income. By 2029-30, this value increases in nominal terms to £3,700, or 29% of average income. Overall, the figures show a highly progressive distribution of impacts, with lower-income households gaining the most.
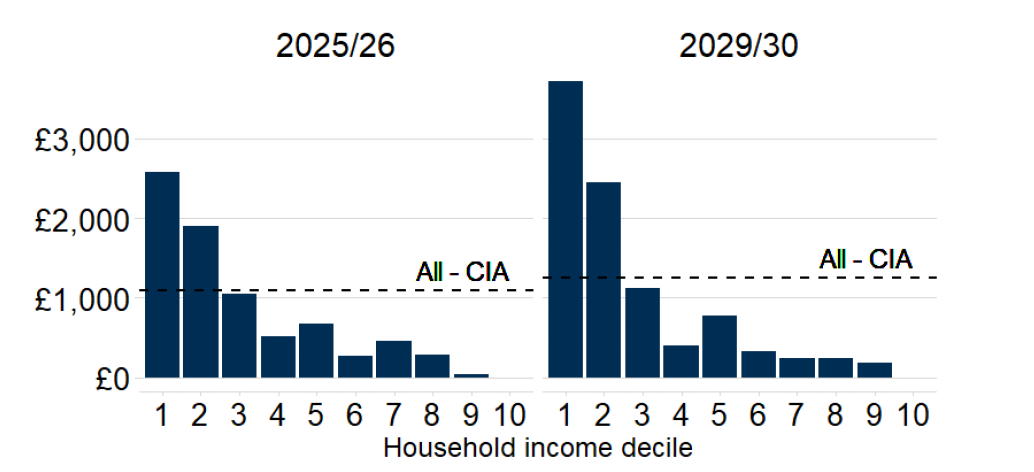
Notes: Income defined as net equivalised household income after housing costs. Dotted line shows average impact across all households with children. Deciles based on counterfactual scenario. Incomes expressed in nominal terms. Source: SG analysis using UKMOD
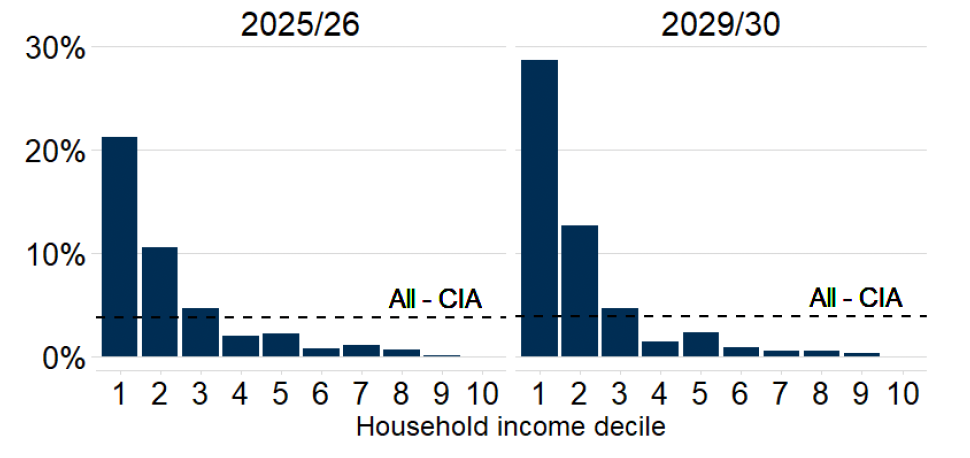
Notes: Income defined as net equivalised household income after housing costs. Dotted line shows average impact across all households with children. Deciles based on counterfactual scenario. Source: SG analysis using UKMOD
3.3 Individual policies
In addition to modelling the full policy package, we can use the same methodology to estimate the impacts of individual policies within the package. For each policy, a separate counterfactual is constructed in which that policy is removed while the rest of the policy package remains in place. Note that the cumulative impact of the policy package is not necessarily equal to the sum of the impacts of the individual policies when estimated by this method, as many households benefit from multiple policies within the package.[9]
In 2025-26, the impact of the Scottish Child Payment (SCP) on the relative child poverty rate is estimated to be four percentage points – representing 40,000 children – relative to a counterfactual scenario in which this policy did not exist. This estimate is validated by the latest poverty data, covering the period 2023-24, in which the relative child poverty rate was four percentage points lower than it would have been without SCP in place.[10]
Mitigating the two-child limit is estimated to have an impact of two percentage points on the relative child poverty rate in 2026-27, representing 20,000 children. The impacts can be expected to increase each year as more children are affected by the limit and become eligible for mitigation.[11] The two-child limit is explained in Section 4.1.1 and the policy to mitigate it is explained in Section 5.1.
Contact
Email: spencer.thompson@gov.scot