British Sign Language (BSL) national plan 2023-2029: consultation analysis
The independent analysis by Alma Economics of the BSL National Plan 2023 to 2029 consultation, commissioned by Scottish Government.
2. Methodology
The consultation opened on 7 July 2023 and closed on 3 September 2023. Response collection was conducted through the online Citizen Space portal. Respondents could submit a response to the consultation via the following means: (i) via the Citizen Space online platform, (ii) email (including PDF attachments), (iii) post (hard copy responses would be scanned as PDFs), (iv) participating in a consultation community engagement event or focus group, and (vi) submitting a response in BSL.
The consultation consisted of 31 questions, divided into two categories: 14 closed questions, which prompted yes/no/don’t know responses and required respondents to specify their type (individual or organisation; if an organisation, the organisation type, such as academic/research, Local Government, Public Body, Representative Body for Professionals, Third Sector/Deaf Organisation, Other; and whether they were BSL users, not BSL users, or preferred not to say) and 17 open questions, inviting free text responses.
These questions were structured along the six priority areas:
i) BSL Data Strategy;
ii) BSL Workforce;
iii) Supporting Deaf Children, Young People and their Families;
iv) BSL Accessibility;
v) Promotion of the Heritage and Culture of BSL;
vi) and Social Care and Wellbeing.
Responses also covered overall comments on the BSL National Plan 2023-2029 and Contact Scotland BSL.
A total of 80 responses were received, 76 directly via Citizen Space and 4 separately via email (in some cases including PDF attachments). Additionally, our analysis considered four reports that summarise findings from 43 consultation community events.
Answers were combined into a final Excel file used for subsequent coding. Only email or PDF responses that explicitly addressed consultation questions were added to respective Excel sheets per question. A total of 80 unique submissions answering the consultation questions were reviewed accordingly. A separate analysis sheet was added for email responses that did not directly answer the consultation’s questions, as well as for general comments about the consultation contained in email responses and community events reports that also included a consultation response form and were coded separately as “unstructured responses”.
All responses were reviewed in full. Before turning to the qualitative analysis of consultation responses, we first analysed the responses to the closed questions, calculating the total counts for each available option within each closed question, as well as the respective percentages in relation to the total number of responses received for each corresponding closed question. We also produced charts and tables to better present the distribution of responses to each closed question. All charts have Alt Text to enable full accessibility. An appendix for the report provides a comprehensive breakdown including: (i) tables presenting a breakdown of the total number of respondents to the consultation by respondent type (individual or organisation, whether the respondent is a BSL user or not, if an organisation the type of organisation, and for organisations that selected ‘other’ as organisation type, a description of their organisation), (ii) tables presenting the percentages of responses to the closed questions, (iii) tables presenting a breakdown of responses to the closed questions by respondent type (individual or organisation), (iv) tables presenting a breakdown of responses to the closed question by whether they are a BSL user or not.
Free text questions were categorised using a thematic analysis whereby responses were assigned key themes and coded accordingly. This qualitative research method (Braun and Clarke 2006) involved manually reviewing each response to identify common themes; connecting these themes to specific questions of the consultation to develop a narrative for each theme; cross-referencing the emerging themes to ensure the accuracy of the analysis; identifying responses that did not align with the general emerging themes but provided additional insights. These insights were included in the analysis, even though they were not raised by many respondents.
Additionally, we conducted thematic analysis of the reports from the 43 community events, identifying themes related to each question of the consultation document. Following this process, we complemented our initial thematic analysis findings with additional themes that were emerging from the discussion in community events. In case community events reports highlighted themes that were not covered in the online consultation responses, we updated our report with the new themes to ensure all consultation respondents were considered in full.
This report lists the number of responses to each question at the beginning of each section. The main body of this report follows the consultation’s question order, and themes for each free text question are presented in order of frequency (descending by the number of respondents mentioning the respective theme).
While the analysis of free text questions is qualitative and cannot be quantified, a general rule of thumb was applied to indicate the frequency of emerging themes using specific phrases, which could provide an estimate of the number of respondents discussing each respective theme. In particular:
- “a small number” indicated up to 5 respondents.
- “a few” indicated around 6-9 respondents.
- “a small minority” indicated more than 9 respondents but less than 10%.
- “a significant minority” indicated between approximately 10-24% of respondents.
- “a large minority” indicated more than a quarter of respondents but less than half.
- “a majority” indicated more than 50% of those who commented on the question.
Respondents were self-selecting and may not represent wider public opinion across Scotland. Where appropriate, individual quotes have been used to illustrate the narrative around specific themes, with quotes selected only from respondents who provided permission for their views to be published and with any potential identifiers (such as the name of a specific organisation) removed. Typos in selected quotes have been corrected to ensure uninterrupted readability of shared views.
Respondent characteristics
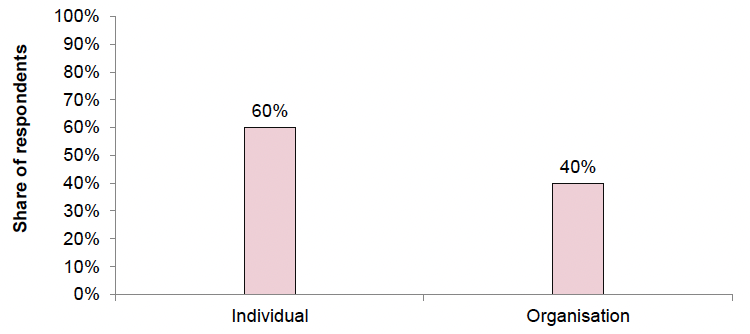
A total of 80 respondents participated in this consultation, with 48 (60%) being individual respondents and 32 (40%) representing organisations.
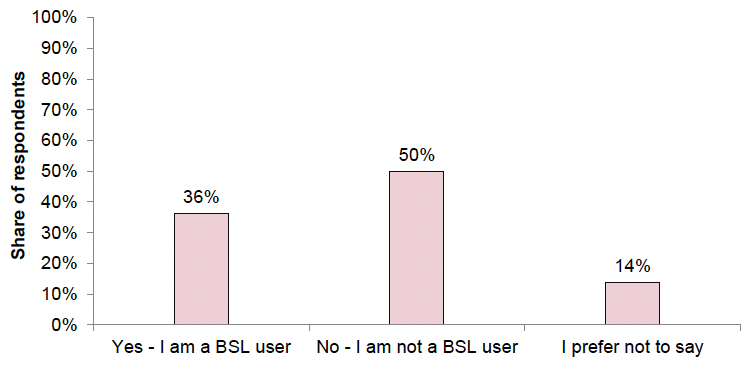
Among the respondents to the consultation, 36% were BSL users, 50% were not BSL users, and 14% of respondents preferred not to say whether they were BSL users or not.
Contact
Email: dobs@gov.scot