Behaviour in Scottish schools: research report 2023
This report is the fifth (2023) wave of the Behaviour in Scottish Schools Research, first undertaken in 2006.
Chapter 4 – Overall perceptions of behaviour
Summary of findings
Staff were asked about their experience of a wide range of positive behaviours and disruptive behaviours across 3 categories (low level disruptive, disengagement, serious disruptive). For low level and disengagement behaviours the proportion of staff that have experienced each of these at least once a day in the last teaching week is reported on. Among the serious disruptive behaviours staff were first asked how frequently they had experienced each of these behaviours between pupils in the last teaching week. They were then asked how frequently they had experienced these serious disruptive behaviours being directed at themselves or other staff[46].
Both primary and secondary school staff reported generally good behaviour among most or all pupils in the classroom (65%) and around the school (85%). However, low level disruptive behaviour, disengagement and particular serious disruptive behaviours were also frequently experienced by staff. One of the most common low-level disruptive behaviour was pupils talking out of turn, with 86% of staff having encountered this at least once a day in the last week. One of the most common disengagement behaviours was pupils withdrawing from interaction with staff/others, with 43% having encountered this on a daily basis.
The most common forms of serious disruptive behaviours between pupils were physical and verbal abuse which were encountered by a considerable proportion of staff on a routine basis, particularly physical aggression, general verbal abuse and physical violence[47]. Two-thirds (67%) had encountered general verbal abuse, 59% physical aggression and 43% physical violence between pupils in the classroom in the last week. The proportion of staff witnessing abuse between pupils related to protected characteristics was less common, but for some types of abuse this was still reported by around 1 in 5 staff in the last week. For example, 24% of staff encountered abuse towards pupils who have additional support needs in the last week, 18% encountered sexist abuse or harassment and homophobic, biphobic or transphobic abuse towards other pupils and 17% encountered racist abuse towards other pupils in the classroom in the last week.
There were differences in the types of behaviour experienced by staff in different roles. Headteachers were more likely to report higher levels of positive behaviour and lower levels of disruptive behaviour than teachers or support staff. However, a higher proportion of headteachers reported having experienced at least one instance of physical violence and aggression and verbal abuse towards them personally in the last 12 months compared with other staff. Support staff were more likely than headteachers or teachers to encounter almost all types of serious disruptive behaviours between pupils. In addition, a higher proportion of support staff report having experienced the greatest number (21 or more) instances of physical aggression and violence towards them in the last 12 months compared with other staff. Teachers were more likely to report at least one personal experience of racist and sexist abuse or harassment in the last 12 months compared with other staff.
Positive behaviours were encountered more often in primary schools than in secondary schools. Most of the low level and negative behaviours were more common in secondary schools than primary schools. There was general trend of positive behaviours decreasing and negative behaviours increasing with increased pupil age. The exception was physical aggression and violence, both directed at other pupils and towards staff, which were more often experienced in primary schools compared with secondary schools. Primary 1 -3 teachers were also more likely to encounter these behaviours towards themselves or other staff in the classroom compared with P4-7 teachers and in P4-7 compared with in secondary school.
The use of mobile phones and digital technologies abusively was also one of the most frequently experienced serious disruptive behaviours among secondary staff. Among the other most frequently experienced serious disruptive behaviours in secondary schools were general verbal abuse between pupils and towards staff, physical aggression/violence between pupils and pupils under the influence of drugs/alcohol. P4-7 teachers report higher frequencies of all low level disruptive behaviours in the classroom than P1-3 teachers. In terms of disengagement, pupils deliberately socially excluding others was more commonly experienced by primary staff but pupils leaving the classroom without permission or truanting are more likely to be reported in secondary school.
Whilst over a third of staff had experienced general verbal abuse[48] and 16% had experienced physical aggression and 11% physical violence towards themselves or other staff in the last week, it was relatively unusual for staff to report that they routinely experienced abuse directed towards themselves or other staff related to race, sex and sexuality, religion, or disability. A small proportion (6% or less[49]) of all staff had personally experienced abuse due to each of the protected characteristics in the last 12 months. However, as staff demographics relating to protected characteristics other than gender are not captured by the survey, it is not possible to ascertain whether the study accurately reflects the experiences of these demographic groups. A higher proportion of secondary school staff report experiencing sexist abuse or harassment, racist, religious and homophobic, biphobic or transphobic abuse compared with primary school staff.
Introduction
This chapter provides an overview of survey findings relating to staff perceptions of pupil behaviour in the classroom and around the school. It discusses different types of behaviour including positive, low level disruptive and serious disruptive. Differences in perceptions between staff in different roles are considered along with differences between staff in primary and secondary schools and those working with pupils in primaries 1-3 and in primaries 4-7.
Headteachers and teachers were asked about behaviours around the school and in the classroom whilst support staff were asked only about behaviours in the classroom.
General behaviour
To measure general behaviour around the school, staff were asked how many pupils they found to be generally well behaved. Responses were given on a five-point scale ranging from ‘all/almost all’ to ‘none/almost none’. For the purposes of summarising the findings, results for the two highest categories ‘all/almost all’ and ‘most’ have been combined.
The majority (85%) of staff report that most/all pupils are well behaved around the school. There are differences here by staff type with headteachers being more likely to report all or most children being generally well behaved (99%) than teachers (85%) or support staff (84%). Primary school staff are also more likely than secondary school staff to report that all or most pupils are well behaved around the school (89% compared with 81%, Table 4.1).
To capture perceptions of general behaviour in the classroom, headteachers were asked how many pupils they believed were generally well behaved in lessons whilst teachers and support staff were asked in how many lessons they find pupils generally well behaved. Although most staff (65%) report that all or most pupils are generally well behaved in the classroom (or that in all or most lessons pupils are generally well behaved), it is clear that perceptions of behaviour in the classroom are less positive than perceptions of behaviour around the school.
Similar to behaviour around school, headteachers are more likely to report good behaviour than teachers or support staff. Almost all (98%) headteachers believed that most/all pupils are well behaved in lessons compared with 69% of teachers and 50% of support staff. Perceptions also vary by school type with primary school staff more likely to report positive behaviour in the classroom than secondary school staff (71% compared with 58%, see Table 4.1).
| In the classroom (%) | Around the school (%) | Unweighted bases | ||
|---|---|---|---|---|
| Staff type | Headteacher | 98 | 99 | 357 |
| Teachers | 69 | 85 | 2354 | |
| Support staff | 50 | 84 | 1026 | |
| School type | Primary | 71 | 89 | 1340 |
| Secondary | 58 | 81 | 2397 | |
| All | 65 | 85 | 3737 | |
Where headteachers and teachers said that at least some pupils were generally well behaved around the school, they were then asked a series of follow-up questions asking about general behaviour in specific parts of the school including corridors, toilets, the dining hall, playground/social areas and other areas of the school grounds. Support staff were not asked these questions as they were only asked questions relating to pupil behaviour in the classroom.
The patterns in perceptions of behaviour around the school generally by school and staff type are largely repeated in views about behaviour in different areas of the school. Headteachers are more likely than teachers to consider all or most pupils well-behaved in all areas of the school, including in particular corridors (97% compared with 71%) and toilets (86% compared with 53%). Similarly, primary school staff are more likely to report more positive behaviour than secondary school staff (Table 4.2). For example, 81% of primary school staff believe all or most pupils are well behaved in corridor areas compared with 63% of secondary school staff. Toilets are the area where staff are least likely to report positive behaviour. This is particularly the case for secondary school staff only 40% of whom believe all or most pupils are generally well behaved in the school toilets.
| Corridor (%) | Toilets (%) | Dining hall (%) | Playground/social areas (%) | Other areas of school grounds (%) | ||
|---|---|---|---|---|---|---|
| Staff type | Headteacher | 97 | 86 | 99 | 94 | 97 |
| Teachers | 71 | 53 | 76 | 69 | 73 | |
| School type | Primary | 81 | 66 | 82 | 73 | 81 |
| Secondary | 63 | 40 | 74 | 66 | 66 | |
| Unweighted bases | Headteacher | 348 | 349 | 347 | 348 | 335 |
| Teachers | 2264 | 2022 | 2028 | 2132 | 2063 | |
| Primary | 864 | 849 | 848 | 859 | 827 | |
| Secondary | 1748 | 1522 | 1527 | 1621 | 1571 | |
Positive behaviour
In the classroom
To explore positive behaviour in more detail, headteachers, teachers, and support staff were asked how often they had experienced specific positive pupil behaviours in class over the last full teaching week. Behaviours included, for example, pupils following instructions and contributing to class discussions. Responses were on a five-point scale from ‘all lessons’ to ‘no lessons’. In presenting the findings, results for the two highest categories ‘all’ and ‘most’ have been combined.
The most commonly reported positive behaviours are pupils following instructions and pupils seeking support from staff or peers when needed. For each, 69% of staff had observed this in all or most lessons in the past week. The least common positive behaviours are pupils listening to others and contributing actively during group work and pupils working independently without adult support when appropriate. Forty-nine percent of staff had experienced the former behaviours and 44% the latter behaviours in all or most lessons over the last week.
Experience varies by staff type (Table 4.3). Headteachers report the highest frequency of positive behaviours followed by teachers and support staff. For example, 91% of headteachers say that pupils listened to staff respectfully in all or most lessons compared with 63% of teachers and 45% of support staff.
| All (%) | Headteacher (%) | Teacher (%) | Support staff (%) | |
|---|---|---|---|---|
| Pupils following instructions | 69 | 97 | 74 | 53 |
| Pupils settling down quickly | 55 | 92 | 58 | 42 |
| Pupils contributing to class discussions | 68 | 91 | 69 | 61 |
| Pupils listening to others’ views respectfully | 51 | 83 | 53 | 42 |
| Pupils listening to staff respectfully | 59 | 91 | 63 | 45 |
| Pupils keenly engaging with their tasks | 58 | 85 | 62 | 43 |
| Pupils seeking support from staff or peers when needed | 69 | 87 | 68 | 68 |
| Attentive, interested pupils | 59 | 90 | 62 | 45 |
| Pupils arriving promptly for classes | 64 | 87 | 64 | 60 |
| Pupils interacting supportively with each other | 54 | 81 | 54 | 49 |
| Pupils enthusiastically participating in classroom activities | 58 | 83 | 61 | 50 |
| Pupils listening to others and contributing actively during group work | 49 | 77 | 49 | 44 |
| Pupils working independently without adult support when appropriate | 44 | 77 | 46 | 35 |
| Unweighted bases | 3732 | 351 | 2352 | 1035 |
There are also differences by school type with primary school staff experiencing all positive behaviours more frequently than secondary school staff (Table 4.4). The difference between primary and secondary staff experiences was particularly stark in relation to pupils arriving promptly for class (78% of primary staff reported this for all or most lessons compared with 48% of secondary staff), which may be expected given the different arrangements in the two school types[50]. However, notable differences are also seen in relation to pupils contributing to class discussions, pupils seeking support from staff or peers when needed, pupils enthusiastically participating in classroom activities and pupils listening to others and contributing actively during group work.
| Primary (%) | Secondary (%) | |
|---|---|---|
| Pupils following instructions | 73 | 64 |
| Pupils settling down quickly | 61 | 49 |
| Pupils contributing to class discussions | 81 | 53 |
| Pupils listening to others’ views respectfully | 60 | 41 |
| Pupils listening to staff respectfully | 67 | 51 |
| Pupils keenly engaging with their tasks | 70 | 44 |
| Pupils seeking support from staff or peers when needed | 82 | 54 |
| Attentive, interested pupils | 70 | 46 |
| Pupils arriving promptly for classes | 78 | 48 |
| Pupils interacting supportively with each other | 65 | 41 |
| Pupils enthusiastically participating in classroom activities | 72 | 44 |
| Pupils listening to others and contributing actively during group work | 62 | 34 |
| Pupils working independently without adult support when appropriate | 51 | 37 |
| Unweighted bases | 1340 | 2398 |
For some behaviours, different experiences are also reported by primary teachers responsible for different year groups (Table 4.5). For all questions, P4-7 teachers report less frequent positive behaviours in the classroom than P1-3 teachers. For example, 77% of P1-3 teachers experienced pupils enthusiastically participating in classroom activities in most or all lessons in the past week compared with 68% of P4-7 teachers.
| Primary 1-3 (%) | Primary 4-7 (%) | |
|---|---|---|
| Pupils contributing to class discussions | 86 | 80 |
| Pupils listening to others’ views respectfully | 64 | 59 |
| Pupils keenly engaging with their tasks | 76 | 71 |
| Attentive, interested pupils | 76 | 68 |
| Pupils interacting supportively with each other | 66 | 61 |
| Pupils enthusiastically participating in classroom activities | 77 | 68 |
| Unweighted bases | 296 | 387 |
Around the school
In addition to questions on positive behaviour in class, headteachers and teachers were also asked how often they had experienced certain positive pupil behaviours around the school over the last full teaching week. The behaviours covered this time included taking turns, making positive use of school facilities during breaks and using litter bins. Staff indicated whether they had experienced each behaviour always, on most occasions, sometimes, seldom or never. Findings are generally reported in relation to a category combining the proportion of staff selecting ‘always’ or ‘on most occasions’
Staff are most likely to frequently encounter pupils greeting them pleasantly – 69% saying this happened always or on most occasions – and least likely to encounter pupils challenging others’ negative behaviour – only 14% said this happened always or on most occasions[51].
Similar to patterns seen in relation to individual positive behaviours in the classroom, experiences of positive behaviour around the school varied by staff and school type. Headteachers are more likely than teachers to more frequently encounter positive behaviour around the school (Table 4.6). For example, 96% of headteachers encountered pupils greeting staff pleasantly always or on most occasions compared with 68% of teachers.
| All (%) | Headteacher (%) | Teacher (%) | |
|---|---|---|---|
| Pupils actively helping their peers | 57 | 87 | 56 |
| Pupils taking turns | 59 | 89 | 58 |
| Pupils making positive use of school facilities during breaks (e.g., the library, sports facilities) | 48 | 75 | 47 |
| Pupils engaged in playing games and sports together | 60 | 85 | 59 |
| Pupils queuing in an orderly manner | 51 | 86 | 49 |
| Pupils respecting toilet/break/cloakroom areas | 33 | 69 | 32 |
| Pupils using litter bins | 49 | 82 | 48 |
| Pupils greeting staff pleasantly | 69 | 96 | 68 |
| Pupils challenging others’ negative behaviour | 14 | 22 | 14 |
| Pupils interacting supportively with each other | 54 | 83 | 53 |
| Unweighted bases | 2648 | 351 | 2279 |
Primary school staff more frequently report encountering all positive behaviours around school than secondary school staff (Figure 4.1). The difference in experience is largest in relation to pupils using litter bins - 71% of primary staff encountered this always or on most occasions compared with just 26% of secondary staff.
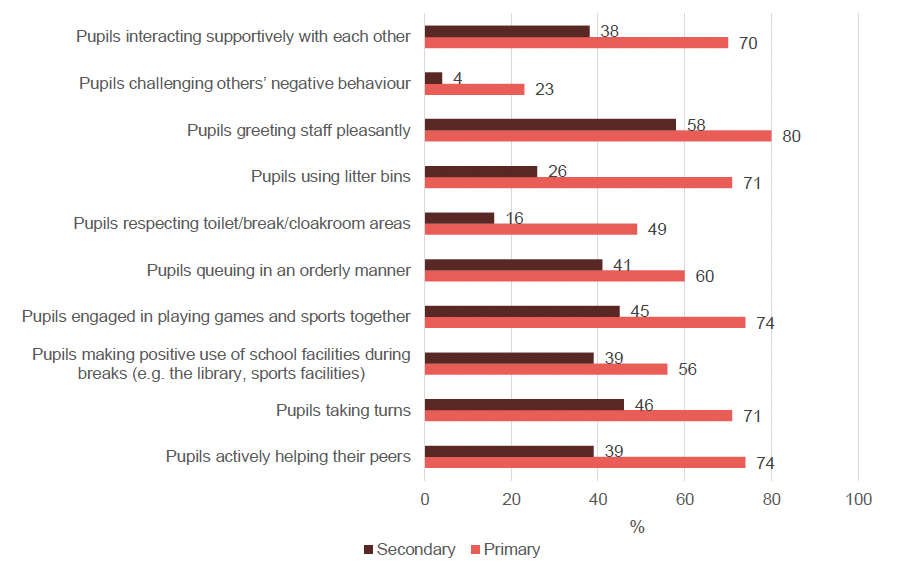
Some limited differences in experience are reported between primary teachers with lower and upper school classes. P4-7 teachers are less likely than P1-3 teachers to frequently encounter pupils queuing in an orderly manner (54% always or on most occasions compared with 61%) and pupils interacting supportively with each other (64% compared with 72%), although upper primary school teachers are more likely than secondary teachers to frequently encounter all behaviours. These figures are shown in supplementary tables 4.22-4.31.
Low level disruptive behaviour
In the classroom
A series of questions were asked to capture how often staff had to deal with specific types of low level disruptive behaviour over the last full teaching week. Eleven types of behaviour were covered including talking out of turn, hindering other pupils, not being punctual and work avoidance. Headteachers were asked how often each behaviour had been referred on to them and how often they think teachers within the school would have to deal with low level disruptive behaviour in the last teaching week. Teachers and support staff were asked how often they had to deal with the particular behaviour in class over the last week. In both cases, staff responded using a seven point range from several times a day to not at all.
The most frequent disruptive behaviour experienced is talking out of turn - 86% of staff had dealt with this at least once a day. The least common behaviour was pupils going on to websites they shouldn’t (e.g. to play games or use social media) when digital technologies were being used in teaching and learning. Forty percent of staff experienced this at least once a day.
The overall figures mask some variation across staff groups (Table 4.7). The findings show that low level disruption in the classroom is not often referred on to headteachers but it is frequently experienced by a large majority of teachers and support staff. The experience of teachers and support staff is similar in relation to most behaviours, but support staff are more likely to report experiencing some behaviours more often. For example, 68% of support staff experience cheeky or impertinent remarks at least once a day compared with 57% of teachers. Support staff also experience children getting out of their seat without permission and general rowdiness more frequently than teachers.
| All (%) | Headteacher (%) | Teacher (%) | Support staff (%) | |
|---|---|---|---|---|
| Talking out of turn (e.g., by making remarks, calling out, distracting others by chattering) | 86 | 27 | 88 | 86 |
| Making unnecessary (non-verbal) noise (e.g., by scraping chairs, banging objects) | 74 | 19 | 75 | 78 |
| Hindering other pupils (e.g., by distracting them from work, interfering with materials) | 76 | 23 | 77 | 77 |
| Getting out of their seat without permission | 69 | 22 | 68 | 76 |
| Not being punctual (e.g., being late to lessons) | 58 | 16 | 60 | 56 |
| Persistently infringing class rules (e.g., pupil behaviour, safety) | 57 | 22 | 56 | 63 |
| Work avoidance (e.g., delaying start to work set) | 72 | 22 | 74 | 74 |
| Cheeky or impertinent remarks or responses | 59 | 21 | 57 | 68 |
| General rowdiness, horseplay or mucking about | 62 | 19 | 61 | 70 |
| Using/looking at mobile phones/tablets etc. when they shouldn’t (e.g., messaging, playing games, listening to music) | 48 | 9 | 51 | 47 |
| Going on sites they shouldn’t (e.g., to play games, use social media) when digital technologies used in teaching and learning | 40 | 7 | 42 | 41 |
| Unweighted bases | 3687 | 355 | 2344 | 1028 |
Headteachers seem to appreciate how commonly teachers are having to deal with low level disruptive behaviours in the classroom, even though these behaviours are not often referred onto them. The majority (80%) of headteachers reported that they think that teachers within their school would have to deal with low level disruptive behaviour in the classroom at least once a day. This varied by school type with secondary headteachers more likely to report this (92%) compared with primary headteachers (77%).
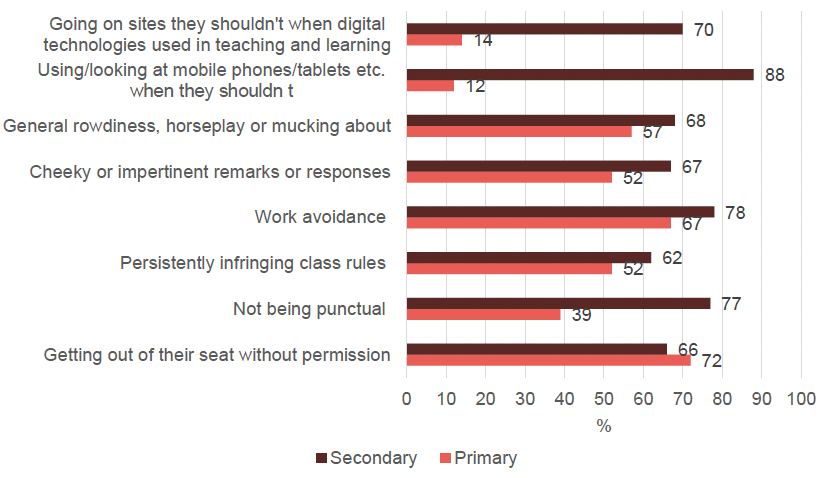
The experience of low level disruptive behaviour in class differs between staff in primary and secondary schools (Figure 4.2). For example, secondary staff are more likely than primary staff to report more frequent occurrence of lack of punctuality (77% of secondary staff experienced this at least once a day compared with 39% of primary staff) and work avoidance (78% compared with 67%). In contrast, primary staff experienced children getting out of their seat without permission more often than secondary staff (72% at least once a day compared with 66%). A number of further differences between the experiences of primary and secondary staff reflect, in a way similar to the difference on punctuality, the different teaching and learning contexts in which they operate. For example, there is a notable difference between primary and secondary school staff in terms of their experience of disruptive behaviour involving technology, which is more common for secondary staff. Eighty-eight percent of secondary staff experience pupils using or looking at mobile phones/tablets when they shouldn’t at least once a day and 70% experience pupils going on sites they shouldn’t when digital technologies are being used at least once a day compared with 12% and 14% of primary staff respectively.
Experience of low level disruptive behaviour in the classroom also differs by primary stage (Table 4.8). P4-7 teachers report higher frequencies of all of these behaviours than P1-3 teachers. In particular, compared with P1-3 teachers, those teaching P4-7 report more frequent experience of pupils getting out of their seat without permission (80% experience at least once a day compared with 70%), cheeky or impertinent remarks (60% compared with 49%) and pupils going on sites they shouldn’t when digital technologies are used (22% compared with 11%).
| P1-3 (%) | P4-7 (%) | |
|---|---|---|
| Talking out of turn (e.g., by making remarks, calling out, distracting others by chattering) | 92 | 93 |
| Making unnecessary (non-verbal) noise (e.g., by scraping chairs, banging objects) | 76 | 81 |
| Hindering other pupils (e.g., by distracting them from work, interfering with materials) | 78 | 82 |
| Getting out of their seat without permission | 70 | 80 |
| Not being punctual (e.g., being late to lessons) | 42 | 45 |
| Persistently infringing class rules (e.g., pupil behaviour, safety) | 55 | 56 |
| Work avoidance (e.g., delaying start to work set) | 66 | 75 |
| Cheeky or impertinent remarks or responses | 49 | 60 |
| General rowdiness, horseplay or mucking about | 60 | 62 |
| Using/looking at mobile phones/tablets etc. when they shouldn’t (e.g., messaging, playing games, listening to music) | 9 | 16 |
| Going on sites they shouldn’t (e.g., to play games, use social media) when digital technologies used in teaching and learning | 11 | 22 |
| Unweighted bases | 295 | 385 |
Around the school
To further explore lower level disruptive behaviour, headteachers and teachers were asked how often they had encountered a range of other types of negative behaviour around the school over the last full teaching week. Behaviours this time ranged from running in the corridor to leaving the school premises without permission. Again, staff responded on a seven point scale ranging from several times a day to not at all.
Running in the corridor is the behaviour headteachers and teachers most frequently experience – 68% do so at least once a day. In contrast, using digital technology (e.g. computers, tablets, mobile phones) against school policy was the least common behaviour experienced, though still encountered by 39% of staff at least once a day.
Again, following trends reported already, headteachers encounter all behaviours less frequently than teachers (Table 4.9). For example, 58% of teachers experience unruliness of pupils whilst they are waiting to enter classrooms or for lunch compared with 19% of headteachers.
| All (%) | Headteacher (%) | Teacher (%) | |
|---|---|---|---|
| Running in the corridor | 68 | 36 | 69 |
| Unruliness while waiting (e.g., to enter classrooms, for lunch) | 56 | 19 | 58 |
| Showing lack of concern for others | 46 | 15 | 48 |
| Persistently infringing school rules | 53 | 20 | 55 |
| Cheeky or impertinent remarks or responses | 52 | 22 | 53 |
| Loitering in ‘prohibited’ areas | 48 | 18 | 49 |
| General rowdiness, horseplay or mucking about | 58 | 22 | 59 |
| Using digital technology (e.g., computers, tablets, mobile phones) against school policy | 39 | 8 | 41 |
| Unweighted bases | 2590 | 353 | 2300 |
Secondary school staff are more likely than primary school staff to report experiencing a higher frequency of all these behaviours (Figure 4.3). There are particularly stark and perhaps unsurprising differences between primary and secondary staff in their experience of pupils using digital technology against school policy (73% of secondary staff encountering at least once a day compared with 7% of primary staff) and loitering in prohibited areas (68% of secondary staff encountering at least once a day compared with 28% of primary staff). Experiences between school types are more similar in relation to running in the corridor and unruliness while waiting.
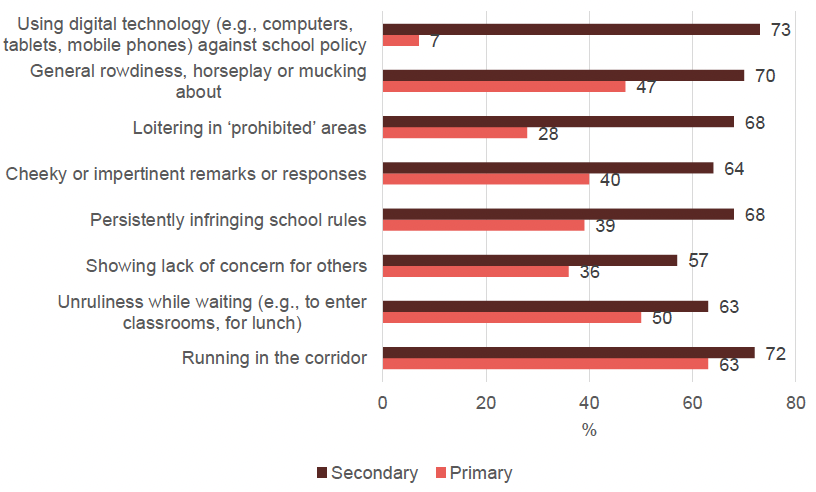
The experience of lower and upper primary school teachers is broadly similar in relation to these behaviours. There are only two behaviours experienced notably more often by P4-7 teachers: cheeky or impertinent remarks or responses (45% experience at least once a day compared with 40% of P1-3 teachers) and using digital technology against school policy (10% compared with 4%). These figures are shown in supplementary tables 4.45-4.53.
Disengagement
In the classroom
Teachers and support staff were also asked how often they had encountered a range of pupil disengagement behaviours in class in the last full teaching week. These behaviours included pupils: withdrawing from interaction with staff/others; deliberately socially excluding others; leaving the classroom without permission and missing lessons (e.g. truancy).
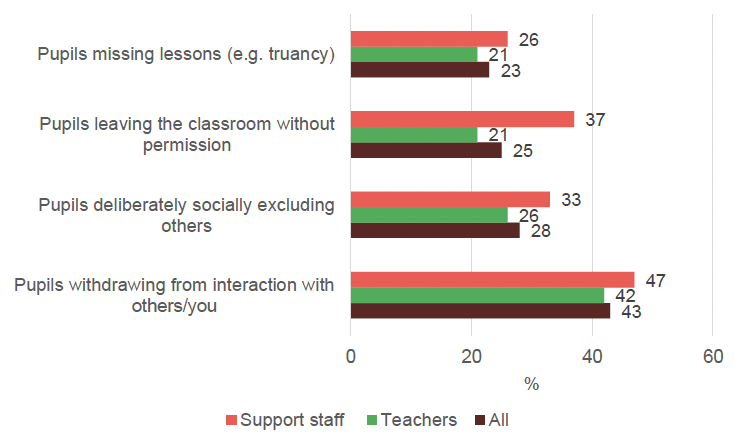
Staff are most likely to experience pupils withdrawing from interaction and least likely to experience pupils missing lessons. Forty-three percent of teachers and support staff encountered pupils withdrawing from interaction at least once a day and 23% encountered pupils missing lessons at least once a day.
Support staff report higher levels of disengagement behaviours than teachers, particularly in relation to pupils leaving the classroom (Figure 4.4). In the last week, 37% of support staff had experienced this at least once a day compared with 21% of teachers. This is perhaps expected given that support staff are often working closely with pupils who exhibit more disruptive behaviour.
Some classroom disengagement behaviours varied by school type. Pupils deliberately socially excluding others was more commonly experienced by primary staff (42% experience this at least once a day compared with 34% of secondary staff) but pupils leaving the classroom without permission or truanting are more likely to happen in secondary school. Forty-one percent of secondary school staff encounter this at least once a day compared with just 5% of primary staff. There are no differences in withdrawing from interaction by school type and experiences of P1-3 and P4-7 staff are also broadly similar.
Around the school
Headteachers and teachers were asked how often they had encountered the same set of behaviours around the school in the last full teaching week.
The frequency of these behaviours encountered by staff around the school is broadly similar with each experienced at least once a day by between 20% and 26% of staff. Pupils socially excluding others was the least common behaviour encountered and pupils truanting was the most common. A similar proportion of staff encountered pupils missing lessons, as presented above, and truanting (23% and 26%).
Following the trends seen for other behaviours, headteachers are less likely than teachers to have encountered all behaviours (Table 4.10).
Differences by school type mirror those seen in relation to classroom disengagement. The experience of primary and secondary school staff is more similar in relation to pupils withdrawing from interaction and socially excluding others but quite different in terms of pupils leaving the classroom without permission and truanting. For example, whilst 50% of secondary staff experience truanting at least once a day, the same is true of only 4% of primary staff.
| All (%) | Headteacher (%) | Teacher (%) | |
|---|---|---|---|
| Pupils withdrawing from interaction with you/others | 22 | 9 | 23 |
| Pupils deliberately socially excluding others | 20 | 7 | 20 |
| Pupils leaving school premises without permission | 21 | 7 | 21 |
| Pupils truanting | 26 | 11 | 27 |
| Unweighted bases | 2552 | 353 | 2119 |
Serious disruptive behaviour
Serious disruptive behaviour by pupils includes different types of verbal abuse towards staff and other pupils - such as sexist or racist abuse – and physical abuse and aggression, including violence towards staff and other pupils and damage of school property. This section reports on the proportion of staff having experienced each of these at least once during the last teaching week, rather than at least once a day as these occur less frequently than low-level and disengagement behaviours. Staff were first asked how frequently they had experienced each of these behaviours between pupils in the last teaching week. They were then asked how frequently they had experienced these behaviours being directed at themselves or other staff[52].
In the classroom
Physical and verbal abuse towards pupils
Headteachers, teachers and support staff were asked how often they experienced different types of physical and verbal abuse between pupils during lessons over the last teaching week.
As may be expected, many of these more serious behaviours are less common than the low level disruptive behaviours and disengagement that have already been discussed. Therefore, for these behaviours the proportion of staff that have encountered these at least once in the last teaching week have been reported. Nevertheless, some types of physical and verbal abuse between pupils are seen by a considerable proportion of staff on a routine basis.
General verbal abuse (including offensive, insulting, or threatening remarks) and physical aggression between pupils, such as pushing or squaring up, are the behaviours most likely to have been encountered by staff. Over two-thirds (67%) encountered the former and 55% the latter at least once a week. In contrast, only 5% of staff experience religious abuse towards other pupils at least once a week making it the least common behaviour encountered.
Overall, the majority (76-95%) of staff have not encountered abuse towards other pupils due to each of the protected characteristics at all in the classroom in the last teaching week. This does not include general verbal abuse and physical aggression/violence which were all encountered towards other pupils more frequently. See supplementary tables 4.62-4.71 for the full breakdown of how frequently staff have encountered each of these serious disruptive behaviours in the classroom towards other pupils.
Reports of serious disruptive behaviour directed towards other pupils in the classroom differs by staff type. On almost all of the behaviours measured here, support staff are more likely than headteachers or teachers to encounter it (Table 4.11). Notable differences can be seen in relation to abuse towards pupils with a disability or additional support needs. For example, 30% of support staff encounter abuse towards pupils who have additional support needs at least once a week compared with 23% of teachers and 13% of headteachers. The experience of different staff is more similar in relation to physical abuse, though support staff are still more likely than headteachers and teachers to encounter physical destructiveness and aggression. All staff types are similarly likely to encounter physical violence between pupils with 43% doing so at least once a week.
| All (%) | Headteacher (%) | Teacher (%) | Support staff (%) | |
|---|---|---|---|---|
| Racist abuse towards other pupils | 17 | 19 | 16 | 22 |
| Sexist abuse or harassment of other pupils | 18 | 12 | 17 | 22 |
| Abuse towards other pupils who have a disability | 12 | 5 | 10 | 19 |
| Abuse towards other pupils who have additional support needs | 24 | 13 | 23 | 30 |
| Religious abuse towards other pupils | 5 | 1 | 5 | 7 |
| Homophobic, biphobic or transphobic abuse towards other pupils | 18 | 10 | 19 | 17 |
| General verbal abuse towards other pupils (e.g., offensive, insulting, or threatening remarks) | 67 | 57 | 67 | 69 |
| Physical destructiveness (e.g., breaking objects, damaging furniture and fabric) | 47 | 39 | 46 | 50 |
| Physical aggression towards other pupils (e.g., by pushing, squaring up) | 59 | 59 | 56 | 70 |
| Physical violence towards other pupils (e.g., punching, kicking, head butting, use of a weapon, throwing objects) | 43 | 48 | 40 | 52 |
| Unweighted bases | 3718 | 356 | 2346 | 1025 |
Reports of physical and verbal abuse amongst pupils also varies by school type (Table 4.12). Primary school staff are more likely than secondary staff to encounter a higher frequency of physical aggression and violence between pupils. For example, 52% of primary staff encounter physical violence between pupils at least once a week compared with 33% of secondary staff. In contrast, secondary staff report higher frequencies of most other kinds of abuse. The difference is particularly stark in relation to homophobic, biphobic or transphobic abuse towards other pupils which 30% of secondary staff encounter at least once a week compared with 8% of primary staff. But notable differences are also evident in experience of sexist abuse or harassment and general verbal abuse.
| Primary (%) | Secondary (%) | |
|---|---|---|
| Racist abuse towards other pupils | 13 | 22 |
| Sexist abuse or harassment of other pupils | 10 | 27 |
| Abuse towards other pupils who have a disability | 7 | 17 |
| Abuse towards other pupils who have additional support needs | 18 | 31 |
| Religious abuse towards other pupils | 3 | 7 |
| Homophobic, biphobic or transphobic abuse towards other pupils | 8 | 30 |
| General verbal abuse towards other pupils (e.g., offensive, insulting, or threatening remarks) | 59 | 76 |
| Physical aggression towards other pupils (e.g., by pushing, squaring up) | 63 | 55 |
| Physical violence towards other pupils (e.g., punching, kicking, head butting, use of a weapon, throwing objects) | 52 | 33 |
| Unweighted bases | 1335 | 2392 |
Staff in upper and lower primary school also report differences in their experience of verbal abuse towards pupils in the classroom. Staff working with pupils in P4-7 report higher frequencies of most behaviours than those working with pupils in P1-3[53]. For example, 16% of P4-7 staff encounter racist abuse towards other pupils at least once a week compared with 7% of P1-3 staff. Although the frequency of experiencing different behaviours varies, the margin of difference between upper and lower primary staff in the proportion who encounter the behaviour at least once a week is similar for each behaviour at around 5-9 percentage points.
| P1-3 (%) | P4-7 (%) | |
|---|---|---|
| Racist abuse towards other pupils | 7 | 16 |
| Sexist abuse or harassment of other pupils | 6 | 12 |
| Abuse towards other pupils who have a disability | 4 | 9 |
| Abuse towards other pupils who have additional support needs | 16 | 23 |
| Homophobic, biphobic or transphobic abuse towards other pupils | 5 | 12 |
| General verbal abuse towards other pupils (e.g., offensive, insulting or threatening remarks) | 56 | 64 |
| Unweighted bases | 295 | 385 |
Use of a weapon towards pupils
Staff who reported any experience of violent behaviour towards other pupils in the classroom (43%) were asked how frequently these incidences involved the use of weapon. Of this group, 14% of staff reported that they had to deal with the use of a weapon specifically at least once in the last week. This equates to around 6% of all staff. Experiences of physical violence towards other pupils involving a weapon did not vary by staff type or school type. See supplementary table 4.71 for a full breakdown of these figures.
Physical and verbal abuse towards staff
Along with questions on abuse towards pupils experienced in class, headteachers, teachers and support staff were also asked how often they experienced the same behaviours towards staff in class. This includes behaviours and abuse witnessed in class towards another staff member as well as those that were directed at the staff member themselves.
Some behaviours were very rare, as shown in Table 4.14. There is no routine experience of abuse of staff related to a disability or related to religion and relatively low proportions of all staff encounter racist abuse (1%), sexist abuse or harassment (5%) or homophobic, biphobic or transphobic abuse (1%) at least once a week[54]. Physical aggression and physical violence are more common though only frequently experienced by a minority of staff. For example, 11% of staff encountered physical violence towards themselves or other staff at least once in the last week. Staff are most likely to encounter general verbal abuse on a frequent basis – 38% did so at least once in the last week including 10% who did so once a day.
| Not at all (%) | At least once (%) | |
|---|---|---|
| Racist abuse towards you/staff | 99 | 1 |
| Sexist abuse or harassment towards you/staff | 95 | 5 |
| Abuse towards themselves/staff who have a disability | 100 | 0 |
| Abuse towards themselves/staff who have additional support needs | 100 | 0 |
| Religious abuse towards you/staff | 99 | 1 |
| Homophobic, biphobic or transphobic abuse towards staff/you | 99 | 1 |
| General verbal abuse towards staff/you (e.g., offensive, insulting or threatening remarks) | 62 | 38 |
| Physical aggression towards you/staff (e.g. by pushing, squaring up) | 84 | 16 |
| Physical violence towards you/staff (e.g. punching, kicking, head butting, use of a weapon, throwing objects) | 89 | 11 |
| Unweighted bases | 3,725 | 3,725 |
Abuse towards staff varies by staff type (Table 4.15). In this instance, headteachers are more likely than teachers and support staff to encounter these behaviours. Around one in two (49%) headteachers experienced general verbal abuse towards themselves or other staff in the last week compared with two in five teachers (38%) and support staff (39%).
| All (%) | Headteacher (%) | Teacher (%) | Support staff (%) | |
|---|---|---|---|---|
| General verbal abuse towards you/staff (e.g. offensive, insulting or threatening remarks) | 38 | 49 | 38 | 39 |
| Physical aggression towards you/staff (e.g., by pushing, squaring up) | 16 | 30 | 12 | 23 |
| Physical violence towards you/staff (e.g., punching, kicking, head butting, use of a weapon, throwing objects) | 11 | 25 | 8 | 19 |
| Unweighted bases | 3725 | 357 | 2346 | 1024 |
There are also differences by school type (Table 4.16). Similar to the patterns in abuse towards pupils in the classroom, primary school staff report higher frequencies of physical violence and aggression towards staff than secondary staff. For example, 19% of primary staff encountered physical aggression in class in the last week compared with 11% of secondary staff. On the other hand, secondary school staff report higher levels of all other types of abuse towards staff. As may be expected, secondary staff are particularly more likely than primary staff to encounter pupils under the influence of drugs (18% of secondary school staff experienced at least once in the last week compared with no primary school staff) and using digital technology abusively (27% compared with 6%).
| Primary (%) | Secondary (%) | |
|---|---|---|
| Racist abuse towards you/staff | <1 | 2 |
| Sexist abuse or harassment towards you/staff | 2 | 7 |
| Religious abuse towards you/staff | <1 | 1 |
| Homophobic, biphobic or transphobic abuse towards you/staff | <1 | 2 |
| General verbal abuse towards you/staff (e.g. offensive, insulting or threatening remarks) | 30 | 47 |
| Physical aggression towards you/staff (e.g. by pushing, squaring up) | 19 | 11 |
| Physical violence towards you/staff (e.g. punching, kicking, head butting, use of a weapon, throwing objects) | 17 | 4 |
| Pupils under the influence of drugs/alcohol | <1 | 18 |
| Using digital technology (e.g. computers, tablets, mobile phones) abusively (e.g. malicious posting of comments, photos, videos) | 6 | 27 |
| Unweighted bases | 1338 | 2389 |
In primary schools, there are also some differences in the experiences of P1-3 staff compared with P4-7 staff (Table 4.17). Staff working with P4-7 pupils are more likely than those working with P1-3 to encounter general verbal abuse (32% at least once in the last week compared with 25%) and using digital technology abusively (8% at least once in the last week compared with 3%). In contrast, P1-3 teachers experience higher levels of physical aggression and physical violence towards themselves or other staff than do P4-7 teachers. For example, 15% of P1-3 staff experienced physical violence towards themselves or other staff in the last week compared with 9% of P4-7 staff.
| P1-3 (%) | P4-7(%) | |
|---|---|---|
| Sexist abuse or harassment towards you/staff | 1 | 2 |
| General verbal abuse towards you/staff (e.g. offensive, insulting or threatening remarks | 25 | 32 |
| Physical aggression towards you/staff (e.g. by pushing, squaring up) | 17 | 11 |
| Physical violence towards you/staff (e.g. punching, kicking, head butting, use of a weapon, throwing objects) | 15 | 9 |
| Using digital technology (e.g. computers, tablets, mobile phones) abusively (e.g. malicious posting of comments, photos, videos) | 3 | 8 |
| Unweighted bases | 295 | 386 |
Use of a weapon towards staff
Of those who had experienced violent behaviour towards themselves or other staff in class in the last week (11% of all staff), 24% reported also having to deal with the use of weapon towards themselves or other staff at least once in the last week. This equates to around 3% of all staff. Support staff were more likely to encounter use of a weapon towards themselves or other staff than headteachers or teachers. Among those who had experienced violent behaviour towards themselves or other staff in class in the last week, 32% of support staff dealt with use of a weapon compared with 17% of headteachers and 19% of teachers. The breakdown by staff type is shown below in Figure 4.5. Experiences of violent behaviour involving a weapon in the classroom did not vary by school type.
The figure presents the proportion of the 11% of all staff who reported violent behaviour towards themselves/other staff in the classroom who reported use of weapon towards themselves/staff. The percentages shown are therefore not the overall proportion of all staff who reported use of a weapon.
Around the school
Physical and verbal abuse towards pupils
Alongside their experience in the classroom, headteachers and teachers[55] were also asked how often they experienced the same types of serious abuse towards pupils around the school.
The most and least common serious behaviours encountered by staff around the school are similar to those experienced in class. General verbal abuse amongst pupils is the behaviour staff are most likely to have encountered. Sixty-one percent did so at least once in the last week. Religious abuse towards other pupils is the behaviour least likely to be experienced with 4% of staff encountering this at least once in the last week.
Teachers were more likely than headteachers to frequently encounter almost all serious disruptive behaviours between pupils (Table 4.18). For example, 16% of teachers encountered homophobic, biphobic or transphobic abuse towards other pupils at least once in the last week compared with 8% of headteachers. However, headteachers were more likely than teachers to experience physical violence between pupils around school – 49% did so at least once in the last week compared with 41% of teachers.
| All (%) | Headteacher (%) | Teacher (%) | |
|---|---|---|---|
| Sexist abuse or harassment of other pupils | 12 | 8 | 12 |
| Abuse towards other pupils who have a disability | 8 | 3 | 8 |
| Abuse towards other pupils who have additional support needs | 16 | 10 | 17 |
| Religious abuse towards other pupils | 4 | 1 | 4 |
| Homophobic, biphobic or transphobic abuse towards other pupils | 16 | 8 | 16 |
| General verbal abuse towards other pupils (e.g., offensive, insulting, or threatening remarks) | 61 | 54 | 62 |
| Physical destructiveness (e.g., breaking objects, damaging furniture and fabric) | 55 | 46 | 55 |
| Physical aggression towards other pupils (e.g., by pushing, squaring up) | 57 | 56 | 57 |
| Physical violence towards other pupils (e.g., punching, kicking, head butting, use of a weapon, throwing objects) | 41 | 49 | 41 |
| Unweighted bases | 2576 | 352 | 2247 |
The full breakdown of the frequencies of staff reporting of each of these types of abuse towards other pupils around the school is shown in supplementary tables 4.85-4.93.
Differences by school type in experience of serious disruptive behaviours around school mirror, to some extent, those seen in relation to experience of the same behaviours in class (Table 4.19). Compared with secondary staff, primary school staff report higher frequencies of physical violence towards other pupils - 46% of primary staff had encountered this at least once in the last week compared with 36% of secondary staff. Staff in both types of school similarly experienced physical aggression around the school – around 56-57% doing so at least once in the last week. Otherwise, secondary staff were more likely than primary staff to encounter all other types of serious disruptive behaviour around the school. Differences are particularly notable in relation to homophobic, biphobic or transphobic abuse towards other pupils - where secondary staff were around four times more likely than primary staff to have experienced this at least once in the last week (26% compared with 7%) – and sexist abuse – where secondary staff were three times more likely than primary staff to have encountered this at least once in the last week.
| Primary (%) | Secondary (%) | |
|---|---|---|
| Racist abuse towards other pupils | 11 | 17 |
| Sexist abuse or harassment of other pupils | 6 | 18 |
| Abuse towards other pupils who have a disability | 5 | 11 |
| Abuse towards other pupils who have additional support needs | 13 | 20 |
| Religious abuse towards other pupils | 2 | 6 |
| Homophobic, biphobic or transphobic abuse towards other pupils | 7 | 26 |
| General verbal abuse towards other pupils (e.g., offensive, insulting, or threatening remarks) | 54 | 69 |
| Physical destructiveness (e.g., breaking objects, damaging furniture and fabric) | 52 | 58 |
| Physical aggression towards other pupils (e.g., by pushing, squaring up) | 57 | 56 |
| Physical violence towards other pupils (e.g., punching, kicking, head butting, use of a weapon, throwing objects) | 46 | 36 |
| Unweighted bases | 871 | 1728 |
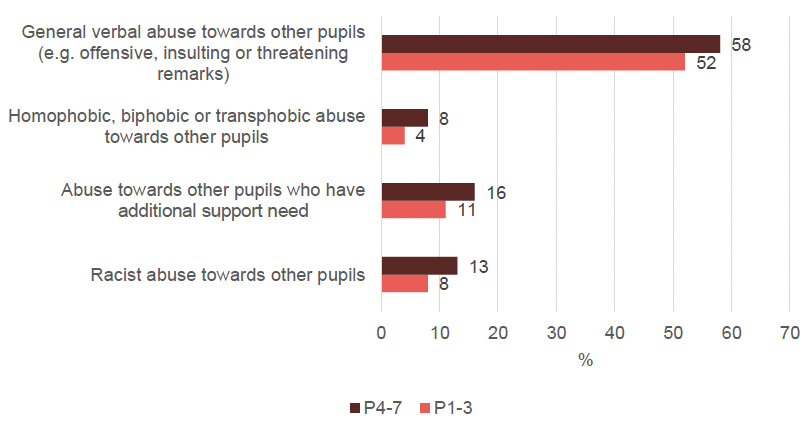
Experience of some forms of abuse between pupils around the school varies between primary staff working with P1-3 and P4-7 pupils (Figure 4.6). Compared with P1-3 staff, those working with P4-7 reported higher levels of racist abuse towards other pupils (13% experiencing at least once in the last week compared with 8%) and general verbal abuse (58% experiencing at least once in the last week compared with 52%). It is notable that despite experiencing less frequently than secondary and P4-7 staff, a little more than half of P1-3 teachers (52%) encounter general verbal abuse between pupils at least once a week.
Use of a weapon towards pupils
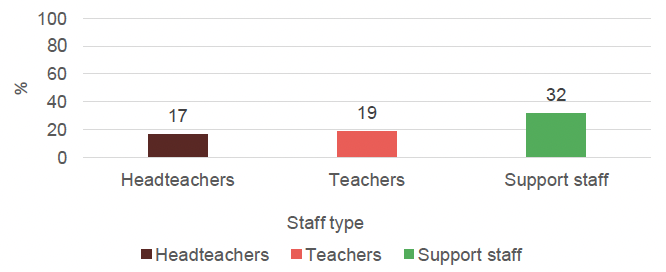
Amongst headteachers and teachers who reported experience of physical violence between pupils around the school in the last week (41%), 11% also reported having to deal specifically with use of a weapon. This equates to around 5% of all headteachers and teachers. This experience did not vary by staff or school type. Supplementary table 4.106 shows the full breakdown of these figures.
Physical and verbal abuse towards staff
Headteachers and teachers were asked how often they experience the same types of abuse towards themselves or other staff around the school. This includes behaviours and abuse witnessed around the school towards another staff member as well as those that were directed at the staff member themselves.
As seen with abuse towards staff in the classroom, many types of this sort of behaviour were rare – more so than in the classroom - including racist abuse, sexist abuse, religious abuse, homophobic, biphobic or transphobic abuse and abuse as a result of a disability. General verbal abuse was relatively common with around one in three staff experiencing this at least once in the last week. Physical aggression and violence and encountering pupils under the influence of alcohol or drugs were less common – between 7% and 11% of staff had experienced these at least once in the last week.
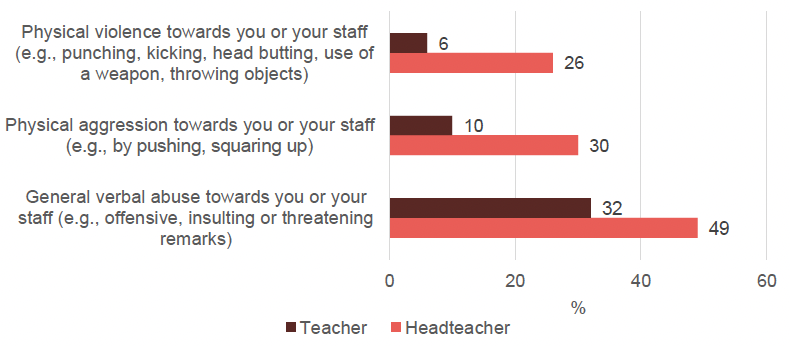
Amongst those behaviours which were more common, headteachers experienced them more frequently than teachers (Figure 4.7). For example, headteachers were over four times more likely than teachers to encounter physical violence towards themselves or other staff at least once in the last week (26% compared with 6%) and three times more likely to encounter physical aggression (30% experiencing at least once in the last week compared with 10%).
Similar to serious disruptive behaviours towards staff in class, primary staff were more likely than secondary staff to encounter physical aggression and physical violence towards them or other staff around school. The difference was particularly notable for physical violence where primary staff were more than five times more likely than secondary staff to have experienced physical violence towards them or other staff at least once in the last week (11% compared with 2%). In contrast, and again following trends seen earlier, secondary staff were more likely than primary staff to have encountered sexist abuse, general verbal abuse, pupils under the influence of alcohol and drugs and pupils using digital technology abusively towards staff.
| Primary (%) | Secondary (%) | |
|---|---|---|
| Racist abuse towards you or your staff | 0 | 2 |
| Sexist abuse or harassment towards you or your staff | 1 | 5 |
| Homophobic, biphobic or transphobic abuse towards you or your staff | 0 | 1 |
| General verbal abuse towards you or your staff (e.g., offensive, insulting or threatening remarks) | 23 | 42 |
| Physical aggression towards you or your staff (e.g., by pushing, squaring up) | 13 | 9 |
| Physical violence towards you or your staff (e.g., punching, kicking, head butting, use of a weapon, throwing objects) | 11 | 2 |
| Pupils under the influence of drugs/alcohol | 0 | 16 |
| Using digital technology (e.g., computers, tablets, mobile phones) abusively (e.g., malicious posting of comments, photos, videos) | 5 | 27 |
| Unweighted bases | 869 | 1749 |
P4-7 teachers report higher levels of general verbal abuse (25%) compared with 19% of P1-3 teachers. P4-7 teachers also report higher levels of using digital technology (e.g., computers, tablets, mobile phones) abusively (e.g., malicious posting of comments, photos, videos) (7%) compared with 3% of P1-3 teachers.
Use of a weapon
Amongst staff who experienced any physical violence towards themselves or other staff around the school in the last week (7%), 23% reported having to deal with the use of a weapon. This equates to around 2% of all headteachers and teachers. This did not vary by staff or school type. Supplementary table 4.105 shows the full breakdown of these figures.
Personal experiences of abuse towards staff
In addition to the questions presented above on how frequently staff experience each form of abuse towards themselves or other staff in the classroom and around the school, staff were also asked in the last 12 months how many times they have personally experienced each of the following types of serious disruptive behaviour/violence towards them in their role as a head teacher, teacher or as a member of support staff. Table 4.21 shows the different types of serious disruptive behaviour/violence staff were asked about and the proportion of staff in primary and secondary schools that reported having experienced each of these at least once during the last 12 months. Reported experiences of most forms of serious disruptive behaviour/violence at least once in the last 12 months are more common among secondary staff compared with primary staff, for example sexist abuse or harassment towards them (10% in secondaries and 2% in primaries) and general verbal abuse towards them (49% in secondaries and 36% in primaries). Reported experience of physical aggression or violence towards staff personally was more common in primary schools compared with secondary schools, for example 30% of primary staff compared with 11% of secondary staff have experienced physical violence towards them (e.g. punching, kicking, head butting, use of a weapon, throwing objects).
| All (%) | Primary (%) | Secondary (%) | |
|---|---|---|---|
| Racist abuse towards you | 2 | 1 | 3 |
| Sexist abuse or harassment towards you | 6 | 2 | 10 |
| Abuse towards you due to a disability* | 0 | 0 | 1 |
| Abuse towards you due to an additional support need* | 1 | 1 | 0 |
| Religious abuse towards you | 1 | 1 | 2 |
| Homophobic, biphobic or transphobic abuse towards you | 2 | 1 | 3 |
| General verbal abuse towards you (e.g., offensive, insulting or threatening remarks) | 42 | 36 | 49 |
| Physical aggression towards you (e.g., by pushing, squaring up) | 27 | 31 | 22 |
| Physical violence towards you (e.g., punching, kicking, head butting, use of a weapon, throwing objects) | 21 | 30 | 11 |
| Unweighted bases | 3,582 | 1,292 | 2,291 |
*Differences in experiences of these between staff in primary and secondary schools do not reach statistical significance
Personal experiences of some of the above forms of serious disruptive behaviour and violence varied according to staff type, as shown in Table 4.22. Table 4.23 shows the frequency that staff reported having experienced each of these in the last 12 months. Teachers are more likely to report at least one personal experience of racist and sexist abuse or harassment in the last 12 months compared with support staff and headteachers. This is particularly the case among secondary teachers (11% having experienced sexist abuse or harassment compared with 6-8% among other staff) as shown in supplementary table 4.108).
A higher proportion of headteachers reported having experienced at least one instance of physical violence and aggression towards them and verbal abuse towards them personally at least once in the last 12 months compared with teachers and support staff. Whereas, as shown in Table 4.23, a higher proportion of support staff report experiencing the greatest number (21 or more) instances of physical aggression and violence in the last 12 months. This was particularly apparent in primary schools (as shown in supplementary table 4.114) where physical aggression and violence towards staff and pupils is more common.
| Headteachers (%) | Teachers (%) | Support staff (%) | |
|---|---|---|---|
| Racist abuse towards you | - | 2 | 1 |
| Sexist abuse or harassment towards you | 3 | 6 | 4 |
| Physical aggression towards you (e.g., by pushing, squaring up) | 35 | 26 | 29 |
| Physical violence towards you (e.g., punching, kicking, head butting, use of a weapon, throwing objects) | 31 | 19 | 27 |
| Unweighted bases | 347 | 2,258 | 978 |
| None (%) | 1 (%) | 2 to 5 (%) | 6 to 10 (%) | 11-20 (%) | 21+ (%) | ||
|---|---|---|---|---|---|---|---|
| Racist abuse towards you | Headteachers | 100 | - | - | - | - | - |
| Teachers | 98 | 1 | 1 | 0 | 0 | - | |
| Support staff | 99 | 1 | 1 | - | 0 | 0 | |
| Sexist abuse or harassment towards you | Headteachers | 97 | 2 | 1 | - | 0 | - |
| Teachers | 94 | 2 | 3 | 0 | 0 | 0 | |
| Support staff | 96 | 1 | 2 | 1 | 0 | 0 | |
| Physical aggression towards you (e.g., by pushing, squaring up) | Headteachers | 65 | 8 | 13 | 7 | 3 | 4 |
| Teachers | 74 | 9 | 10 | 3 | 2 | 2 | |
| Support staff | 71 | 6 | 9 | 5 | 2 | 6 | |
| Physical violence towards you (e.g., punching, kicking, head butting, use of a weapon, throwing objects) | Headteachers | 69 | 3 | 17 | 7 | 2 | 2 |
| Teachers | 81 | 6 | 7 | 3 | 1 | 1 | |
| Support staff | 73 | 5 | 10 | 3 | 2 | 6 | |
Unweighted bases: racist abuse, sexist abuse, physical aggression (headteachers - 347, teachers – 2,258, support staff - 978), physical violence (headteachers - 347, teachers – 2,257, support staff - 978)
As shown in Table 4.24 between 0 and 2% of all staff reported having personally experienced each of these types of abuse towards them due to protected characteristics in the last 12 months[56]. A higher proportion of all staff experienced general verbal abuse towards them in the last 12 months, with 9% having experienced this 21 times or more, 5-7% 6-20 times, 16% 2-5 times and 5% once during this time. There were no variations in experiences of each of these behaviours among different staff types.
| None (%) | 1 (%) | 2 to 5 (%) | 6 to 10 (%) | 11-20 (%) | 21+ (%) | |
|---|---|---|---|---|---|---|
| Abuse towards you due to a disability | 100 | 0 | 0 | 0 | 0 | 0 |
| Abuse towards you due to an additional support need | 99 | 0 | 0 | 0 | 0 | 0 |
| Religious abuse towards you | 99 | 1 | 0 | 0 | - | 0 |
| Homophobic, biphobic or transphobic abuse towards you | 98 | 1 | 1 | 0 | 0 | 0 |
| General verbal abuse towards you (i.e. threatening remarks) | 58 | 5 | 16 | 7 | 5 | 9 |
Unweighted bases: 3,583. Except for homophobic, biphobic or transphobic abuse: 3,582.
Experience of abuse, aggression and violence towards staff was also considered according to the gender of the staff member. Only a small number of gender differences emerged, as shown in Table 4.25. Notably, female staff were more likely than male staff to have encountered at least one incident of physical violence towards themselves in the last 12 months. In contrast, male staff were more likely than female staff to have experienced homophobic, biphobic or transphobic abuse or verbal abuse.
| Male (%) | Female (%) | |
|---|---|---|
| Racist abuse | 3 | 2 |
| Religious abuse | 2 | 1 |
| Homophobic, biphobic or transphobic abuse | 5 | 1 |
| General verbal abuse (e.g., offensive, insulting or threatening remarks) | 51 | 40 |
| Physical violence towards you or your staff (e.g., punching, kicking, head butting, use of a weapon, throwing objects) | 14 | 23 |
The full breakdown of the number of instances of each of the above types of serious disruptive behaviour/violence experienced personally by staff in the last 12 months is shown in supplementary tables 4.107-4.115.