Attainment Scotland Fund evaluation: headteacher survey - topline briefing report 2020
This report presents and overview of headline findings from the 2020 survey of headteachers of schools in receipt of support from the Attainment Scotland Fund (ASF). This is the fifth survey of headteachers, previous surveys having been conducted in 2016, 2017, 2018 and 2019.
1. Introduction
1.1 This report provides an overview of headline findings from the 2020 survey of headteachers of schools in receipt of support from the Attainment Scotland Fund (ASF). The survey was commissioned by Scottish Government's Learning Analysis Unit to inform the wider evaluation of ASF.
Background
1.2 Launched in 2015, the Scottish Attainment Challenge (SAC) is supported by the £750 million Attainment Scotland Fund with the strategic aim of closing the poverty-related attainment gap between children and young people from the least and most disadvantaged communities.
1.3 The Scottish Attainment Challenge has developed and expanded since 2015, and currently incorporates the following main strands:
- Pupil Equity Funding (PEF) provides funds directly to schools for headteachers to use at their discretion on initiatives that they consider will help close the poverty-related attainment gap. Over 97% of schools in Scotland have been allocated funding, based on the estimated numbers of pupils in Primary 1 to S3 registered for free school meals.
- The Challenge Authority (CA) and Schools Programmes (SP) provide additional resource to nine local authorities, and 73 schools outwith those local authorities with the highest levels of deprivation. Each Challenge Authority/Schools Programme school receives funding and support to deliver improvement plans focused on literacy, numeracy and health and wellbeing to tackle the poverty-related attainment gap.
1.4 As the Scottish Attainment Challenge has evolved, the focus of the evidence being collected through the Headteacher Survey has moved from primarily being about processes towards a greater focus on progress and impact of approaches being delivered. This evidence is helping to inform the progress being made towards delivering the long-term outcomes of the programme.
Study objectives and methodology
1.5 This is the fifth survey of headteachers of schools in receipt of ASF support. Surveys in 2016 and 2017 included headteachers across the Challenge Authorities and Schools Programmes, with a sample of PEF-only schools included for the first time in the 2018 survey. The survey sample was expanded for the 2019 survey to include all schools in receipt of CA, SP and/or PEF support.
1.6 The present survey coincided with the COVID-19 pandemic, with fieldwork conducted in January and February 2021 during a period of school building closures. The survey sample was therefore reduced to limit the burden on schools affected by the pandemic and school building closures. All CA and SP schools, and 50% of schools in receipt of PEF only were invited to participate. The survey methodology otherwise remained consistent with that used in previous surveys.
1.7 The survey sought headteacher views and experiences relating to the 2019/20 academic year. Survey content was adapted from that used in the 2019 survey. Key indicators were maintained where survey findings are used to track trends over time, alongside the introduction of new questions looking specifically at schools' experience of ASF during the first period of school building closures from March to June 2020. Survey design kept a tight focus on key questions which can inform the ongoing ASF evaluation, to limit survey completion time and the associated burden on schools.
Survey response
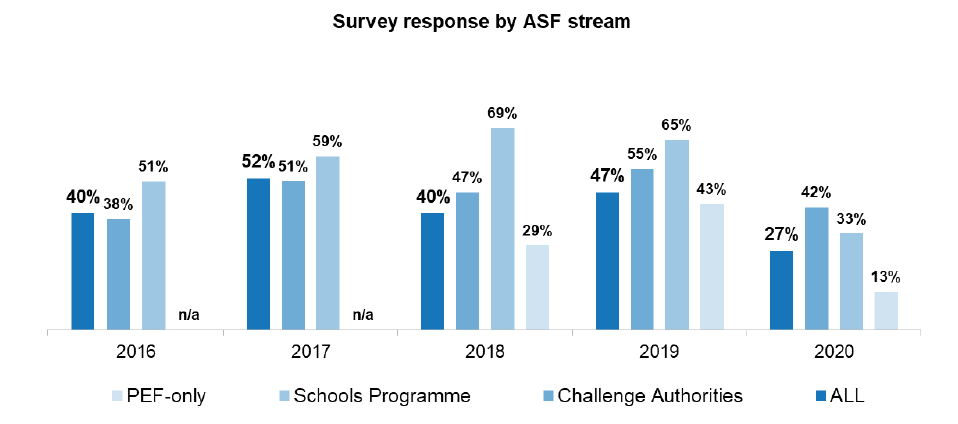
1.8 A total of 420 responses were received by survey close, equivalent to an overall response rate of 27%. This represents a 20-point decrease in survey response since 2019, primarily due to a 30-point decrease in response from PEF-only schools (13% compared to 43% in 2019). As noted above, survey fieldwork took place in early 2021 during a period of school building closures, and associated increase in pressure on school resources. In this context, we very much appreciate those schools able to participate. Moreover, the volume of response is sufficient to produce robust results to inform the wider ASF evaluation.
Survey response 2016 to 2019
1.9 The table below summarises the profile of survey respondents, and compares this with all schools in receipt of ASF support. In terms of the profile of respondents, the largest groups are Challenge Authority schools, primary schools, schools in urban areas, and schools with a middle or upper PEF allocation. This differs from the profile of all ASF-supported schools on a number of indicators, in part due to the change in sampling approach for the present survey:
- Challenge Authority schools are over-represented and PEF-only schools under-represented. This is due to the 50% sample taken of PEF-only schools (compared to the 100% sample of CA schools), compounded by a lower response rate from PEF-only schools. Survey weighting has been used to correct for this response bias.
- Schools with lower PEF allocations are under-represented, and those with higher allocations are over-represented. This is also in part due to the under-representation of PEF-only schools (which typically have lower PEF allocations) and over-representation of CA schools (which typically have higher allocations).
- Schools in rural areas are under-represented, and schools in urban areas over-represented. Again, survey weighting has been used to correct for this.
|
|
Respondents (n=420) | All schools in receipt of ASF | Differential |
|---|---|---|---|
| Attainment Scotland Fund | |||
| Challenge Authorities | 58% | 27% | 31% |
| Schools' Programme | 11% | 3% | 8% |
| PEF-only | 31% | 67% | -36% |
| PEF allocation[1] | |||
| Lower | 10% | 22% | -12% |
| Middle | 43% | 42% | 0% |
| Higher | 40% | 21% | 19% |
| Unknown | 7% | 14% | - |
| School sector | |||
| Primary schools | 80% | 80% | -1% |
| Secondary schools | 15% | 15% | 1% |
| Special schools | 5% | 5% | 0% |
| Unknown | 0% | 0% | - |
| Urban/rural location | |||
| Urban | 64% | 49% | 15% |
| Small town | 10% | 10% | -1% |
| Rural | 15% | 33% | -18% |
| Unknown | 11% | 7% | - |
Contact
Email: Joanna.shedden@gov.scot