
Air pollutant exposure evidence review
A review of existing data on pollutant concentrations and demographic features, used to understand the strength of the evidence base on how the Scottish population is being exposed to outdoor concentrations of NO2, PM10, and PM2.5.
3 Response to Research Questions
This section discusses the research questions set out in Section 2, using the outcomes of the evidence review undertaken as set out in the methodology section in Section 2. Detail of the specific evidence (reports, scientific literature, websites etc) which has been reviewed is included in Appendix A2.
R1 What contemporary evidence exists which could inform the assessment of current exposure of the general population in Scotland to ambient concentrations of PM10, PM2.5 and NO2, in the context of the EU Limit Values and the Air Quality Targets and Objectives for Scotland?
This section catalogues the monitoring, modelling, emissions, population and other datasets covering Scotland which could provide evidence to inform an assessment of population exposure to ambient concentrations of PM10, PM2.5 and NO2. The utility of this evidence base is evaluated in subsequent sections.
Monitoring
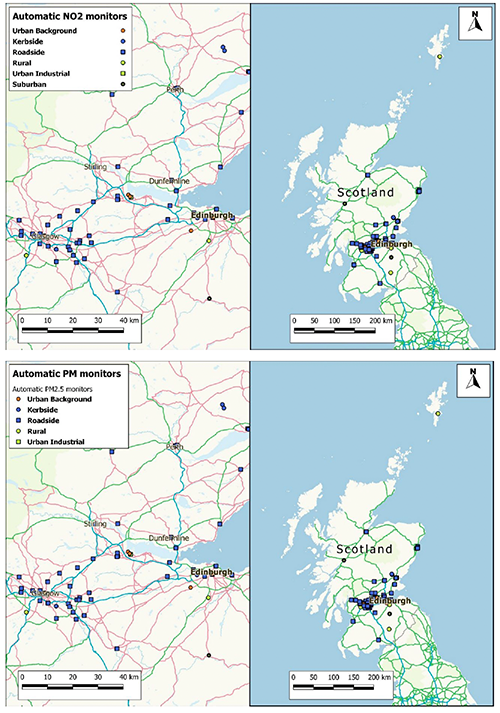
Reference MonitorsThe Scottish Air Quality Network comprises 99 reference-equivalent, real-time, monitoring sites, reporting data for one or more of the three pollutants of interest. The network includes urban background, suburban, urban traffic (roadside and kerbside), urban industrial and rural sites. Data are reported annually, both by local authorities as part of the LAQM [6] process and in the Scottish Air Quality Database (SAQD) annual report [7]. For NO2, there are 10 urban background and suburban sites and over 52 urban traffic sites with more than 10 years of continuous data, as well as three long-running rural sites. For PM10, seven urban background and urban industrial sites and 51 traffic sites have more than 10 years of data. PM2.5 monitoring is comparatively recent: while 84 sites now measure PM2.5, the vast majority started within the last eight years and only nine had 10 consecutive years of data by end-2024. The structure of the network (Figure 3‑1) has evolved organically over time to meet a changing range of policy needs; while different types of exposure environment are covered, the distribution of monitors is not designed to map against population data.
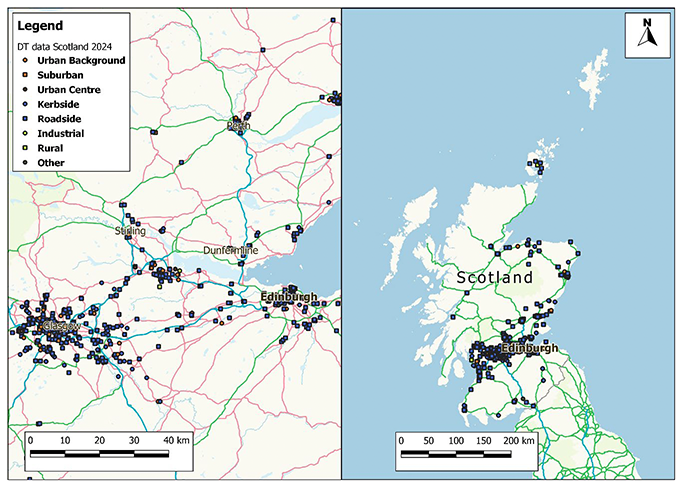
Passive diffusion tubesNO2 is also monitored using passive diffusion tubes, which are indicative (rather than reference-equivalent) monitors with a wider uncertainty allowance[8]. The distribution of this network has evolved principally in response to LAQM reporting requirements and identifying hot-spot locations. The network is therefore biased toward roadside settings. In 2024 there were over 1,000 diffusion tube sites across Scotland, the majority at roadside locations. Of these, 85 were classified as urban background and 3 as suburban. The distribution of diffusion tubes is shown in Figure 3‑2.
Low-cost sensorsOwing to the cost and size when compared with reference monitors, ‘low-cost’ sensors potentially allow a much larger number of measurements across a wider geographical area; some are also portable enough to estimate personal exposure directly. A growing number of sensors are MCERTS[9] certified as indicative samplers, making them equivalent to diffusion tubes but at a higher cost, higher time-resolution and able to measure additional pollutants. They may be used for local, high-density or indicative monitoring as a complement to reference stations and diffusion tubes. Accuracy and data quality remain issues, and sensor data cannot be used to report directly against compliance with legal air quality objectives. Currently, their principal value, beyond citizen science and awareness raising, is for assessing spatial and temporal trends that cannot be adequately captured by reference methods. AQEG [10] provides a comprehensive assessment of current and emerging particulate measurement technologies, including low-cost sensors. It is recognised that the use of sensors is a rapidly evolving field alongside Artificial Intelligence (AI) methods for calibrating networks to enhance accuracy.
Summary of recent measured concentrations and trendsIn 2024, no automatic monitoring site exceeded the annual mean or hourly air quality objective for NO2. No sites measuring PM10 or PM2.5 exceeded the Scottish annual mean objectives. The daily mean PM10 objective was exceeded at one site. One passive diffusion tube site exceeded the NO2 annual mean objective.
Trend analysis7 shows the following patterns:
- NO2: all three site types (urban background, rural and urban traffic) show decreasing trends over 10 years. However, over the most recent five years, concentrations have generally plateaued, with some sites now showing increases for the time period of 2020 - 2024.
- PM10: urban background sites show decreasing 10-year trends, but over the most recent five-years, concentrations have been increasing. Urban traffic sites show decreasing 10-year trends with general plateauing over the past five years.
- PM2.5: the nine sites with 10 years of data show slight decreasing trends over the full period. However, reflecting the position for PM10, at urban traffic sites with at least five years of data, a majority show slight increasing trends for the time period of 2020 - 2024.
- Therefore, for all three pollutants, while concentrations remain generally lower than they have been in the past, the significant gains seen historically appear to have either been exhausted or are being reversed.
Concentration Modelling
National background and roadside mappingMapped concentrations of modelled background pollutant concentrations on a 1 km x 1 km basis have been produced for the whole of Scotland for NO2, NOx, PM10 and PM2.5. Modelled roadside air pollutant concentrations are also provided separately for urban major road links. The current maps are derived from a combination of monitoring data, spatially disaggregated emissions information from the National Atmospheric Emissions Inventory (NAEI) [11] and simplified dispersion modelling kernels using a methodology based on the UK Pollution Climate Mapping (PCM)[12] approach. There were no modelled exceedances of any of the air quality objectives at either background or roadside locations in 2023.
Forward projections of air pollutant concentrations are not currently produced annually. The most recently available projections are from a base year of 2021, covering background concentrations of PM10, PM2.5, NOx and NO2 for the years 2021 to 2040.
Local authority LAQM modellingSeparate, more detailed modelling is carried out by local authorities for LAQM purposes, typically at higher resolution than the national methodology. This is generally undertaken when Air Quality Management Areas (AQMAs)6 are declared, when revocation is being considered, or to quantify the effects of actions within an Air Quality Action Plan. The majority of AQMAs in Scotland have been declared for NO2, and the number has reduced over time in response to the historic downward trend in roadside concentrations.
National Modelling Framework and LEZ modellingCAFS2 set out the commitment for a National Modelling Framework (NMF). Local NMF models developed by SEPA have been used to identify detailed traffic-related source apportionment across four cities in Scotland (Glasgow, Edinburgh, Aberdeen and Dundee), with outputs providing quantitative evidence to support decision-making on the potential benefits of introducing Low Emission Zones. The modelling included visualisation tools showing progression of improvements both in the bus fleet and for concentrations.
Atmospheric chemistry-transport modellingAlternative 1 km × 1 km gridded modelling for Scotland has been carried out using the EMEP4UK[13] atmospheric chemistry-transport model [14] . The inclusion of atmospheric chemistry allows EMEP4UK to assess changes in secondary pollutants (including secondary PM2.5 formed from precursor emissions of NOx, NH3 and volatile organic compounds), which is not possible with the simpler dispersion kernels used in the PCM approach. Outputs from this model could be used to assess exposure in current conditions or to evaluate the effects of proposed policies affecting precursor emissions. EMEP4UK and related chemistry-transport models (including CMAQ-ISAM)[15] have been used to produce source-apportioned concentration fields for Scotland, quantifying contributions from road transport, residential combustion, shipping and transboundary sources to ambient NO2 and PM2.5 [16]. These source apportionment outputs constitute a distinct evidence product for exposure assessment, separate from the total concentration fields. They are particularly relevant for Scotland because ambient PM2.5 concentrations in Scottish cities are substantially lower than in comparable English cities, not because local emissions are lower but because Scotland's greater distance from continental European source regions and prevailing meteorology result in a much lower regional background onto which local emissions are added. A consequence is that transboundary and regional transport, rather than local source variation, is the dominant driver of the difference in PM2.5 exposure between Scottish and English populations, making evidence on the magnitude of this contribution essential to understanding Scotland's pollution climate.
High-resolution combined modellingUnder the MAQS-Health project, EMEP4UK model outputs have been linked with detailed local-scale dispersion modelling for all major roads in Scotland[17]. The combined system generated concentration maps at 10–20 m resolution, with consistent representation of, and smooth transitions between, near-road and background locations. This allows spatial variation in exposure to be characterised at a resolution considerably finer than the 1 km2 national background maps.
EMEP4UK has also been used at 1.5 km resolution with hourly temporal resolution, combined with anonymised individual workplace data, to assess population exposure across the Central Belt by age, sex, ethnicity and deprivation [18]. This is one of the few studies to incorporate workplace mobility beyond place-of-residence assignment and found that accounting for workplace location significantly attenuates the socioeconomic differentials in PM2.5 exposure estimated from residential location alone.
Beyond process-based models, the wider methodological literature encompasses land use regression and hybrid statistical–machine learning approaches that combine satellite data, land use variables and monitoring data to estimate fine-scale concentration surfaces. These are established techniques for capturing within-urban variation at resolutions finer than 1 km mapping and represent a potentially available complementary approach17.
Satellite-derived concentration estimatesGridded estimates of ground-level PM2.5 concentrations can be derived from satellite retrievals of aerosol optical depth, combined with chemical transport model outputs and calibrated against surface monitoring data[19]. Products are available at approximately 1 km resolution with global coverage, including Scotland. These provide complementary spatial information on PM2.5 distribution that is not dependent on the density of the ground-level monitoring network. However, they are not independent of either models or surface measurements: the retrieval algorithms incorporate chemical transport modelling and the products are calibrated against ground-level monitors. The capabilities and limitations of satellite-derived PM estimates are discussed in detail by AQEG10.
Emissions Inventories and Source Information
National emissions inventoriesWhile the NAEI feeds into the concentration modelling described above, it represents an important data source in its own right. The Scottish NAEI details Scotland’s air pollutant emissions, compiled using methods consistent with international standards and reported via the NAEI website11 and the Scottish Air Quality website5. The NAEI provides data for pollutants including NOx, PM10 and PM2.5 from sources including energy, transport, industry and domestic combustion. Within Scotland, SEPA collates detailed information on emissions from industrial sources into the Scottish Pollution Release Inventory (SPRI)[20], which forms the basis of the industrial emission data incorporated into the NAEI. While NOx emissions from near-ground source sectors provide a reasonable proxy for ambient NO2 concentrations, the correspondence between primary PM2.5 emissions and ambient PM2.5 concentrations is much weaker, because a substantial fraction of ambient PM2.5 is secondary in origin or transported from distant sources. Primary PM2.5 emissions data therefore has significantly less direct utility for estimating population exposure than NOx emissions data.
Activity dataActivity data to support emissions estimation is available with varying levels of completeness across source sectors. Road traffic activity on main roads is well characterised through count data, but as emissions from this source diminish, other source sectors become more prominent in the overall inventory. For some of these, including construction activity, Non-Road Mobile Machinery operation, domestic heating and cooking, and emergency power generation in high-rise buildings, systematic records of where and when activities occur are limited or absent.
Domestic burning of solid fuel is a significant contributor to PM2.5 emissions in residential areas. Relevant evidence includes the Scottish House Condition Survey (which provides data on solid fuel use prevalence), smoke control area mapping, and ongoing research into the contribution of domestic burning to ambient PM concentrations15. These datasets are particularly relevant to understanding PM2.5 exposure in areas where solid fuel use is common.
Population and Demographic Data
Census dataPopulation data is available through the Scottish Census[21], a decadal survey carried out by the Scottish Government. The census publishes data at the level of data zones; geographic areas designed to have a population of ~760. To accommodate a consistent population within each zone, the area of the data zones varies, with more densely populated areas having smaller data zones. Most data zones are less than 1 km2 in area, with the most common size being ~0.2 km2 but they can be larger than 50km2 in sparsely populated areas. The 2022 Scottish Census collected data on ethnicity, age, sex and other demographic characteristics at data zone level.
Population DensityThe Scottish Census data can also be used to understand population density at different spatial scales. For example, existing data for population densities at local authority level is available here. Population density could also be calculated at data zone level using a GIS package and available information from the national records of Scotland. In addition, data available from UKCEH provides UK gridded population at 1 km resolution based on the 2021/22 census[22].
Scottish Index of Multiple DeprivationThe Scottish Index of Deprivation (SIMD) 2020 v2[23] is a commonly used source of deprivation data, which ranks data zones across seven domains: income (28%), employment (28%), health (14%), education, skills and training (14%), geographic access to services (9%), crime (5%) and housing (2%). The domain scores are standardised, transformed into an exponential distribution, and combined using these weightings to produce an overall SIMD score and rank. The SIMD is based on the 2011 data zones; the next release, using the 2022 data zones, is expected in late 2026.
Urban Rural ClassificationThe 6-fold version of the Urban Rural classification produced by the Scottish Government[24] classifies data zones based on their population and proximity to other populated areas. Areas are classed as remote, accessible or urban based on their proximity to population centres. The population thresholds for a settlement are over 125 000 for large urban areas, over 10 000 for other urban areas, above 3000 for small towns and below 3000 for rural areas. The accessibility of small towns and rural areas is based on whether they are less than a 30 minute drive from the nearest urban area. This classification is based on the 2011 data zones, providing a useful framework for stratifying exposure estimates by degree of urbanisation.
Other Relevant Evidence
The EU Average Exposure Indicator frameworkThe EU Ambient Air Quality Directive (2024) defines an Average Exposure Indicator (AEI) for PM2.5 calculated as a three-year running mean of concentrations measured at designated urban background monitoring sites. The revised Directive [25] introduces an Average Exposure Reduction Obligation alongside tighter limit values. Within Scotland’s monitoring network, sites classified as urban background would in principle contribute to an AEI calculation.
Personal exposure and microenvironment studiesA small number of Scottish-specific studies have examined personal exposure or exposure in specific microenvironments, including work related to LEZ implementation and school-gate monitoring. The MAQS-Health modelling system was specifically designed to support personal exposure estimation for health research. More broadly, AQEG10 has reviewed the state of the art for personal exposure estimation using portable sensors and modelling approaches. This remains a relatively sparse area of the Scottish evidence base compared with ambient monitoring and modelling. Personal exposure is not explicitly within the remit of this project. However, it is relevant to note that people typically spend 80–90% of their time indoors, meaning that ambient concentration data serves as a proxy for actual exposure rather than a direct measure of it. No systematic indoor air quality measurement data exists for Scotland, and the relationship between outdoor concentrations and indoor exposure varies with building type, ventilation and occupant behaviour. This limitation should be borne in mind when interpreting residential location-based exposure estimates.
R2: To what extent could this evidence base be used to assess population exposure to PM10, PM2.5 and NO2 in Scotland now and in the future?
Monitoring
The current evidence base outlined under Research Question 1, consisting of monitoring networks and modelling being undertaken at different spatial scales, as well as population and demographic data, could all potentially be used as a basis for estimating population exposure, by combining pollutant concentration data with population location.
Air quality monitoring data is currently largely based around compliance with air quality objectives and Limit Values[26]. Although the current network does represent exposure in terms of where the air quality objectives and Limit Values apply, it does not necessarily represent exposure at population level.
Any monitoring network used to assess population exposure in terms of urban and rural areas should reflect these population splits. Table 3‑1 shows the numbers of air quality monitoring sites included within the Scottish Air Quality Database of different site types, representing different classifications of urban and rural in line with the classification of monitoring sites. Table 3‑2 shows the number of monitoring sites within each of the urban/ rural classifications, with proportions in comparison with population proportions. The comparison shows that larger urban areas are overrepresented in pollutant monitoring, likely due to higher concentrations of pollutants being expected in these areas, whereas small towns are underrepresented compared to population proportion. Likewise, most monitors are placed close to roads, which does not reflect the most common locations for the population.
| Site type | NO2 Automatic Sites | NO2 Passive Diffusion Tubes | PM10 | PM2.5 |
|---|---|---|---|---|
| Kerbside | 6 | 164 | 6 | 6 |
| Roadside | 58 | 785 | 53 | 53 |
| Suburban | 2 | 3 | - | - |
| Urban Background | 6 | 85 | 7 | 7 |
| Urban Centre | n/a | 17 | n/a | n/a |
| Rural | 4 | 3 | 2 | 2 |
| Industrial | 1 | 4 | 3 | 3 |
| Other | n/a | 17 | n/a | n/a |
| Sites suitable for use for Exposure Reduction Target | 8 | 88 | n/a | 7 |
1 This table shows the number of current monitors (at time of writing) in the Scottish Air Quality Network
The standard classifications for site types are Roadside (1-5 m from a busy road) and Urban background (>50 m from major roads in an urban setting). Kerbside sites are typically closer to the road (<1 m) than roadside sites, but can be grouped together for the purpose of compliance with targets. Suburban, rural, industrial and other are descriptive for the specific conditions they capture.
| Rural urban classification | NO2 Automatic Sites | NO2 Passive Diffusion Tubes | PM10 | PM2.5 | Population |
|---|---|---|---|---|---|
| 1. Large Urban Areas | 42.9% | 50.8% | 47.1% | 47.1% | 11.6% |
| 2. Other Urban Areas | 44.2% | 37.9% | 41.4% | 41.4% | 8.6% |
| 3. Accessible Small Towns | 3.9% | 3.2% | 2.9% | 2.9% | 37.5% |
| 4. Remote Small Towns | 1.3% | 2.3% | 1.4% | 1.4% | 34.1% |
| 5. Accessible Rural | 5.2% | 5.1% | 7.1% | 7.1% | 5.5% |
| 6. Remote Rural | 2.6% | 0.7% | 0.0% | 0.0% | 2.7% |
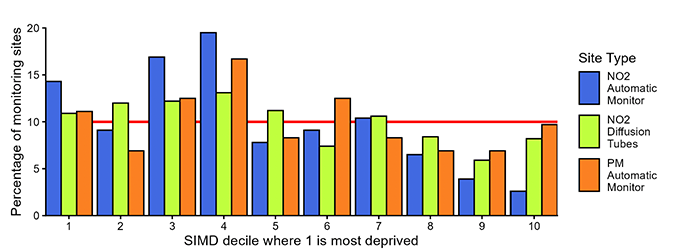
Table 3‑1 shows that the majority of the monitoring sites are classified as kerbside or roadside. This distribution reflects current LAQM guidance and the resulting prioritisation of monitoring to reflect locations of highest exposure, which is unlikely to represent the majority of the population. Data representing the proportion of the population living close to roads is not readily available. However, an analysis using census data and major roads (A roads, B roads and Motorways) undertaken by AQC has shown that approximately 3% of the population of Scotland live within 15 m of a major road (acknowledging that not all roads have been included in the calculation). Therefore, the current locations of Scottish AQ network monitoring sites taken as whole are not likely to represent the exposure of the Scottish population. However, using a combination of Roadside, Urban Background and Rural sites, approximately representing the split of population between the different locations, monitoring could be used as a way of tracking of exposure in future years. This is based on the presumption that the sites used are funded into the future, as tracking using a combination of sites requires consistency of locations and monitor types. It should, however, be noted that an approach used by Defra[27] to incorporate changes to air quality networks over time can resolve the issue of additional sites changing the average trend. By accurately representing trends using time series of different lengths, the method has the ability to describe changes in air quality for locations and time periods with otherwise insufficient data[28].
Figure 3‑3 shows the percentage of monitoring sites for different pollutants across the deprivation deciles. The red line represents the monitoring sites being distributed evenly across the deciles. It shows marginally more monitoring being undertaken in more deprived areas, especially with regards to NO2 automatic analysers. This would be expected with the majority of monitoring sites located within close proximity to roads, locations which are also more likely to be more deprived[29].
A further complication in reflecting exposure is that the above calculation is based on place of residence and completely associates the individual with where they live. This disregards time spent travelling and time at place of work or education, which are likely to take up significant portions of an individual’s daily life and be at locations with a different level of pollution to their residence.
Furthermore, much of an individual’s exposure to air pollutants happens indoors which exhibit different pollutant concentrations to that monitored or modelled outdoors. Indoor air quality is a complex phenomenon which has been studied far less than air quality outdoors. In the absence of indoor sources of pollution, indoor air quality is determined by ingress of outdoor air, balanced with pollutant loss processes such as ventilation, but where there are indoor sources, these may become more important to overall exposure than outdoor air quality. Although these are limitations to using monitoring, epidemiological studies tend to use assumptions.
Modelling
In terms of modelling, studies undertaken for the LAQM process, and that undertaken by SEPA for National Modelling Framework including LEZs, do not cover the whole of Scotland and therefore are not suitable for assessing population exposure across the whole Country. However, the modelling covering concentrations across Scotland on a 1 km x 1 km basis (for example using the EMEP4UK model) could be used. Specifically modelling can be used as a predictive tool for assessing future exposure assuming current policy actions, and for testing scenarios of different potential policy actions. It also provides a complementary source of information, for example for looking at specific issues such as changes in inequalities either over time, or under different potential policy scenarios. A key benefit of modelling is that it can provide information on all locations within its domain, “filling the gaps” between monitors and providing a more complete picture. This comes at a cost of resolution – a 1 km x 1 km grid means that concentrations are smoothed out across the grid squares, but this is less important for assessing changes to population scale exposure over time than it is for compliance with targets at pollution hot spots. High quality modelling could therefore be used to supplement target-based monitoring to assess whether reductions seen in the monitoring data are reflected nationally.
Modelling has its own challenges in relation to longevity of use in assessing population exposure. Monitors are updated from time to time but there is a process to ensure equivalence between different techniques and monitor types. Models tend to be updated more regularly, as both science and computing power improve, and each model uses a different process, making intercomparison of outputs difficult. This also applies to their input data – improvements to emissions inventories will have a consequent impact on the model outputs. Therefore, it is probably not appropriate to base compliance assessments over time (as with an exposure reduction target) solely on modelled outputs without calibration against measurements. Nevertheless, the spatial coverage offered by models makes them better suited to tracking performance across all locations, supplementing a monitoring network. In practice models are often calibrated against local measurements and therefore monitoring and modelling are interlinked.
Summary
Assessing population exposure to air pollution is typically achieved using observed measurements, model estimates or a combination (e.g. land-use regression model), all of which are available at Scottish level. Although in theory population exposure could be assessed using monitoring alone, a much more comprehensive coverage of monitors would be required for a robust assessment (for compliance assessment the assumption is that the target is a proxy for population exposure – see Research question 3). For example, As shown in Table 3‑2, larger urban areas are overrepresented in pollutant monitoring, conversely small towns are underrepresented compared to population proportions. Therefore, in order to assess population exposure using monitoring alone, the subset of monitors used would need to represent proportions of population across these areas, which would require a large increase in the numbers of monitors.
It is therefore recommended that a combination of monitoring and modelling is used in Scotland when assessing exposure, now and into the future, with the key uncertainties of each approach being understood and transparent. The WHO provides a useful overview of several air quality measurement and modelling methods that can be used to estimate air pollutant concentrations and presents multiple approaches to monitoring ambient air pollution at different spatial and temporal scales for estimating population exposures[30].
R3: To what extent could this evidence base be used to, or supplement, progress tracking towards the achievement of an exposure reduction target, such as that in the revised Ambient Air Quality Directive or England’s Environmental Improvement Plan?
As outlined in Appendix A1, Exposure Reduction targets are commonly tracked, in terms of compliance, by monitoring sites as set out in relevant statutory instruments. A sufficient number of sites would be required, with instrument types specified. Monitoring has most commonly been used to assess population exposure targets using urban background and suburban sites to (indirectly) represent the population, weighted by being representative of significant proportions of the population. Scotland currently has a population of approximately 5.5 million, with ~72% living in urban areas (split between classifications 3 and 4 of large urban areas and other urban areas[31]), 8% living in remote rural and remote small towns, and 20% living in accessible rural and accessible small towns.
In the Scottish Air Quality Network, using automatic reference analysers only, for NO2, there are 12 urban background sites, 2 suburban and 4 rural sites which could potentially be used. For PM2.5 there are 7 urban background sites and 2 rural sites.
The European Directive (as set out in 2024 Directive on ambient air quality and cleaner air for Europe26), Annex III B sets out the minimum number of sampling points for fixed measurement to assess compliance with the PM2.5 and NO2 average exposure reduction obligations. For each of PM2.5 and NO2, at least one sampling point per average exposure territorial unit[32], and at least one sampling point per million inhabitants calculated over urban areas in excess of 100 000 inhabitants shall be operated for this purpose. The current structure of air quality zones, established for assessing compliance with the European Directives, divides Scotland into six zones, as shown in
Table 3‑3. Thus, to achieve compliance with the EU Directive requirements, one PM2.5 and one NO2 monitor at a background location would be needed in each zone, other than within the Glasgow Urban area where 2 would be required. This level of monitoring is not currently in place, and is described after Table 3‑4 showing actual numbers of monitoring sites in designated zones and agglomerations in Scotland.
For the English PM2.5 Exposure Reduction Target, the Environmental Targets (Fine Particulate Matter) (England) Regulations 2023[33] sets out, in addition to the siting criteria, the minimum number of monitoring stations based on population in specific zones. These requirements are also summarised in Table 3‑3, based on the population of each zone when it was defined in 2000.
| Zone name | Population in 2000[34] | Sites (PM2.5 and NO2) required for EU Directive | Sites required for English PM2.5 targets - Background | Sites required for English PM2.5 targets – “near source” |
|---|---|---|---|---|
| Scottish Borders | 246,659 | 1 | 1 | 1 |
| Central Scotland | 1,628,460 | 1 | 4 | 2 |
| North East Scotland | 933,485 | 1 | 2 | 1 |
| Highland | 364,639 | 1 | 2 | 1 |
| Edinburgh Urban Area | 416,232 | 1 | 2 | 1 |
| Glasgow Urban Area | 1,315,544 | 2 | 4 | 2 |
| Zone name | Automatic NO2 sites - Urban Background | Automatic NO2 sites - Rural | Automatic NO2 sites - Sub-urban | PM2.5 sites - Urban Background | PM2.5 sites - Rural | PM2.5 sites - Sub-urban |
|---|---|---|---|---|---|---|
| Scottish Borders | - | 1 Eskdale-muir | 1 Peebles | - | - | - |
| Central Scotland | 2 Falkirk Grangemouth, Grangemouth Moray | 2 Bush Estate, Glasgow Waulkmill-glen Reservoir | - | 2 Falkirk Grange-mouth, Grange-mouth Moray | 2 Auchen-corth Moss, Glasgow Waulk-mill-glen Reservoir | - |
| North East Scotland | 1 Dundee Mains Loan | - | - | 1 Dundee Mains Loan | - | - |
| Highland | - | 1 Lerwick | 1 Fort William | - | - | - |
| Edinburgh Urban Area | 1 Edinburgh St Leonards | - | - | 2 Edinburgh Currie, Edinburgh St Leonards | - | - |
| Glasgow Urban Area | 2 Glasgow Anderston, Glasgow Townhead | - | - | 2 Glasgow Anderston, Glasgow Townhead | - | - |
Table 3‑4 shows that the number of sites required for the EU directive definition is not met for NO2 in the Highland Zone or the Scottish Borders Zone (unless rural is used); for PM2.5, the number of sites required is not met in the Scottish Borders Zone or Highland Zone. In all cases a background site would be required for each of the pollutants. Table 3‑4 also includes the names of the current background, rural and suburban monitoring sites in Scotland.
The requirements set out in the Environmental Targets (Fine Particulate Matter) (England) Regulations 2023 for the English PM2.5 Exposure Reduction target are only met in the Edinburgh Urban Area zone, and in Central Scotland zone if rural sites are counted as background. All zones have enough ‘near source’ PM2.5 monitors required under the English regulations, other than the Borders for which there are no PM2.5 monitors. There is, in some locations, a relatively large shortfall of background sites for assessing compliance. The Glasgow Urban area, Highland and Central Scotland would each need another 2 background PM2.5 monitors, North East Scotland and the Scottish Borders would need an additional 1 background PM2.5 monitor.
Assessing compliance with legislative targets requires more than a scientifically robust monitoring network or model. It is important that the assessment is transparent and thus open to scrutiny, and also that the basis for the assessment is stable over time, especially when the target has a temporal element (i.e. a reduction over a period of years). While air quality monitors are complex pieces of equipment, they have the advantage of being physical objects operated according to published standards and protocols. This gives them greater visibility than models, which are often seen as “black boxes” and thus less transparent. Consequently, monitoring data tends to command greater trust, especially for non-experts (including both policy makers and the general public).
Natural source components of PM2.5 (such as sea salt) are difficult or impossible to control but may account for substantial contributions to a monitored pollutant sample. Whereas modelling can be used to try to elucidate the different sources of PM2.5, subtracting transboundary or natural contributions is non-trivial. The EU Directive allows for the extraction of natural sources from measured concentrations in relation to compliance assessment (to provide a common obligation across all Member States and avoid requirements to control the uncontrollable). However, there is no universal methodology for doing so.
Models also tend to be less stable over time, as improvements are made both to them and to their input data. Nevertheless, a purely monitoring approach cannot provide the same spatial resolution as a model. It is recommended that Scottish Government track compliance with respect to exposure reduction through monitoring, but use modelling for other aspects of policy delivery, such as to keep track on the impact on equality and to ensure that benefits are reflected across all communities.
R4: To what extent could this evidence base be used to assess the variation in exposure for different demographic groups, such as those in more deprived communities or with protected characteristics?
Pollution sources are unevenly distributed, with some communities disproportionately impacted by higher emissions. People living in areas with higher pollutant concentrations are more likely to experience a variety of health problems, including respiratory conditions, heart conditions, birth complications, cancers, and overall mortality [35]. High levels of pollutant exposure can compound other health risk factors, contributing to, or worsening, health inequality: people on low income in Scotland, for instance, are more likely to experience respiratory and cardiovascular conditions, low birthweight, and higher all-cause mortality[36].
Scotland has a long history of health inequality, and notable inequalities in air pollutant exposure [37]. In particular, there are significant markers of potential socioeconomic inequality, including links to income deprivation, ethnicity, disability, and housing tenure.
Catalano and Congreve (2025) outlined that these inequalities in exposure are visible both across Scotland and within large urban areas, which have higher levels of health-affecting air pollutants. This means that these inequalities are not solely because certain groups are more concentrated in cities. Within large urban areas, people living in deprived areas, people from minority ethnic backgrounds, people with mental health conditions, and people in rented accommodation experience higher-than-average levels of both PM2.5 and NO2 based on their place of residence. For example, Gray et al. (2024) combined census data on socio-economic deprivation and detailed population ethnicity, with pollutant emissions in England at fine spatial scales. All 24 minoritised ethnic groups studied experienced higher average local NOx and PM2.5 emissions than socio-economically matched populations in the majority ‘White: English, Welsh, Scottish, Northern Irish or British ethnic group. Bangladeshi, Pakistani and Roma groups experienced on average 40%, 40%, and 36% higher PM2.5 emissions locally than matched white groups. For NOx the largest contributors leading to disparity were road transport (48%), domestic combustion (23%) and industry (15%). For PM2.5 the greatest contributors to disparity were domestic combustion (53%), road transport (19%), and industry (11%).
Work undertaken in Scotland on inequalities38 concluded that there is still a gap in recognising and tracking inequality in pollutant exposure. Many policy documents discuss reducing health inequalities or inequalities in air pollutant concentrations, but there is not currently a way of regularly monitoring or reporting where these inequalities lie. This can be a difficult and specialised task, which means that local authorities, who are tasked with developing strategies and reporting on their progress in reducing air pollution, are not regularly able to monitor for, or develop the necessary strategies to improve, these inequalities. If reducing inequalities in pollutant exposure, and reducing correlated health inequalities, is a goal for Scotland, local authorities need to have the capacity, data, and capability to do so.
For assessing the variation in exposure for different demographic groups, such as those in more deprived communities or with protected characteristics, concentrations either monitored or modelled, or modelled emissions would need to be compared with demographic data (such as that outlined under Research Question 1). When evaluating air pollution exposure inequalities, it is important to have air pollution concentrations as well as sociodemographic and socioeconomic data at similar spatial scales.
The combination of spatially resolved concentration data and fine-grained demographic data described in R1 provides a basis for assessing variation in exposure across demographic groups in Scotland. For modelled air pollutant concentrations, the EMEP4UK and related chemistry-transport models (including CMAQ-ISAM) described in R1 provide outputs at 1 x 1 km spatial resolution against which population data could be overlaid. For demographic data, the 2022 Scottish Census provides population counts by age, sex and ethnicity at data zone level (~760 population per zone). The Scottish Index of Multiple Deprivation (SIMD) ranks all data zones across seven domains and provides an overall deprivation rank. In addition, the 6-fold Urban Rural Classification categorises data zones by degree of urbanisation. Together, these datasets allow concentration estimates to be assigned to population subgroups defined by area-level deprivation, urban–rural setting, and ethnicity. The availability of detailed ethnicity categories at data zone level is a distinctive feature of the UK census that enables disaggregation not possible in most other countries.
Gray et al[38] concluded that although living near to road transport and in city centres are frequently cited as primary drivers of ethnicity and deprivation-based disparities, the analysis for England identified that industrial, domestic and off-road sources create issues of the same magnitude, and disparities remain in suburban settings, smaller towns and some rural areas. However, this finding should not be assumed to transfer directly to Scotland, and this has not yet been systematically investigated outside urban areas.
Emissions can also be used to understand the relationships between demographic groups and exposure. Using emissions has some advantages over using concentrations, for example, it enables source apportionment to identify key sources for targeted action, there is a direct link to policy interventions which largely focus on reducing primary emissions, and it avoids complex dispersion modelling. Using emissions can also more effectively highlight environmental justice issues, for example by identifying marginalised communities near to localised sources, which might be missed by broader lower-resolution concentration maps. It is important to note, however, that while NOX concentrations are usually dominated by emissions from local near-ground sources, PM concentrations include much larger contributions from regional and continental scale transport and natural sources, so links from local emissions to concentrations are weaker.
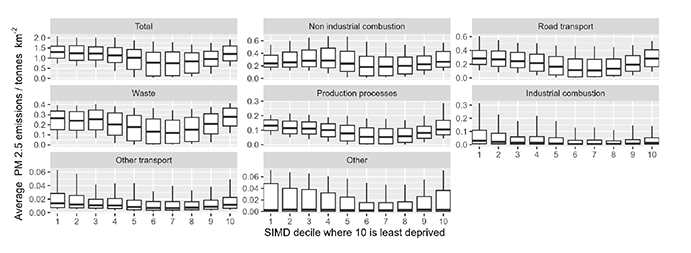
To provide an example of the sort of analysis which could be undertaken using emissions data, which is publicly available for Scotland, the following analysis, undertaken for this project, uses data from the NAEI and the SIMD. Figure 3‑4 to Figure 3‑6, show the average emissions at place of residence from each emission sector to determine the relationship between deprivation and air pollutant emissions and the dominant sources of PM10, PM2.5 and NOx for each deprivation decile.
‘Other’ sources are the sum of emissions from energy production, agriculture, natural sources, solvents and offshore emissions Note different vertical scale limits for each panel.
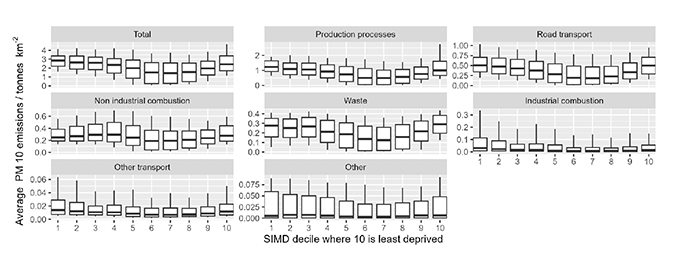
Other sources are the sum of emissions from energy production, agriculture, natural sources, solvents and offshore emissions Note different vertical scale limits for each panel.
Other sources are the sum of emissions from energy production, agriculture, natural sources, solvents and offshore emissions. Note different vertical scale limits for each panel.
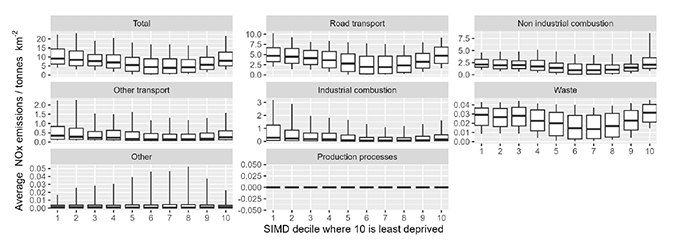
The above analysis shows that total emissions in the 1km2 grid surrounding place of residence for NO2, PM10 and PM2.5 are highest at lower and higher deprivation deciles, with the lowest average emissions falling in deciles 6 and 7. This association is replicated for all pollutants and is largely driven by transport emissions across different deprivation deciles. An important issue linked to environmental justice is that whilst more deprived communities in the UK have been estimated to be exposed to greater ambient air pollution arising from road transport, those communities make a smaller contribution to transport emissions than less deprived groups17. Many of the other sources of pollutants, notably non-industrial combustion (domestic burning), do not show the same association across deprivation deciles. Scottish House Condition Survey[39] data suggests that solid fuel use spans a range of housing types and income levels, although a UK wide survey[40] concluded that burning prevalence rose with social grade, income, education, and employment. The relationship between deprivation and PM2.5 exposure therefore differs between large urban areas where traffic may be a dominant local source and deprivation correlates more directly with proximity to major roads, and locations where other sources such as domestic burning predominate.
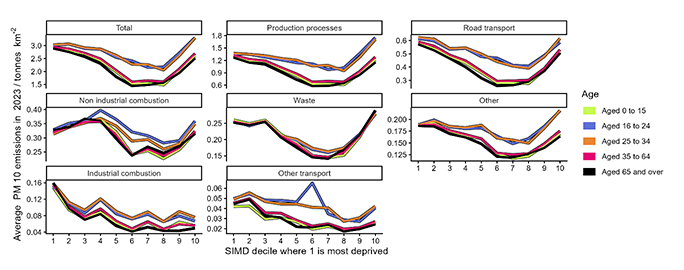
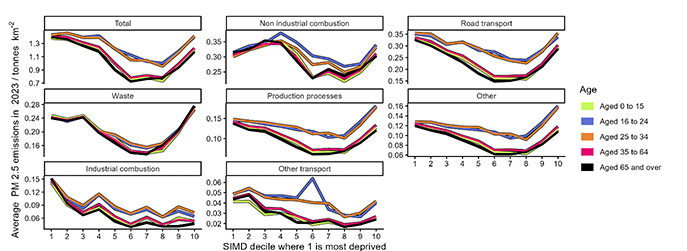
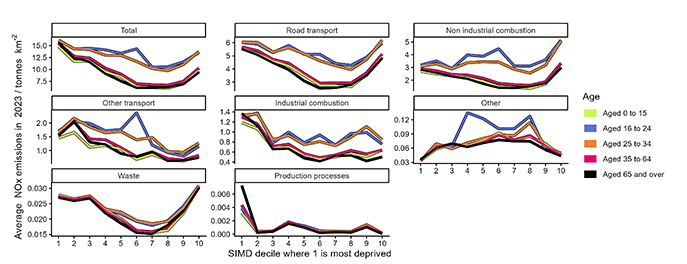
Similarly to the above analysis, age data from the 2011 census was used[41] to stratify exposure, with the principal interest in age-stratified exposure in identifying whether children or older adults experience systematically different concentrations. This was used alongside deprivation data to identify intersectionalities. Figure 3‑7 to Figure 3‑9 show that emissions at place of residence are different in relation to age category. Those aged 16-34 experience similar average emissions of PM2.5, PM10 and NOx from all sources to those aged 25 to 34, with under 16s and those over 35 also experiencing similar emissions. Those aged 16-34 experience the highest average emissions. The gap is wider in middle and less deprived deciles. For children, travel to school and where school is located are significant factors that can influence overall exposure to air pollution; the evidence base does not currently support exposure assignment by school location.
Other sources are the sum of emissions from energy production, agriculture, natural sources, solvents and offshore emissions. Note different vertical scale limits for each panel.
Other sources are the sum of emissions from energy production, agriculture, natural sources, solvents and offshore emissions. Note different vertical scale limits for each panel.
Other sources are the sum of emissions from energy production, agriculture, natural sources, solvents and offshore emissions. Note different vertical scale limits for each panel.
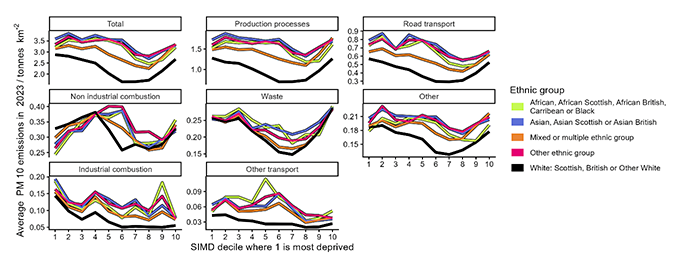
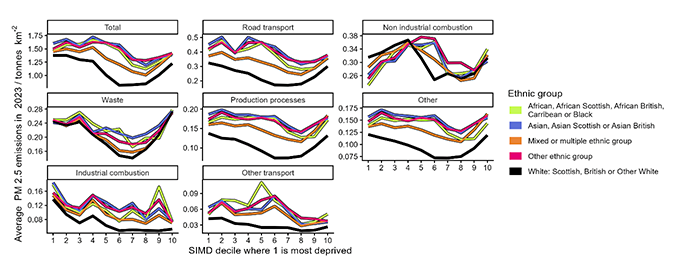
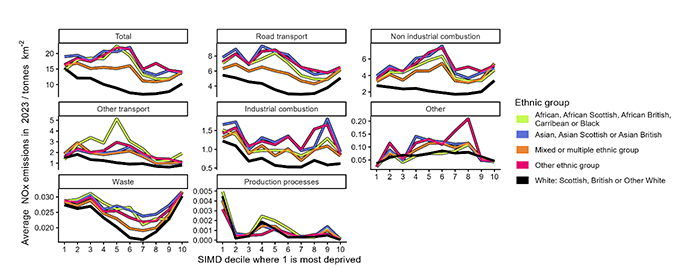
Ethnicity data from the 2011 census was used to evaluate if there were systemic differences in emissions experienced by minoritised ethnic groups. SIMD decile was also plotted to separate the effects of deprivation from those of ethnicity. Figure 3‑10 to Figure 3‑12 show that minoritised ethnic groups experience higher emissions at place of residence than Scottish, British or other white members of the population for all pollutants. Specific ethnic groups (Asian, African, Caribbean black and other ethnic groups) experience higher emissions than mixed or multiple ethnic groups for all pollutants.
Other sources are the sum of emissions from energy production, agriculture, natural sources, solvents and offshore emissions. Note different vertical scale limits for each panel.
Other sources are the sum of emissions from energy production, agriculture, natural sources, solvents and offshore emissions. Note different vertical scale limits for each panel.
Other sources are the sum of emissions from energy production, agriculture, natural sources, solvents and offshore emissions. Note different vertical scale limits for each panel.
Disability data from the 2011 census was used to assess if there was inequality in emissions based on disability. This found no clear difference in emissions at place of residence between those with no disability, those with a disability that limits their day-to-day activity a little, and those with a disability that limits their day-to-day activities a lot.
Summary
The current evidence base in Scotland is sufficient to support analysis of exposure variation by deprivation, urban–rural classification, age and ethnicity. For NO2, where spatial variation is substantial, existing data can provide meaningful estimates of exposure differentials across demographic groups, including by deprivation, age and ethnic group. For PM2.5, the combination of spatial homogeneity, low absolute concentrations and the dominance of secondary and transboundary sources means that detectable differentials between demographic groups are likely to be smaller and may fall within the bounds of uncertainty (see Research Question 5 for a more detailed discussion on uncertainty). The evidence base does not currently support exposure assessment that accounts for time-activity patterns, workplace mobility or indoor environments, all of which are potentially significant in assessing how exposure varies across population groups.
Another dimension to these environmental inequities is that disadvantaged populations also tend to be more vulnerable to adverse health outcomes and have less access to protective measures against these environmental risks.
R5: What are the key uncertainties, such as applicability to very low concentration situations or relationship to measurement uncertainty, and gaps with regards to the evidence base or its use?
Measurement Uncertainty
Data Quality Objectives (DQOs) are the performance criteria that air quality monitoring methods must meet to ensure measurements are sufficiently accurate and reliable for their intended purpose. Established in the EU Air Quality Directive (2008/50/EC), these objectives define the acceptable level of uncertainty, data completeness, and temporal coverage required for regulatory monitoring. The uncertainty requirement represents the maximum acceptable difference between a measurement method and the ‘true’ concentration. For fixed measurements[42], NO2 must achieve 15% uncertainty, while both PM10 and PM2.5 require 25% uncertainty. For example, if an NO2 monitor measures 40 µg m-³ using a fixed measurement method, the true concentration should lie between 34 and 46 µg m-³ (±15%) with 95% confidence. For indicative measurements[43], the uncertainty requirements are relaxed: NO2 increases to 25% and PM increases to 50%.
Importantly, these percentages are calculated at concentrations around the relevant limit or target values. As concentrations reduce, the difference between the stated measurement and the ‘true’ value may often increase. This happens for a variety of reasons, for example at lower concentrations: the signal to noise ratio reduces; the potential for chemical interference increases; the relative importance of sample loss onto sample tubes, or of contamination, increases; and the relative importance of calibration drift increases.
For all pollutants, and in the absence of improved monitoring techniques, measurement uncertainty is therefore expected to increase as concentrations reduce.
Unlike NO2, PM10 and PM2.5 do not have a single true concentration value that can be measured independently of the measurement method. Rather, they are operationally defined quantities, meaning their measured concentration is fundamentally dependent upon the sampling, conditioning, and analysis procedures employed [44]. This operational definition arises because particulate matter comprises a variable mixture of particle sizes and chemical components, including both non-volatile and semi-volatile species, whose measured mass is influenced by the sampling parameters.
The sampling protocol defined in the European reference method (EN12341) effectively defines which components of the collected particulate matter are included in the final measurement. This method is impractical for routine air quality monitoring and so other techniques are used, which must demonstrate equivalence with the reference method itself by quantifying expanded uncertainty[45].
Different types of PM monitor employ different techniques to achieve reference equivalence. It is therefore not surprising that different compositions of PM can cause different concentrations to be measured by different instruments.
PM concentrations in Scotland are often lower than those found elsewhere in the UK, and indeed in much of mainland Europe. Distance from mainland Europe, and the relative sparsity of high-emitting sources means that the chemical composition of PM will also, on average, be somewhat different from that in England. Furthermore, as efforts to reduce PM concentrations continue to take effect, concentrations are expected to reduce further, with corresponding implications for the composition of atmospheric PM.
AQEG45 noted that in the AURN ongoing equivalence data, there are significant deviations from the 1:1 line in the sub-10 mg/m3 regime, with the implication that equivalence may deteriorate with lower future concentrations. They also highlight that reductions in emissions from many current sources, as well as the potential for new emission sources to emerge in the future, might affect PM composition and therefore hinder the ability of current techniques to measure it.
Network DesignEach individual instrument may record concentrations with differences from the ‘true’ value. Random error tends to cancel out when averaged, meaning that increasing the number of measurements reduces the uncertainty of the mean. However, air quality measurements tend to autocorrelate (i.e. they respond to the same factors at the same time). Increasing the number of monitors used to calculate a mean may have a strong effect on reducing measurement uncertainty for primary pollutants, but a diminished effect for secondary pollutants[46]. This is because secondary pollutants tend to autocorrelate more (e.g. they reflect regional trends) and therefore multiple instruments might all provide the same information.
When measured concentrations are used to estimate population exposure, ‘Berkson’-like error is introduced[47],[48]. This is because the ‘true’ concentration (as opposed to the measurement used to represent it) varies spatially over an area. Increasing the number of monitors only reduces this type of error if the additional sites are not used to calculate more robust spatial averages but are, instead, used for more granular spatial mapping.
NO2 has a relatively weak autocorrelation, therefore using multiple monitors to calculate a mean reduces the effects of random error, but this spatial heterogeneity also increases Berkson-like error if the measurements are used to calculate population exposure. PM10 and PM2.5 have much stronger autocorrelation and therefore there are diminished benefits to using multiple monitors to reduce random error, but also less propensity for Berkson-like error in exposure calculations.
These issues make it excessively challenging to define the precise effect that increasing the number of monitoring sites will have on the uncertainty of calculated population mean concentrations. Nevertheless, when basing population exposure estimates on measured concentrations of NO2, errors introduced by spatial variability in the ‘true’ values (i.e. Berkson-like error) may, in many cases, be considerably greater than the uncertainty in the measurements themselves. In such a case, and assuming that the measurements could be accurately mapped to the exposed population, a more certain estimate of population exposure might come from using a larger network of indicative instruments (e.g. diffusion tubes) than using a smaller network of reference-quality instruments. Conversely for PM, the expected homogeneity of concentrations coupled with the relative uncertainty in indicative vs reference-equivalent instruments, would be more likely to lead to the conclusion that only reference-equivalent monitors should be used.
In practice, while including near-source measurements may reduce both Berkson-like error and bias, accurately mapping the exposed population to these measurements without reference to modelling is unlikely to be possible. Therefore, using only background monitoring to calculate population exposure may provide the most consistent and transparent approach.
Model Uncertainty
When comparing a modelled value with a measurement, in most cases the measurement will be considered more certain. The EU data quality objectives are for modelled annual average concentrations to achieve an uncertainty of 30%, which is more relaxed than that for indicative NO2 monitors, but more stringent than that for indicative PM samplers.
Uncertainty in emissions estimates varies considerably across source sectors: road traffic exhaust emissions on major roads are relatively well characterised, but emissions from domestic burning, Non-Road Mobile Machinery, road traffic non-exhaust emissions, cooking and other diffuse sources are considerably less certain. As road transport exhaust emissions diminish, these more uncertain sources become proportionally more important in the overall inventory. For PM2.5, a further complication is that a substantial fraction of ambient mass is secondary in origin – formed from precursor emissions of NOx, NH3 and volatile organic compounds – or transported from distant sources. Even perfectly characterised local primary emissions would not fully constrain modelled PM2.5 concentrations, because the secondary and transboundary fractions introduce additional uncertainty from chemistry, meteorology and the accuracy of emissions inventories in other regions.
The question of whether population average concentrations are more uncertain when calculated from measurements or models is nuanced. This is because models can account for spatial variability in a consistent way where monitors cannot. Modelling is typically verified against measurements and therefore, notwithstanding its other uses such as future scenario testing, can be viewed as providing a means of interpolating between measurements. As explained above, the spatial variability in NO2 has the potential to introduce considerable error when measurements are used for exposure calculations; in this case, the added granularity of modelling may easily offset the uncertainty introduced by moving from monitoring to modelling. Conversely, for PM10 and PM2.5, the increased spatial homogeneity of the expected concentration field is more likely to lead to a conclusion that the benefits of using modelling will be outweighed by the additional uncertainty of models.
It is also noted that current modelling carried out at 1 km2 x 1 km2 resolution itself misses much of the spatial variation caused by exposure near to emissions sources (including roads) and therefore negates some of the potential benefits that using modelling can have in comparison to using only monitoring to calculate population exposure. Although some modelling approaches can capture finer-scale variations, these would have substantially higher computational cost for national applications.
In practice, the question of ‘which is most certain’ is not trivial to answer and will depend on the specifics of both the monitoring and modelling, the nature of the underlying ‘true’ concentration field, and the distribution of the population across it. Modelling, when calibrated against monitoring, can undoubtedly provide greater precision, and the main casualty to this is likely to be complexity and transparency, rather than accuracy.
Exposure Assignment Uncertainty
A separate category of uncertainty concerns how well ambient concentrations, however accurately measured or modelled, represent actual population exposure. Several factors contribute to this.
People typically spend 80–90% of their time indoors17. Indoor concentrations of outdoor-origin pollutants are generally lower than outdoor concentrations, but the relationship varies with building type, ventilation rate, air tightness and occupant behaviour. No systematic indoor air quality measurement data exists for the Scottish housing stock, meaning that the magnitude and variability of this indoor–outdoor attenuation factor cannot currently be characterised. This is arguably the single largest source of uncertainty in any population exposure assessment derived from ambient data: the quantity being estimated (personal exposure) differs fundamentally from the quantity being measured or modelled (outdoor concentration), and the relationship between the two is both variable and largely unquantified for Scotland.
The concentration datasets catalogued in R1 are typically linked to populations via residential location. However, during working hours a substantial proportion of the population is not at home. Where workplace and residential locations have different ambient concentrations – which is typically the case, since people commute across concentration gradients – residence-based assignment introduces systematic error and may systematically overstate differentials between deprived and affluent areas for the working-age population19.
Regulatory metrics and most of the evidence base rely on annual mean concentrations. These mask diurnal and seasonal variation that may correlate with population activity patterns: outdoor recreation, commuting and school attendance coincide with particular times of day and year. An annual mean assigns equal weight to concentrations at 3 a.m. and at the school run, despite very different numbers of people being exposed. The practical significance of this for population-level estimates is difficult to quantify without temporally resolved exposure modelling.
There is also a spatial mismatch between the units at which concentrations and populations are reported. National background modelling operates on a 1 km x 1 km grid, while census data zones in urban areas typically cover ~0.2 km2. A single model grid cell may therefore contain multiple data zones with different population characteristics. Assigning a uniform concentration to all data zones within a grid cell suppresses real within-cell variation and introduces error into population-weighted exposure calculations, particularly for spatially heterogeneous pollutants such as NO2.
Finally, where exposure estimates are disaggregated by demographic subgroup, the populations within each category in each spatial unit become small, and the statistical confidence in estimated exposure differentials decreases accordingly. This is particularly relevant for ethnic minorities in Scotland, where small population sizes in many data zones will make area-level exposure estimates for specific groups inherently uncertain.
Evidence Gaps
In addition to the uncertainties discussed above, the evidence base contains identifiable gaps. No systematic indoor air quality data exists for Scotland, preventing characterisation of the relationship between ambient concentrations and actual exposure. No Scotland-specific land use regression or hybrid statistical models have been identified that could complement process-based modelling at fine spatial scales. Personal exposure evidence remains sparse, and no routine mechanism exists for integrating workplace or school location into exposure estimation. Source apportionment is not routinely produced for Scottish monitoring data, limiting the ability to attribute measured concentrations to specific source categories. Forward concentration projections have not been updated since a 2021 base year, constraining the assessment of future exposure trajectories, particularly in the context that most progress to lower concentrations appears to have stalled over the most recent 5 years. Finally, while the EMEP4UK and MAQS-Health systems provide powerful research-grade capabilities, there is currently no operational, routinely updated modelling system at the resolution needed for population exposure assessment in Scotland.
R6: What does the project recommend in order to increase the coherence and utility of the evidence base, in the context of the outcomes of the questions above?
The above research questions have looked at three different but overlapping areas. The first is whether the evidence base in Scotland is ‘fit for purpose’ in terms of assessing exposure reduction in general, the second specifically relates to exposure reduction targets (in relation to assessing compliance) and finally whether the current evidence base can be used to assess the variation in exposure for different demographic groups, such as those in more deprived communities or with protected characteristics. All evidence presented in this report has inherent associated uncertainties, and this is a key part of the discussion relating to the most appropriate methods to respond to key questions. This section outlines recommendations for the Scottish Government, which are suggested in order to progress the general study of exposure within the Scottish context, the assessment of compliance with a potential exposure reduction target and more effective consideration of inequalities, as well as reducing the uncertainties in the evidence base.
Recommendation 1: The Scottish Government should use monitoring for assessing compliance with a (potential) Exposure Reduction target, including increasing the monitoring network
Although modelling could be used for assessing compliance, monitoring is a more straightforward, defensible method understandable by the public, which can be written into legislation. Scotland has an established network of reference analysers for NO2 and PM2.5. However, it is recommended that the scale of monitoring should be increased to support a new exposure reduction target, to at least the numbers specified for the English PM2.5 targets. Long running sites at roadside locations should be left in situ to avoid reducing the information on long term trends. New monitoring locations should be chosen to reflect the concentrations experienced by the general population, such as urban background locations, as well as ensuring that an appropriate and representative cross-section of environments is covered.
As explained under R5, measuring gravimetric equivalent PM concentrations using non-gravimetric samplers presents significant challenges, and there are reasons to expect that uncertainty around such measurements may increase in the future. It is worth noting that there is no compelling evidence that it is the gravimetric properties of PM which are most relevant in terms of health effects[49],[50]. There is, therefore, an argument that the internationally established convention of defining PM by mass has funnelled effort toward meeting somewhat abstract targets rather than delivering improved health outcomes. It may be extremely difficult to define an alternative PM measurement standard, but such an approach, for example targeting optical properties rather than mass, could allow a significant expansion in the monitoring network at much lower cost.
Recommendation 2: For assessing population exposure to air pollutants in Scotland, a combination of monitoring and modelling should be used
It should be noted that achieving an exposure reduction target is not necessarily the same as achieving a reduction in exposure for the whole population. Tracking exposure reduction through other means could provide an evaluation of whether achieving the target is having the desired outcome.
It is recommended that a combination of monitoring and modelling is used in Scotland when assessing population exposure, now and into the future, with the key uncertainties of each approach being understood and transparent. Research question 2 sets out the advantages and disadvantages of using monitoring and modelling, but a combination of the two, to some extent covers the short comings of each of the methods. A sub-set of the reference monitors relied on for assessing compliance, which reflects the population demographics of Scotland, could be used in combination with a land-use regression model.
As noted under R1, the use of sensors is a rapidly evolving field alongside AI methods for calibrating networks to enhance accuracy. There is potential that in the future sensors could be part of an approach for assessing population exposure, providing a lower cost solution for assessment. Use of sensor networks would need to be evaluated within the Scottish context in terms of accuracy and precision, but increasing the spatial density of monitoring would potentially make it feasible to assess exposure in a variety of different situations.
Recommendation 3: Where modelling is used for assessment of population exposure, Scottish Government should set out a protocol to ensure consistency in approach
Where air quality modelling is to be used as a mechanism for assessing population exposure, a supporting protocol would be needed to ensure that modelling outputs are comparable. Without such a protocol, there is a risk that different practitioners would adopt different methodological choices and produce results that cannot meaningfully be compared across time.
The protocol would not need to specify every methodological detail. An overly prescriptive approach, such as codifying specific model configurations or input datasets, risks locking the regime into approaches that become outdated as atmospheric science, emissions data, and computing capability evolve. The appropriate level of prescription is likely to be one that sets out the principles and minimum requirements that any compliant approach must satisfy, while leaving sufficient flexibility to adopt newer methods where these can be demonstrated to be appropriate.
One model for this is the approach used in the EU Emissions Ceilings Directive, where core obligations are established in the legislation itself, but the technical methodologies underpinning compliance, such as emissions inventory guidance, are maintained through a separate, periodically revised reporting framework. A similar structure could be adopted here, with a policy instrument establishing the requirement to model in accordance with an approved protocol, and the protocol itself maintained as a living technical document, subject to periodic review by an appropriate expert body.
In broad terms, such a protocol might be expected to address: the classes of model considered acceptable for different assessment contexts; the standards required for input data, including emissions inventories and meteorological datasets; requirements for uncertainty characterisation and sensitivity testing; and requirements for transparency and documentation.
Recommendation 4: The Scottish Government should consider outlining a standardised method for assessing inequalities in relation to different demographic groups and deprivation
The same modelling approach as outlined for assessing exposure in recommendation 2, with spatial coverage consistent with population data (averaged at data zone level), could be used to look at changes in inequalities over time, using a standardised approach (as set out in recommendation 3).
It is recognised that there is still a gap in recognising and tracking inequality in pollutant exposure. This can be a difficult and specialised task, which is largely confined to impact assessments, and academic reports. This means that local authorities, who are tasked with developing strategies and reporting on their progress in reducing air pollution, are not regularly able to monitor for, or develop the necessary strategies to improve, these inequalities38. Should a standardised method be put in place, this data could then be made available to local authorities for use in the Local Air Quality Management (LAQM) process, in order to integrate a consideration of reducing inequalities to Air Quality Acton Plans and Strategies. The inequalities data could be updated periodically in the same way as background maps and other supporting tools for LAQM. This information could be used to target measures in locations which could maximise the reduction in inequalities. The evidence would also help local authorities to ensure that monitoring networks cover a range of areas with different demographic profiles.
Recommendation 5: Scottish Government should consider sponsoring research around the relationship between ambient measurements and actual exposure and its impacts on health
Health evidence relating to the impact of exposure to air pollution largely relies on population studies which relate ambient (outdoor) pollution concentrations to data on health outcomes. In this way, ambient concentrations are used as a proxy for exposure. As ambient concentrations reduce, the variations in the levels that people are actually exposed to in their daily lives may become more significant in understanding their effects on health, as the predominance of outdoor air pollutants reduces. Currently, no systematic data exists for Scotland on the variations which people experience as a result of their daily activity (e.g. relating to employment type). This prevents the characterisation of the relationship between ambient concentrations and actual exposure, which will be important in assessing the “real” impact of achieving a population exposure reduction target.
Moreover, a recent report for the Scottish Government36 concluded that while the global evidence around the links between exposure to air pollutants and health effects is robust, the specific evidence regarding air pollution and health outcomes in Scotland is limited and inconclusive. Further research in the Scottish context, considering multiple pollutants and addressing data limitations, is necessary to provide more conclusive insights into the relationship between air pollution and health outcomes in Scotland, particularly for different demographic groups.
Recommendation 6: Routine source apportionment should be undertaken at monitoring sites, particularly those potentially used for exposure assessment (including those assessing compliance)
Source apportionment is crucial for air pollution policy making because it identifies and quantifies the main pollutant sources, contributing to overall emissions or concentrations, which will differ across pollutants. By distinguishing between different sources, and between local and regional sources (especially relevant for particulate matter), source apportionment can inform targets, cost effective policies and specific actions to improve air quality. Source apportionment is not routinely produced for Scottish monitoring data, limiting the ability to attribute measured concentrations to specific source categories and hence identify the most effective measures to reduce exposure to pollutants. Source apportionment can be undertaken using either measurements, or modelling, having regard to the uncertainties which are outlined in R5.