Access to free period products: baseline survey results
Report to present the baseline survey results on experiences and views towards access to free period products in Scotland. Data was collected prior to the Period Products (Free Provision) (Scotland) Act 2021 coming into force on 15 August 2022.
Attitudes and concerns about periods
Understanding the attitudes, experiences and concerns of people who may need to use period products will be important in helping future consideration of how free period product provision is provided in Scotland. It is also fundamental in potentially breaking down any barriers to providing convenient, free of charge, and as required period products to those who need them.
Concerns regarding periods
For just over a third of respondents, having their period causes no worry or concern (34%). However, for the rest of the respondents (two-thirds), there was some degree of worry or concern about having their period (see Figure 5 for detail).
QA1. How worried or concerned, if at all, are you about having your period?
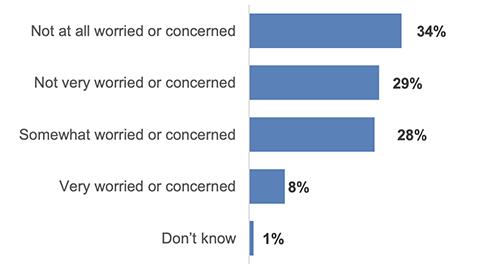
Base: All respondents (adult and children) (1400)
Those most likely to be very worried or concerned about having their period were those who:
- Had less frequent periods. 12% of those who had periods less frequently than once a month were very worried or concern about their period (compared to 8% who have a period at least once a month).
- Had irregular periods (13%, compared to 7% who had regular periods).
- Were concerned about their monthly spend on period products (14%, compared to 4% for those who monthly spend is not a concern).
- Had used reusable products (18%, compared to 6% of respondents using single use products).
- Had accessed free period products (13%, compared to 5% who had not accessed free period products).
- Had a disability (11%, compared to 8% who have no disability).
All respondents who had raised some level of concern or worry were asked what specifically worries them. The most likely reasons referred to their health or the physical symptom of periods. In particular, the most commonly cited worries were: pain, cramps and discomfort (28%); heavy or prolonged bleeding/large clots (14%); and leaking (12%) (Table 1).
| Percentage of respondents | |
|---|---|
| Pain/cramps / discomfort | 28% |
| Heavy / prolonged bleeding / large clots | 18% |
| Irregular bleeding | 14% |
| Leaking / bleeding through | 12% |
| Being prepared / having sanitary products when needed | 10% |
| Other health conditions / medication | 5% |
| Negative attitude towards period | 4% |
| The price of products (too expensive) | 3% |
| Hormones / mood swings / PMS | 3% |
| Sickness / nausea | 3% |
| Tiredness/sleep issues/fatigue/lack of energy | 2% |
| Embarrassment | 2% |
| Other | 9% |
| Don't Know | 9% |
Base: All who were worried or concerned about their periods (908)
Question: A2. If you are worried or concerned, in your own words, please explain what aspect(s) of having your period causes this worry/concern.
The price of period products was reported by 3% as being a concern. However, this increased amongst groups who had previously raised the financial implications of menstruation. For example, 15% of those who struggled to afford period products reported the price of period products as a concern (compared to 2% for those able to afford period products).
Respondents were asked to consider multiple statements and indicate how much they agreed or disagreed with each statement. These statements covered possible concerns or worries people may have regarding their periods or use of period products (Figure 6). Key findings include:
- Eight in ten of respondents felt they had adequate information concerning their periods (80%).
- 44% of respondents disagreed with the statement 'I feel embarrassed when obtaining period products for free'. The responses for this statement had a higher level of 'not applicable' or 'don't know' than all other statements (15%, compared to between 1-2% for the other statements in Figure 6). This is most likely due to respondents not having accessed free period products and therefore they were unable to answer this statement with an 'agree' or 'disagree' response.
- In relation to embarrassment when buying period products and being afraid of others teasing them when on their period, these statements both had high levels of disagreement (63% and 66%, respectively). Similarly, a high proportion of respondents agreed that they felt comfortable talking to others about their period (72%).
- 44% of respondents agreed that they were worried about the amount they spend on period products each month (38% disagreed with this statement).
QA12.1-A12.6. To what extent do you agree or disagree with the following statements?
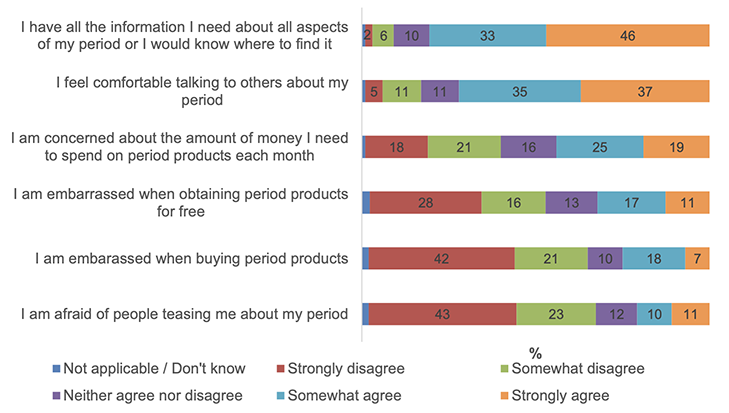
Base: All respondents (adult and children) (1400), apart from the statement 'I am concerned about the amount of money I need to spend on period products each month' which was all adults 16+ (1288)
Notes: Figure 6 displays the summary disagreement and agreement levels of respondents. QA12 in the data provide a breakdown of the response options on a five point agree/disagree scale. Where data labels for each statement do not reach a total of 100% this is due to the 'Not applicable/Don't know' percentage not being included in the chart as a data label. Where this is the case, the proportion is 2% or lower. These exact proportions can be found in the Tables. Where stacked bars do not total 100% it is due to percentages being rounded to the nearest whole.
An overview of statistically significant differences by sub-group is provided below for the statements on possible concerns or worries people may have regarding their periods or use of period products (Table 2).
On the whole, Table 2 highlights that amongst some sub-groups there were two key groups who were more likely to have concerns or worries regarding their periods or using period products. These were young people (compared to adults) and respondents living in lower income households (compared to those living in higher income households).
Worries and concerns of those menstruating by key sub-group variation
Statement: I feel comfortable talking to others about my period.
Sub-group variation: Most likely to be comfortable:
- Those who used reusable products (79%, compared to 70% of respondents using single use products)
- Those who had already accessed free period products (76%, compared to vs 69% of those who had not accessed free period products)
Statement: I am concerned about the amount of money I need to spend on period products each month.
Sub-group variation: Most likely to have concerns:
- Those aged 16-24 years (59%, compared to 46% for those aged 25-34 years and continuing to fall to 37-38% for those in the age categories 35 years and over)
- Those unaware of free period products (49%, compared to 43% who were aware of free period products)
- Those from lower income households (60%, compared to 39% of higher income households)
Statement: I am afraid of people teasing me about my period.
Sub-group variation: Most likely to be afraid:
- Young people (12-15 years) (59%, compared to 17% of adults)
- Those who had already accessed free period products (31%, compared to vs 12% of those who had not accessed free period products)
- Those who had struggled to afford period products (28%, compared to 16% who felt they were able to afford period products)
Statement: I am embarrassed when buying period products.
Sub-group variation: Most likely to be embarrassed buying period products:
- Young people (55%, compared to 22% of adults)
- Those who raised concerns about their monthly spend on period products (32%, compared to 12% who did not have concerns about their monthly spend)
- Those who had already accessed free period products (31%, compared to vs 19% of those who had not accessed free period products)
Statement: I am embarrassed when obtaining period products for free.
Sub-group variation: Most likely to be embarrassed obtaining free period products:
- Young people (58%, compared to 25% of adults)
- Those who had faced barriers when obtaining free period products (49%, compared to 32% who had faced no barriers)
- Those from lower income households (26%, compared to 19% of higher income households)
Statement: I have all the information I need about all aspects of my period or I would know where to find it.
Sub-group variation: Most likely to have enough information:
- Young people (89%, compared to 79% of adults)
- Those aware of free period products (82%, compared to 74% who were unaware of free period products)
- Those who had not accessed free period products (82%, compared to 78% of those who had already accessed free period products)
- Those from higher income households (86%, compared to 74% of lower income households)
Base: All respondents (adult and children) (1400)
Questions: A12.2-A12.6. To what extent do you agree or disagree with the following statements?
Access to period products
The majority of respondents purchased period products by themselves (90%) (Figure 7). This proportion falls for young people (54% compared to 93% for adults).
QA3A. How do you normally get your period products?
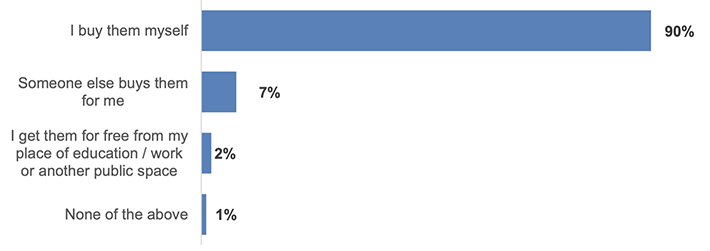
Base: All respondents (adult and children) (1400)
A small proportion of all respondents (2%) relied upon free period products. This is more likely among younger age groups. However, it is important to consider the context of when the survey data was collected. The Scottish Government introduced The Period Products in Schools (Scotland) Regulations 2020, which placed a legal duty on local authorities and grant-aided schools to provide free period products for pupils. This meant young people, who are more likely to be in education, had free period products more widely available to them. As local authorities expand access to free period products, an increase in uptake amongst adult age groups is expected.
Further, a statistically significant proportion of respondents from lower income households obtained their period products for free compared to those from higher income households (4% and 1%, respectively). This suggests that access does appear to be benefitting those potentially most in need.
Survey respondents were asked to consider whether they were able to afford enough period products each month to continue with their day-to-day activities (Figure 8). The majority of the respondents reported being able to afford to buy enough period products, with 65% reporting always being able to afford to buy enough products to continue with their day-to-day activities. A further 25% reported normally being able to afford enough period products. This totals a net of 91% generally being able to afford period products. 9% reported sometimes not being able to afford enough products and 1% of respondents were hardly ever able to afford enough period products.
QA3. Over the past 12 months, which of the following best describes your ability to afford enough period products to allow you to continue with your day-to-day activities as normal?
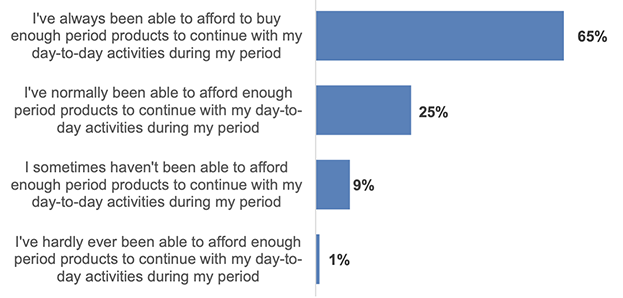
Base: All adults 16+ who bought their own period products (1199)
By sub-groups, there were some statistically significant variations:
- For those with awareness of free period products they were generally able to afford enough period products, compared to those who were unaware of access to free products (93% and 85%, respectively). This suggests awareness raising is required for those most in need of free products.
- Respondents who agreed with the statement that they were concerned about their monthly spend on period products were more likely to struggle to afford period products compared to those with no concern over their monthly spend (16% and 4%, respectively).
- Respondents living in lower income households were less likely to report generally being able to afford period products than those living in higher income households. 76% for those with a household income of under £10,000 compared to 98% for those with a household income of over £40,000.
Respondents who were unable to access enough period products to meet their needs[7] were asked how they managed their period (Table 3). The most common alternative was to: use the same type of products, but cheaper brands (54%); use different types of period product (e.g. sanitary towels or liners instead of tampons) (37%); wear products for longer than normal (30%); and, use other products such as toilet roll (27%). The least commonly reported alternatives to managing their period was stopping some of their day-to-day activities and borrowing free products from friends or family (both 11%).
| Percentage of respondents | |
|---|---|
| I use the same type of products but cheaper brands | 54% |
| I use different types of period products from my preferred option (e.g. sanitary towels or liners instead of tampons) | 37% |
| I wear the products for longer durations than I would normally do | 30% |
| I use other products such as toilet roll | 27% |
| I try to obtain free period products from my place of education / work or another public place | 19% |
| I get / borrow free period products from friends or family | 11% |
| I stop some of my day-to-day activities such as going to work or my place of education, going out or practicing sports/exercising | 11% |
| Other | 1% |
| Don't know | 1% |
Base: All adults 16+ who were unable to afford enough period products to meet their needs (416)
Question: A5a. When you are unable to buy sufficient products to meet your needs during menstruation, what do you normally do to manage your period?
There are variations in response by sub-group, particularly by age. Younger adults (aged 16-24) were more likely to:
- Report borrowing from friends or family (18%, compared to 11% of the total).
- Report obtaining free period products (29%, compared to 19% of the total).
The negative impact of not being able to buy sufficient products appeared exacerbated amongst older adults (aged 45 to 54 years). They were more likely to report stopping their day-to-day activities as a result of not being able to buy sufficient products to meet their menstruation needs (20%, compared to 11% of the total).
Contact
Email: socialresearch@gov.scot