Workplaces programme: equality impact assessment - summary
Equality impact assessment (EQIA) for our workplaces programme.
Annex B: Comparison between 2012 and 2017 characteristics
This annex shows the comparison between the 2012 data included in Annex A and an extract from November 2017.
In general, there is no significant change in the distributions since 2017.
Age
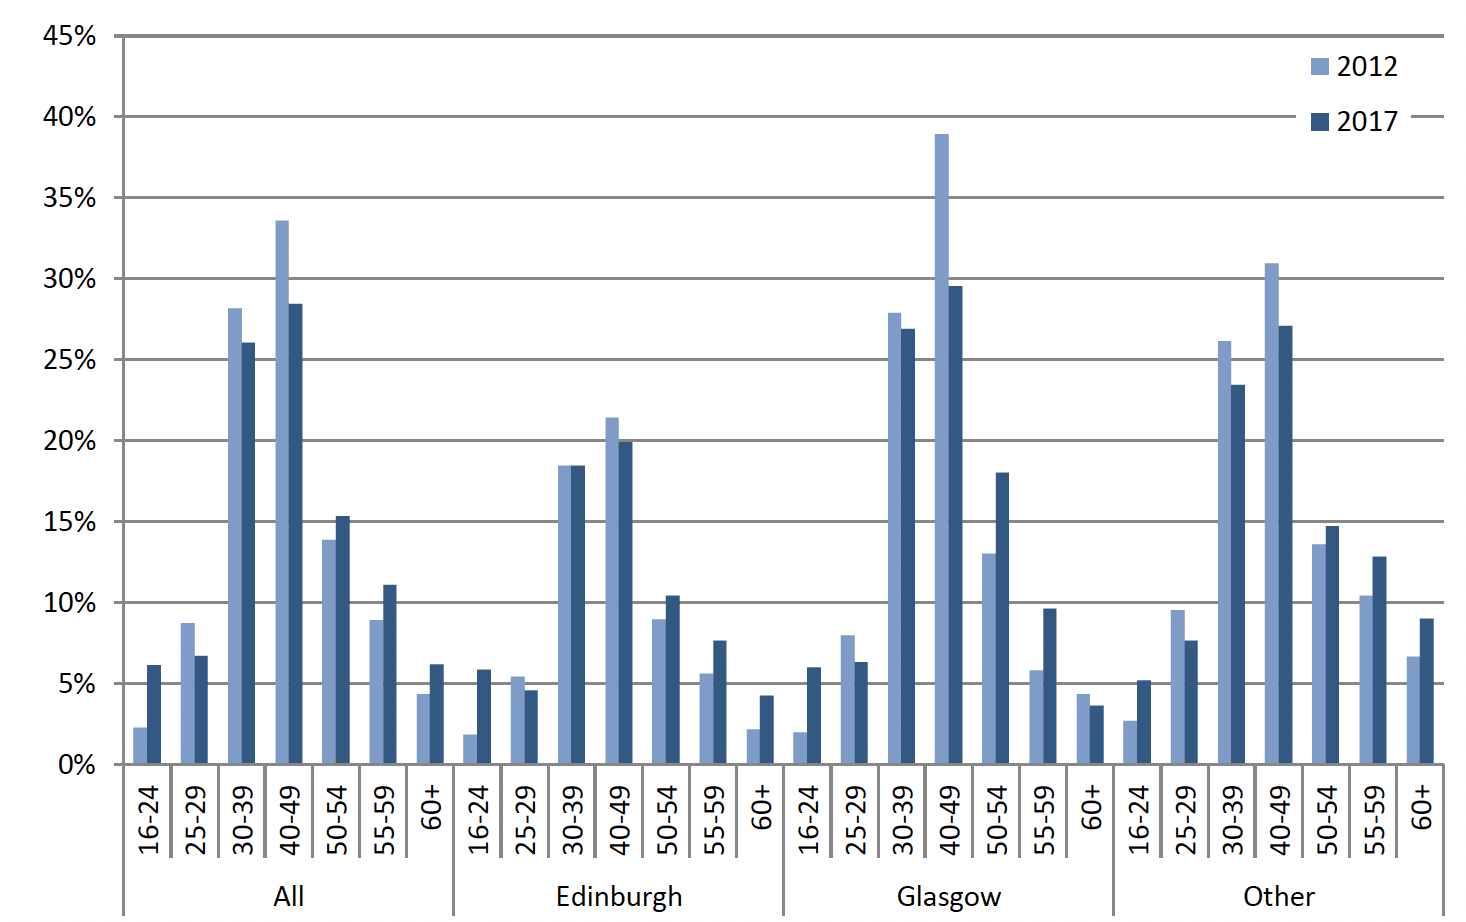
Although there has been some change in the age demographics across the estate, there is no significant difference from the original Equality Impact Assessment (Figure 1).
Grade
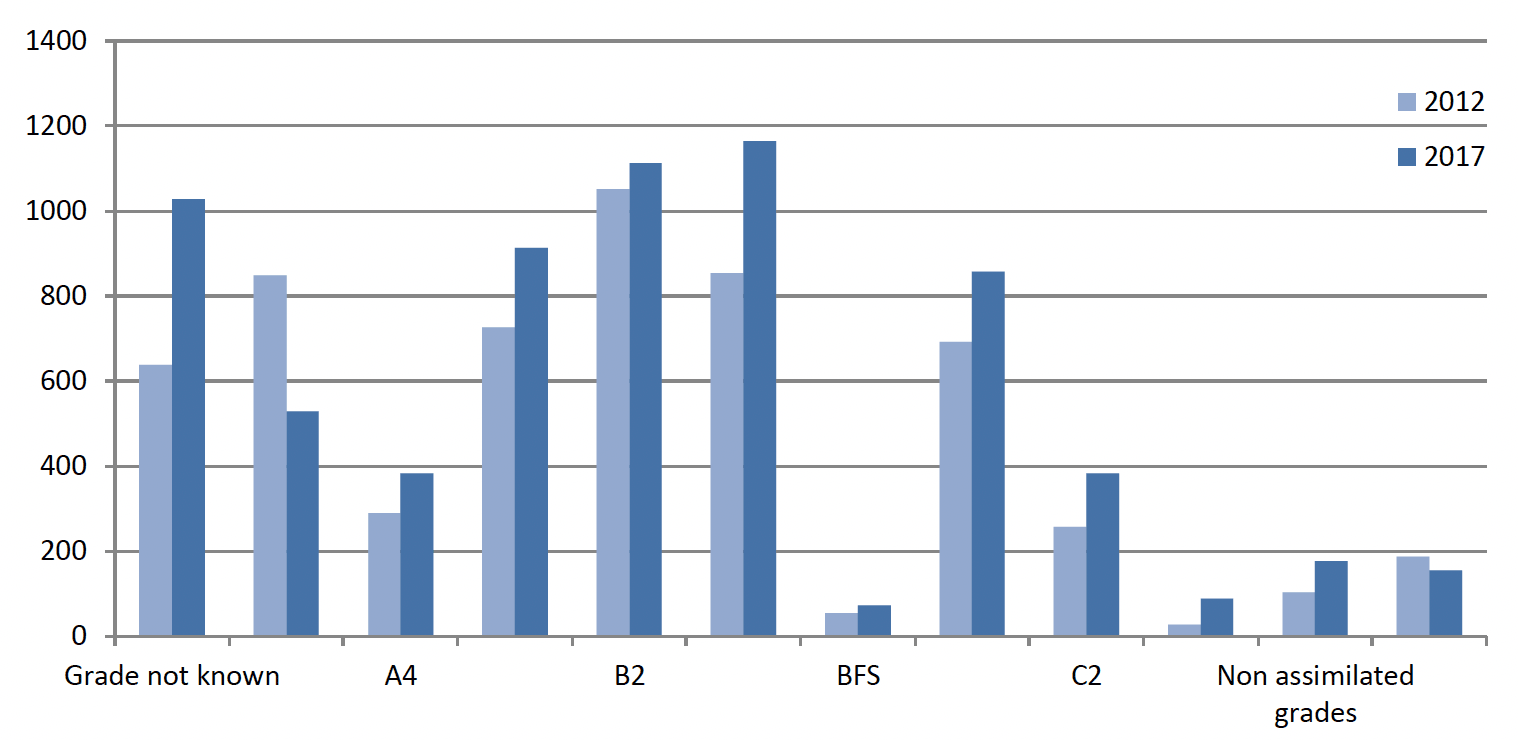
Figure 2 shows that, in general across all grades (except A3 and SCS) there has been an increase. Grade not known are generally contractors such as those working with RPID and on the set up of the new Social Security Agency. This shows that the organisation has grown since 2012.
Disability
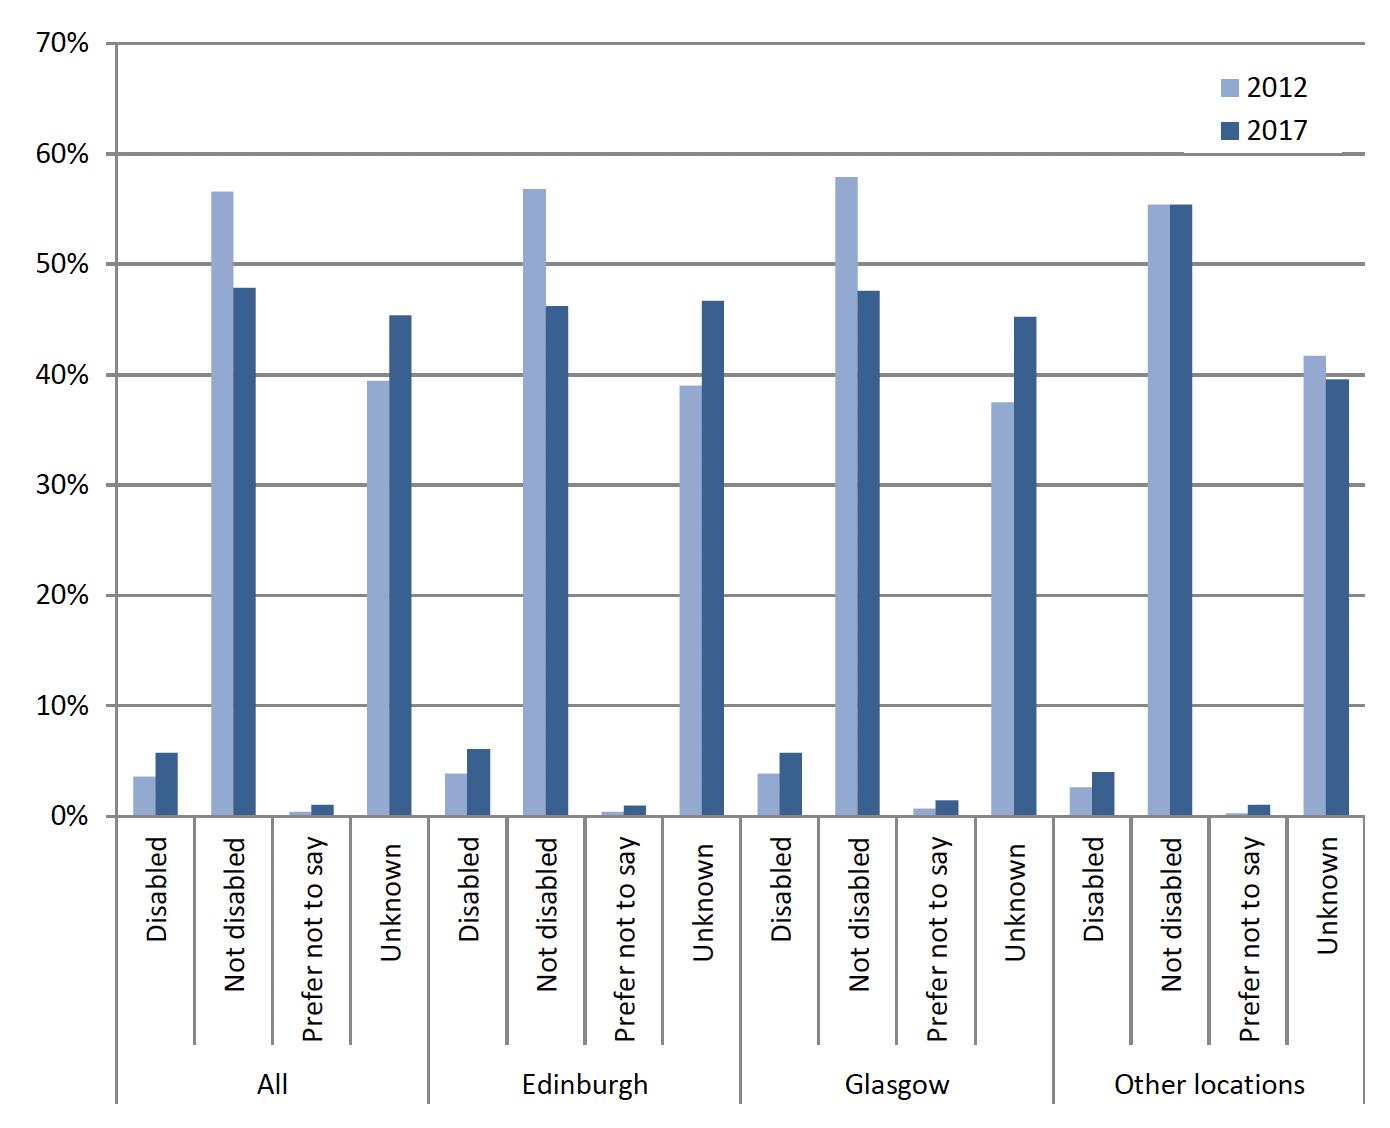
Figure 3 illustrates that there has been a slight increase in those identifying themselves as disabled between 2012 and 2017, and a decrease in those identifying themselves as not disabled.
Gender
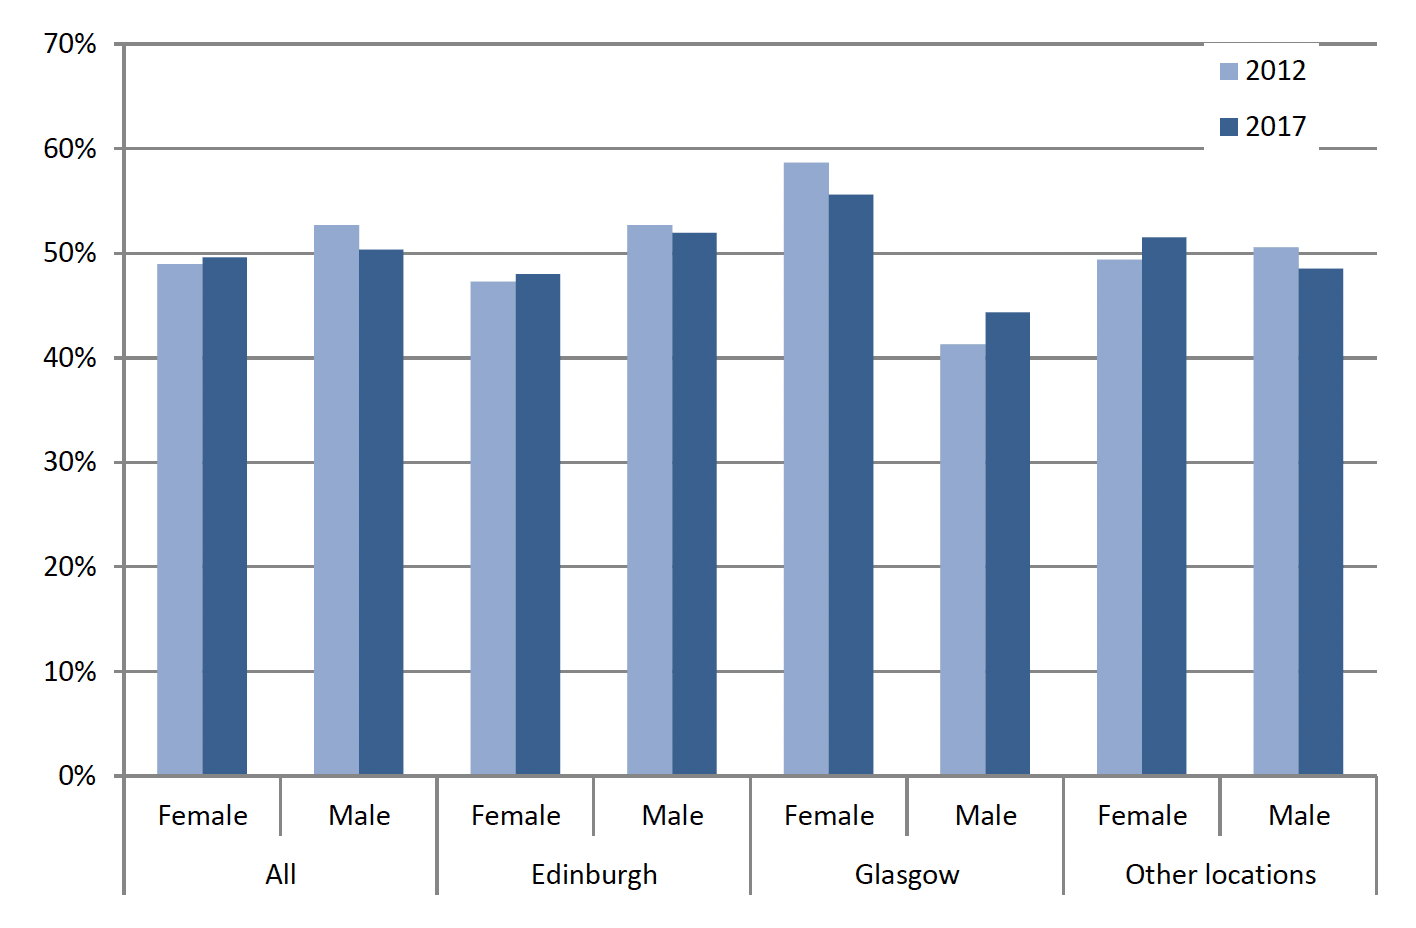
Figure 4 shows that overall there has been a slight increase in the proportion of the overall workforce that is female, and a reduction in the overall proportion which is male.
Working pattern
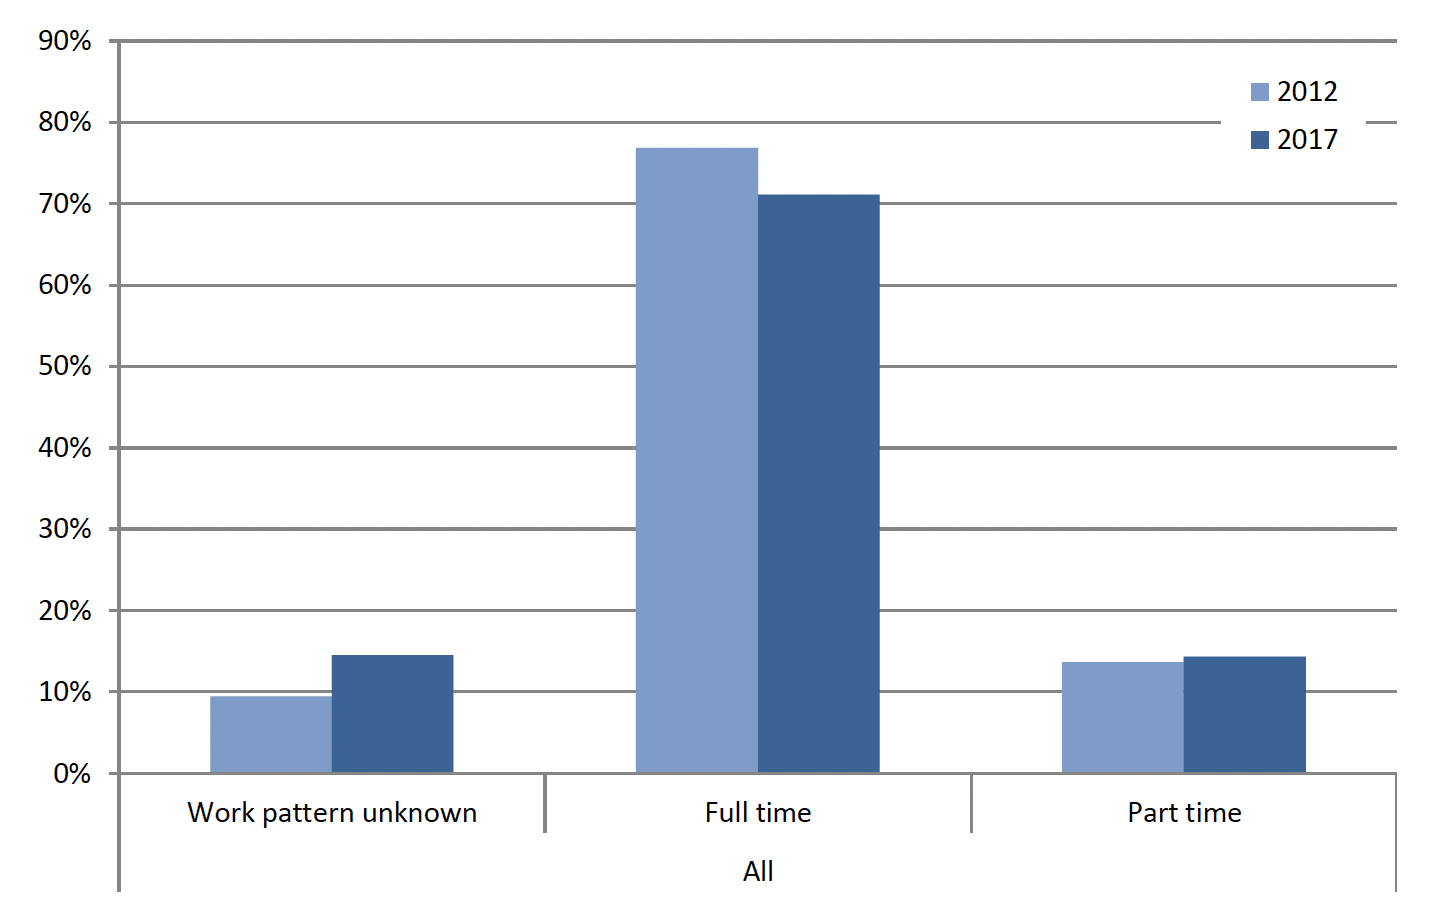
Although there has been some slight changes in working pattern, there are no significant differences from the ToW EQIA.
Sexual Orientation
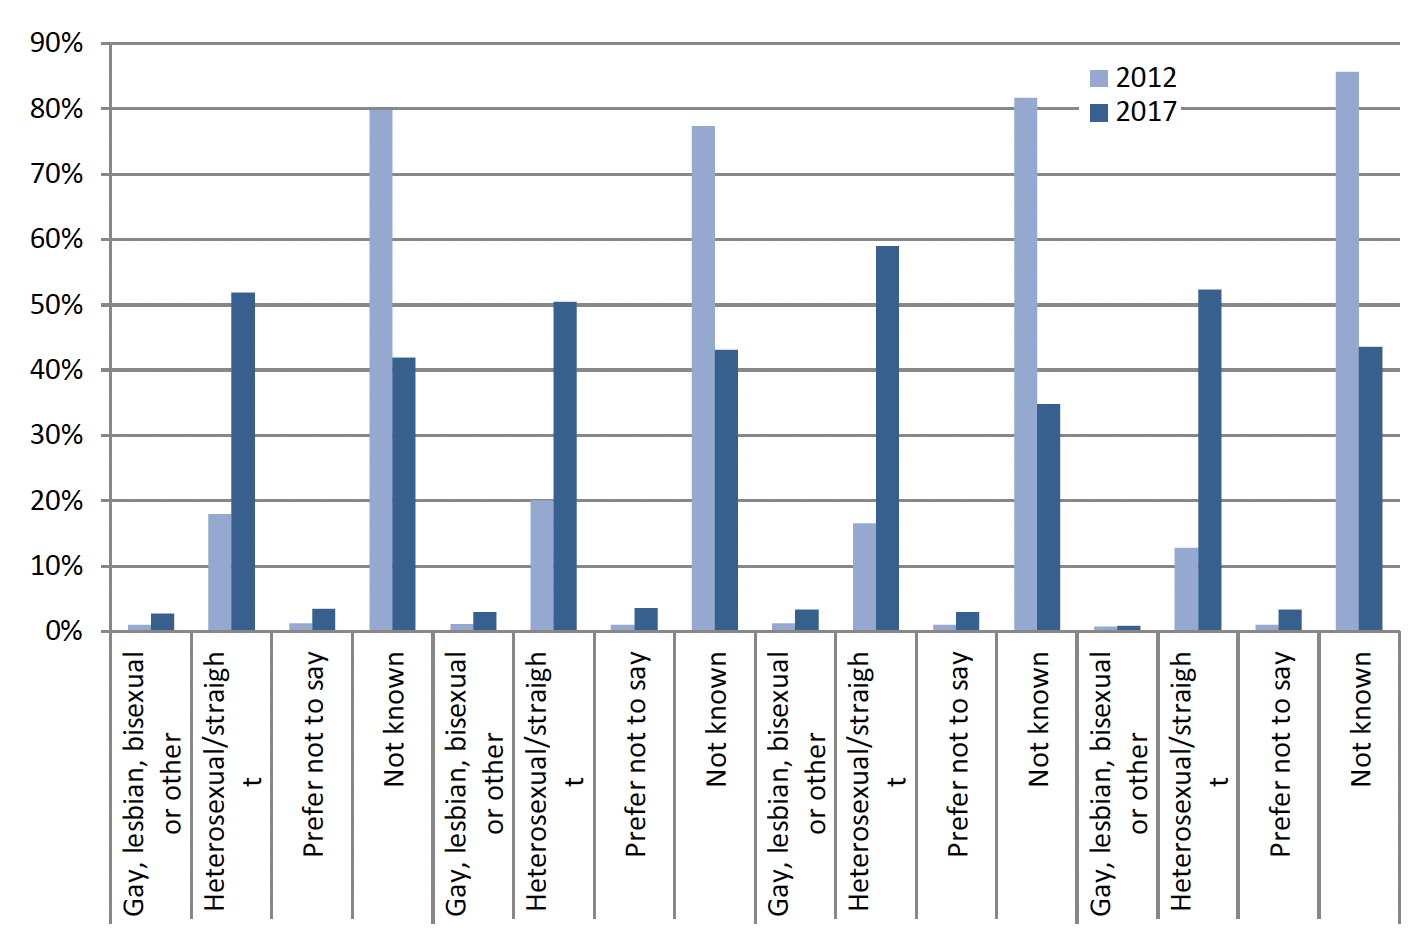
Note that the recording of sexual orientation has improved since 2012, therefore the data is not directly comparable.
Race
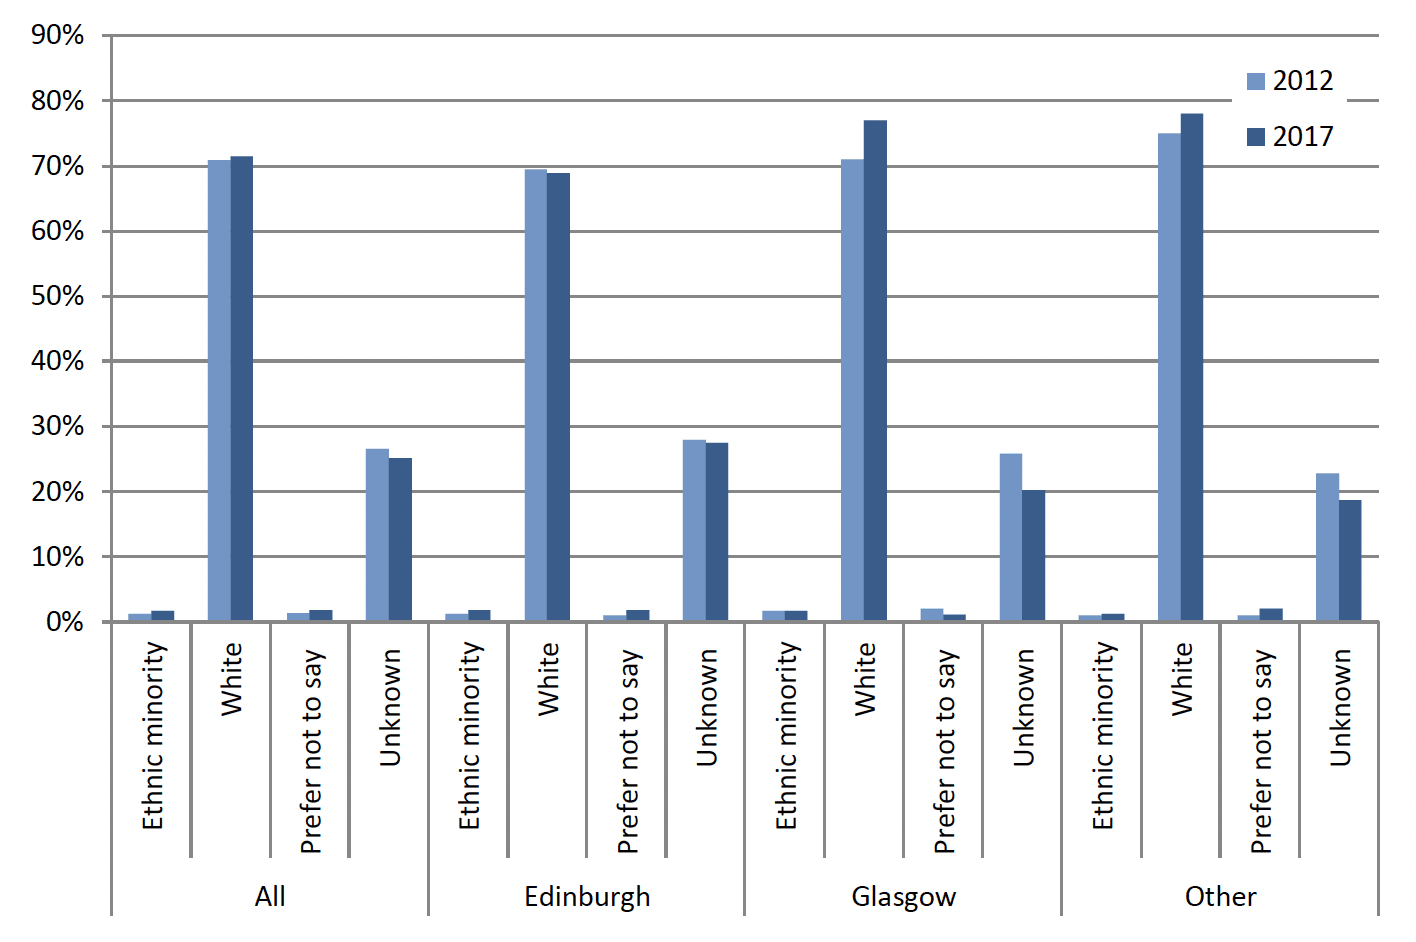
Although there have been some slight changes, there are no significant differences from the ToW EQIA.
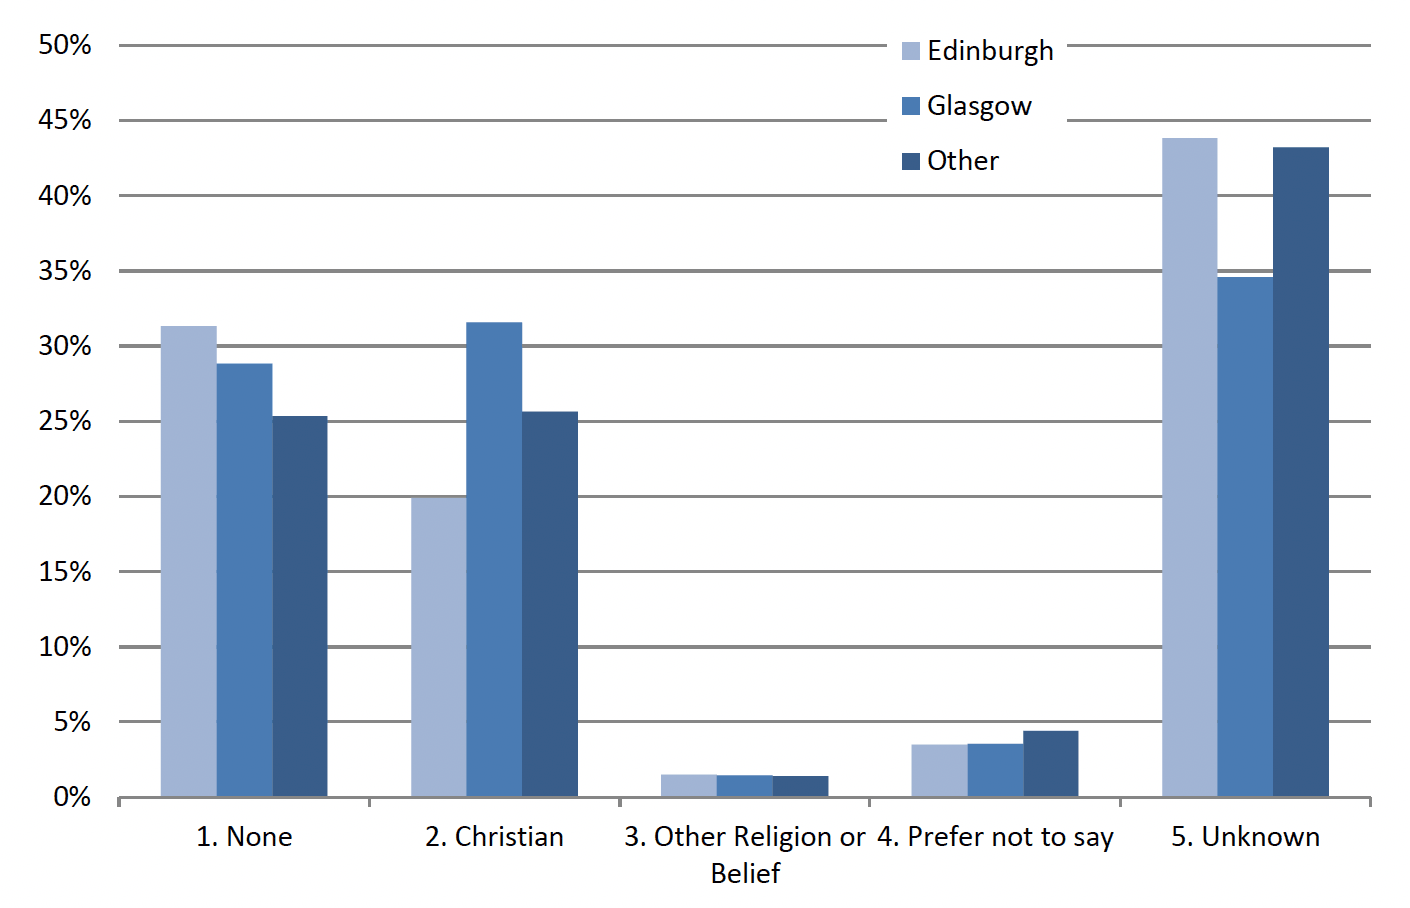
Religion
The data between 2012 and 2017 is not comparable but the distribution in 2017 is given in Figure 8.
Contact
Email: hannah.mcgaffin@gov.scot