Aquaculture - use and efficacy of Acoustic Deterrent Devices (ADDs): report
A report into Acoustic Deterrent Devices (ADDs) in the aquaculture sector to provide a better understanding of how they are being used, their efficacy and any potential for impact on sensitive non-target species. Records described the extent of ADD use in Scotland from 2014 to 2020.
4 Efficacy of ADDs and alternative measures in preventing seal depredation
4.1 Introduction
The data collated for this report were analysed to quantify any associations between ADD usage and depredation by seals (mortality of stocked fish, caused by the predatory behaviour of seals). This analysis examined the dataset for evidence of ADD efficacy and to investigate which factors might influence this. For a complete description of the data preparation and the methods used for this analysis, including technical detail on the modelling process, and more detailed results, please see the Appendix sections 1 and 2. A summary of the methods, key results and the outcomes of the analysis are provided in this section of the report.
4.1.1 Caveats on observational data
It should be noted that all data collated under this project are observational in nature, and not part of any controlled trials. The use of ADDs in this dataset is therefore not randomised or controlled. There is also an underlying assumption that ADD use is not associated with increased depredation. In practice this assumption is likely not to be the case due to the reactive nature of management decisions, but the strength of this association is not known. Additionally, the available data on ADDs was not systematically collected or standardised. The temporal scale of data on ADD use was relatively coarse (monthly), and may have excluded relevant detail relating to its impact on depredation.
No two finfish farm sites are the same and so drawing comparisons between data collected at a range of sites is problematic. The many factors, both biotic and abiotic, which might influence seal depredation are not well understood; the proximity to seal haul-outs, size of local seal populations as well as individual behaviour of seals may all have an impact. These factors could not be included here due to lack of suitable data.
Nevertheless, convincing arguments for causation can be derived from observational data (for example, observational data are often important in medical studies where experimental approaches would be unethical) (Rubin, 2007) and this dataset represents the best available information currently available describing the use and efficacy of ADDs in Scottish finfish aquaculture.
4.2 Methods
Records of ADD use from Scottish aquaculture sites from 2014 to 2020 (as described in section 3) were combined with additional variables available for each record, collected from the same data sources described in subsection 3.1.1. Data were available on: depredation rate (measures as number of fish mortalities), stocking dates, variables describing net shape and material, presence of seal blinds and anti-predator nets, biomass and whether or not ADD use was permitted.
The use of ADDs is not permitted at certain locations, depending on planning conditions defined by the local authority, and this information is often captured by the seal licensing system. This allowed a form of control in the dataset, by assuming that sites without permission to use ADDs are representative of all sites but without the effect of ADD use.
Research questions to inform the design of the analyses were initially defined to allow testing at a range of temporal scales, with three different temporal scales examined: monthly, per stocking period, and per depredation event. Data were available at a range of temporal scales but were collated to a minimum scale of monthly resolution for analysis. The temporal scale of monthly was the highest resolution for which a large enough dataset including the key variables of ADD status, ADD type and depredation, was available. Data were then grouped to the level of stocking period (the period over which a farm was stocked with fish). This allowed comparison of the longer-term efficacy of management measures. Analysis was also conducted at the scale of depredation event, defined as a set of successive months where a stocked farm was recorded as having been depredated by seals, with at least a one-month gap before and after where there was no depredation. This allowed comparison between the characteristics of depredation events, for example looking for changes in the frequency or length of depredation events in relation to ADD use.
Monthly
1. Is the monthly presence or absence of depredation at a finfish farm associated with ADD usage and does any association depend on ADD type?
2. Is the monthly level of depredation (i.e. number of fish killed by seals) at a finfish farm associated with ADD usage and does any association depend on ADD type?
Per stocking period
3. Are the number of depredation events during a stocking period at a finfish farm associated with ADD usage and does any association depend on ADD type?
4. Is the total level of depredation during a stocking period at a finfish farm associated with ADD usage and does any association depend on ADD type?
5. Is the proportion of months during which depredation events occur during a stocking period at a finfish farm associated with ADD usage and does any association depend on ADD type?
Per depredation event
6. Is the total level of depredation at a finfish farm associated with ADD usage and does any association depend on ADD type?
7. Is the duration of a depredation event at a finfish farm associated with ADD usage and does any association depend on ADD type?
Data were initially tabulated and each metric for ADD conditions was compared (ADD on vs ADD off, ADD type). This approach does not account for potentially confounding effects of additional explanatory variables such as farm, region, year, month and presence of other anti-predator devices. These dependencies were then accounted for in a statistical modelling approach using Generalized Additive Models (GAMs). GAMs were used to model relationships between the response and explanatory variables with separate models constructed for each of the seven questions listed above. The response variable for each question related to depredation occurrence or level of depredation observed, depending on the question. Two models were compared for each question: one using presence or absence of ADDs as a two-level factor covariate, the other using presence or absence of each type of ADD type as eight two-level factor covariates. For the first two questions, at the monthly level, an additional potential complication is that the presence or level of depredation may not be independent between months, even after the explanatory variables are modelled. Residual autocorrelation was therefore checked for, and if found this was accounted for in the modelling. Full details are given in the Appendix section 2.
4.3 Results
4.3.1 Exploratory analysis
4.3.1.1 Monthly
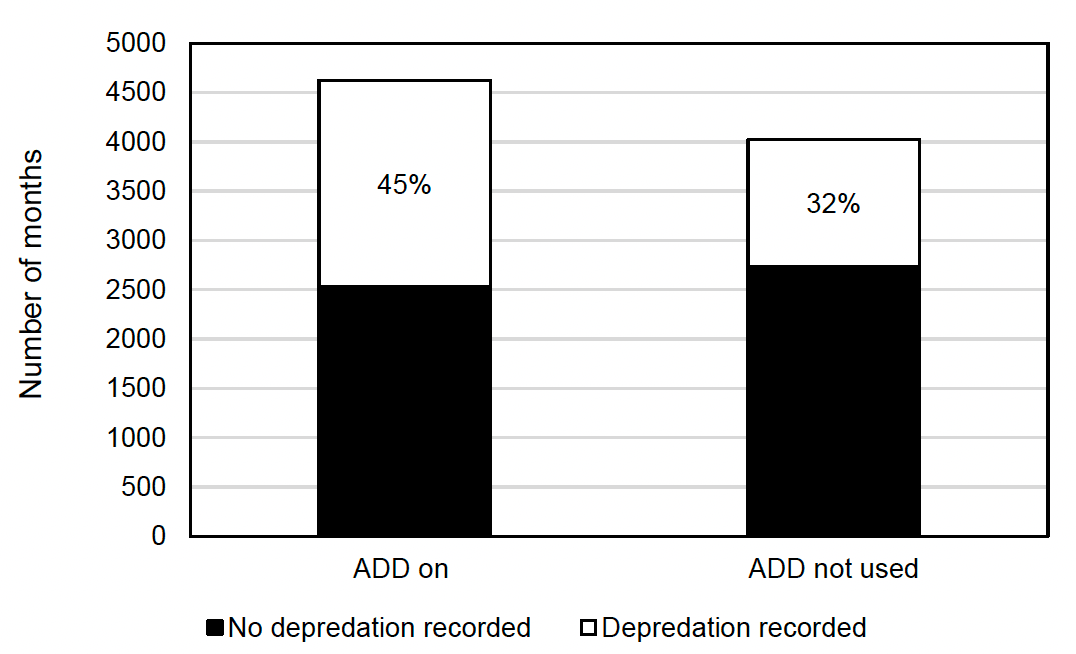
Of the 8,644 monthly records considered in the dataset, a total of 3,384 (39%) recorded depredation occurring. Across all months where ADDs were used (4,624), 45% of these recorded depredation (Figure 12) in contrast to 32% of the total months where ADDs were not used (4,020).
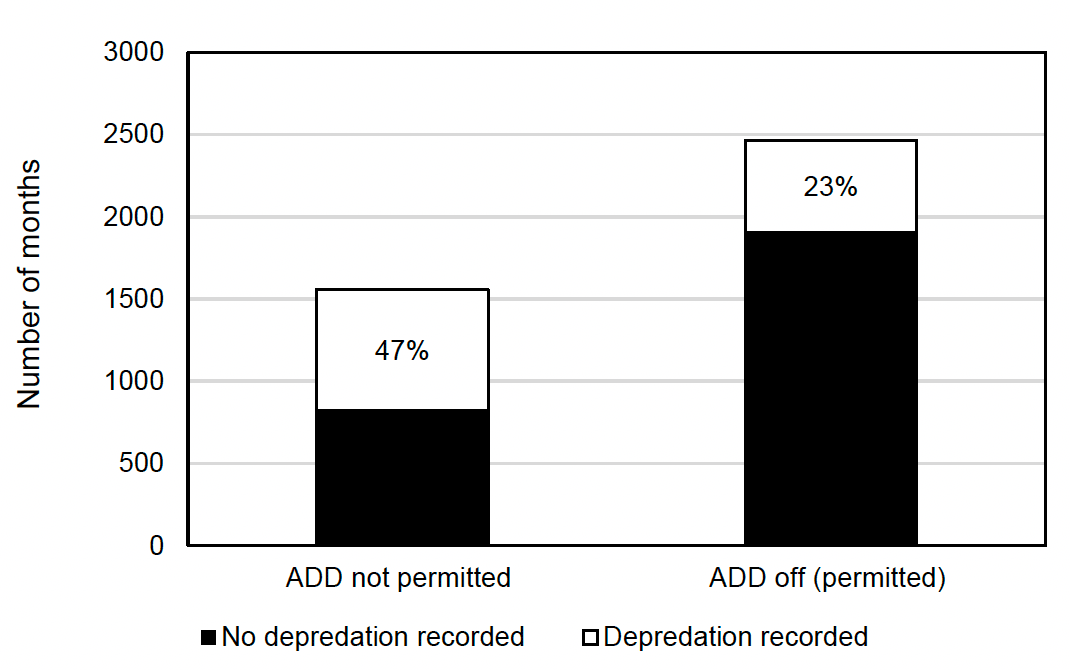
When considering sites where ADDs were not used (either because they were not permitted or a decision was made not to use them), we found the proportion of months with depredation was higher where ADD use was not permitted (47%) compared to when it was permitted but not used (23%) (Figure 13).
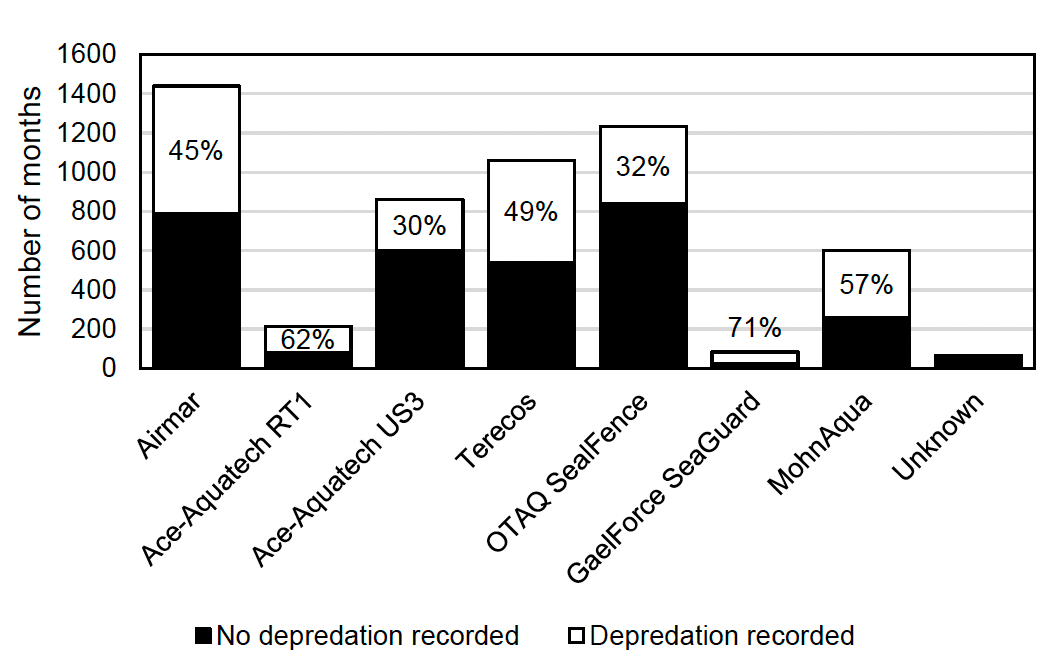
When ADDs were recorded as 'on,' the proportion of months recording depredation varied considerably depending on the ADD type in use (Figure 14). Proportions of months with depredation were lowest for Ace Aquatec US3 (30%) and highest for GaelForce (71%), although GaelForce had the lowest number of months in which it had been used.
The level of depredation in terms of numbers of fish lost was highly variable across months. Patterns of depredation levels in relation to ADD use and ADD type were similar to the monthly analysis of depredation events, with a higher mean level of mortality when ADDs were on relative to off and higher levels of depredation where ADDs were not permitted compared to where they were.
There was also variation in depredation levels between different ADD types, but patterns were different to those for depredation occurrence. Unknown ADD type was associated with the highest mean levels of depredation, followed by Ace Aquatec RT1. Lowest mean levels of depredation were associated with MohnAqua.
4.3.1.2 Per stocking period
Of the 509 stocking periods (from 179 farms) for which complete ADD usage was available, depredation was recorded in 361 (71%) of the periods. The length of stocking periods was highly variable, ranging from one to 42 months. The number of depredation events had an approximately linear increase with the duration of the stocking period. ADDs were typically either on or off for the whole stocking period, although there were some variations to this pattern.
The pattern of depredation in relation to ADD use is similar to the monthly exploratory analysis, with greater occurrence of depredation in stocking periods where ADDs were used at least 90% of the time (48%) compared to stocking periods where ADDs were not used (36%). Stocking periods where ADD use was not permitted were more likely to experience depredation, with 54% recording depredation. Trends in the number of depredation events (as discrete events) and the level of depredation (in terms of numbers of fish lost) followed the same pattern, with higher levels and likelihood of depredation associated with ADD use.
As described in section 3.3.5, some sites use multiple types of ADD. To examine the effect of ADD type at the level of the stocking period, only stocking periods that used a single device for more than 90% of the time across the stocking period were included. This led to variable sample sizes with only four ADD types being used for a large enough number of stocking periods to draw statistical conclusions (Airmar, Ace Aquatec US3, Terecos and OTAQ). Across these four ADD types, Terecos was associated with the highest number of depredation events, levels of depredation and percentage of stocking periods where depredation occurred.
4.3.1.3 Per depredation event
There were a total of 803 depredation events (from 438 stocking periods and 179 farms) where complete ADD usage information was available. Depredation events ranged in length from 1 to 24 months with a mean of 4.2. The most common length of a depredation event was 1 month (269 or 33%), followed by 2 months (133 or 17%).
As was the case at the level of the stocking period, there was an increase in the level of depredation as the length of the depredation event increased. The patterns of depredation in relation to ADD use and type was found to be similar to the monthly and stocking period results with higher depredation associated with events where ADDs were on compared with off, higher depredation when ADDs were not permitted (for the whole depredation event) compared with when ADDs were permitted but not used, and variation among ADD types in the amount of depredation recorded.
4.3.2 Statistical modelling
4.3.2.1 Monthly analysis
Q1: Is the monthly presence or absence of depredation at a finfish farm associated with ADD usage and does any association depend on ADD type?
Statistical models were developed with the response variable being the presence/absence of depredation per month. Initial modelling indicated auto-correlation so subsequent models accounted for this. For details of the model type and structure, and model selection process, see Appendix section 2.2.
Significant explanatory variables (based on a model co-efficient having a p value of ≤ 0.05) along with the direction of their influence on the probability of depredation, are detailed in Table 8.
| Variable | Effect on the probability of depredation presence | Significance |
|---|---|---|
| ADD on | Positive | *** |
| Region – Orkney | Higher than baseline region of Highland | ** |
| Region – Western Isles | Lower than baseline region of Highland | ** |
| Use of square net | Positive | * |
| Use of APN | Positive | *** |
| Use of seal blind | Positive | * |
| Month | Higher in winter than in summer | *** |
| Biomass | Positive | *** |
| Length of stocking period | Positive | *** |
| Farm ID | Normally distributed random effect (logit scale) | *** |
Although not preferred by the model selection criterion, there was variation in the probability of depredation associated with different ADD types.
ADD usage was associated with increased probability of depredation at the monthly level, increasing the odds of depredation by a factor of 2.2 once other variables had been accounted for. The effect of ADD type was also tested, and there was some evidence that the magnitude of the effect varied by ADD type. The model including different device types as factor covariates indicated significant effects of individual ADD types but the model selection process did not prefer this model over the model with ADD on or off as the factor covariate.
Q2: Is the monthly level of depredation (i.e. number of fish killed by seals) at a finfish farm associated with ADD usage and does any association depend on ADD type?
Models were developed with the depredation level in terms of the total number of fish depredated at a site in a month as the response variable. Initial modelling indicated auto-correlation so subsequent models accounted for this. For details of the model type and structure, and model selection process, see Appendix section 2.2.1.
Significant explanatory variables (based on a model co-efficient having a p value of ≤ 0.05) along with the direction of their influence on the levels of depredation, are detailed in Table 9.
| Variable | Effect on the levels of depredation | Significance |
|---|---|---|
| ADD on | Positive | *** |
| ADD not permitted | Positive | * |
| Region – Orkney | Higher than baseline region of Highland | ** |
| Year - 2015 | Lower than baseline year of 2014 | * |
| Year - 2017 | Lower than baseline year of 2014 | * |
| Year - 2019 | Lower than baseline year of 2014 | * |
| Use of APN | Positive | *** |
| Use of seal blind | Positive | *** |
| Month | Higher in winter than in summer | *** |
| Biomass | Positive | *** |
| Length of stocking period | Positive | *** |
| Farm ID | Non-normally distributed random effect (logit scale) | *** |
The number of fish depredated per month was estimated to be 2.6 times greater when ADDs were on versus when ADDs were off. The model with ADD types as individual factor covariates (Table 10) showed a positive association between depredation level and ADD on for all ADD types, although only Terecos and OTAQ were statistically significant, with depredation level being 2.9 times higher with Terecos and 4.1 times higher with OTAQ.
The overall conclusion from this analysis is that ADD usage is associated with increased monthly level of depredation (2.6 times higher with ADD on versus off) once other available variables were accounted for, and that there is evidence that this varied significantly by ADD type.
| Variable | Effect on the levels of depredation | Significance |
|---|---|---|
| ADD on = Terecos | Positive | *** |
| ADD on = OTAQ SealFence | Positive | *** |
| ADD not permitted | Positive | * |
| Region = Orkney | Higher than baseline region of Highland | ** |
| Year = 2015 | Lower than baseline year of 2014 | * |
| Year = 2016 | Lower than baseline year of 2014 | * |
| Year = 2017 | Lower than baseline year of 2014 | ** |
| Year = 2019 | Lower than baseline year of 2014 | * |
| Use of APN | Positive | *** |
| Use of seal blind | Positive | *** |
| Month | Higher in winter than in summer | *** |
| Biomass | Positive | *** |
| Length of stocking period | Positive | *** |
| Farm ID | Non-normally distributed random effect | *** |
Table 10 Variables which the indicated a significant effect on the levels of depredation occurring within monthly periods. ADD usage modelled as individual factor covariates for each ADD type. Significance codes relate to the following P value categories: *** <0.001, ** <0.01, * <0.05.
4.3.2.2 Per stocking period
Q3: Are the number of depredation events during a stocking period at a finfish farm associated with ADD usage and does any association depend on ADD type?
Models were developed with the number of depredation events per stocking period as the response variable. For details of model type and structure, and model selection process, see Appendix section 2.2.2.
Significant explanatory variables (based on a model co-efficient having a p value of ≤0.05) along with the direction of their influence on the number of depredation events, are detailed in Table 11.
| Variable | Effect on the number of depredation events per stocking period | Significance |
|---|---|---|
| ADD on = Ace Aquatec RT1 | Positive | ** |
| ADD on = Terecos | Positive | ** |
| ADD on = MohnAqua | Positive | *** |
| ADD not permitted | Positive | * |
| Region = Orkney | Higher than baseline region of Highland | ** |
| Year that stocking started = 2015 | Lower than baseline year of 2014 | * |
| Use of square nets | Positive | ** |
| Length of stocking period | Positive | * |
Table 11 Variables which modelling indicated a significant effect on the number of depredation events per stocking period. ADD usage modelled as individual factor covariates for each ADD type. Significance codes relate to the following P value categories: *** <0.001, ** <0.01, * <0.05.
The number of depredation events per stocking period was estimated to be 1.5 times greater when ADDs were on versus when off. This effect was stronger for individual ADD types, with MohnAqua being associated with 2.1 times higher predation events when it was on compared to when it was off.
The overall conclusion from this analysis is that ADD usage is associated with an increased number of depredation events once other available variables were accounted for, and that there is strong evidence that this varied significantly by ADD type. The number of depredation events is also positively associated with the use of square nets.
Q4: Is the total level of depredation during a stocking period at a finfish farm associated with ADD usage and does any association depend on ADD type?
Models were developed with the response variable being the total level of depredation per stocking period. For details of model type and structure, and model selection process, see Appendix section 2.2.2.
The results and conclusions from this model are very similar to Q3 so the details are not displayed here (but can be found in Appendix section 2.2.2), The overall conclusion is that ADD usage is associated with an increased level of depredation per stocking period (4 times higher when ADDs on for the whole stocking period) once other variables were accounted for, and that there is good evidence that this varied by ADD type.
Q5: Is the proportion of months during which depredation events occur during a stocking period at a finfish farm associated with ADD usage and does any association depend on ADD type?
A model was developed with the number of months within a stocking period in which depredation was recorded as the response variable. For details of the model type and structure, and model selection process, see Appendix section 2.2.2.
The conclusions from this model are very similar to Q3 and Q4 so the details are not displayed here (but can be found in the Appendix section 2.2.2). The overall conclusion regarding this question is that ADD usage is associated with an increased proportion of months with depredation per stocking period (odds of predation 4.6 times higher when ADDs are on for the whole period) once other variables were accounted for, and that there is good evidence that this varied by ADD type.
4.3.2.3 Per depredation event
Q6: Is the total level of depredation at a finfish farm associated with ADD usage and does any association depend on ADD type?
A model was developed with the number of fish depredated by seals per depredation event as the response variable. For details of the model type and structure, and model selection process, see Appendix section 2.2.3.
Significant explanatory variables (based on a model co-efficient having a p value of ≤0.05) along with the direction of their influence on the number of depredation events, are detailed in Table 12.
| Variable | Effect on the number of fish per depredation event | Significance |
|---|---|---|
| ADD on = GaelForce | Negative | * |
| Region – Argyll and Bute | Lower than baseline region of Highland | * |
| Region – Western Isles | Higher than baseline region of Highland | ** |
| Year - 2015 | Lower than baseline year of 2014 | * |
| Year - 2017 | Lower than baseline year of 2014 | ** |
| Year - 2018 | Lower than baseline year of 2014 | ** |
| Year - 2019 | Lower than baseline year of 2014 | *** |
| Length of depredation event | Positive | *** |
Table 12 Variables which modelling indicated a significant effect on the number of fish depredated per depredation event. ADD usage modelled as individual factor covariates for each ADD type. Significance codes relate to the following P value categories: *** <0.001, ** <0.01, * <0.05.
The model with ADD use as a single covariate did not indicate a significant effect of ADD use on the number of fish affected per depredation event. The overall conclusion is that overall, there is no statistically significant association between ADD use and depredation level per depredation event. There is a negative association between the use of the GaelForce and the number of fish depredated, although this ADD was in use during only 14 depredation events.
Q7: Is the duration of a depredation event at a finfish farm associated with ADD usage and does any association depend on ADD type?
Models were developed with the duration of the depredation event in months as the response variable. For details of the model type and structure, and model selection process, see Appendix section 2.2.3.
Significant explanatory variables (based on a model co-efficient having a p value of ≤0.05) along with the direction of their influence on the number of depredation events, are detailed in Table 13.
| Variable | Effect on the duration of depredation event | Significance |
|---|---|---|
| ADD on = Airmar | Positive | ** |
| ADD on = Ace Aquatec RT1 | Positive | * |
| ADD on = Terecos | Positive | ** |
| ADD on = OTAQ SealFence | Positive | *** |
| ADD on = Unknown | Positive | *** |
| ADD not permitted | Positive | * |
| Region – Shetland | Lower than baseline region of Highland | * |
| Region – Western Isles | Lower than baseline region of Highland | *** |
| Year - 2015 | Lower than baseline year of 2014 | ** |
| Year - 2017 | Lower than baseline year of 2014 | * |
| Year - 2018 | Lower than baseline year of 2014 | ** |
| Year - 2019 | Lower than baseline year of 2014 | *** |
| Use of seal blind | Negative | * |
| Month | Longer in summer | *** |
| Stocking biomass | Positive | *** |
Table 13 Variables which modelling indicated a significant effect on the duration of the depredation event in months. ADD usage modelled as individual factor covariates for each ADD type. Significance codes relate to the following P value categories: *** <0.001, ** <0.01, * <0.05.
The overall conclusion is that ADD usage is associated with slightly longer depredation events. Depredation events where ADDs were on were estimated to be 1.3 times longer than those with ADDs off. This trend is the case for most ADD types but there is variation among types.
The length of depredation events is also positively associated with month (summer months having longer events), and with biomass on site. The use of seal blinds is negatively associated with the duration of depredation events.
4.4 Summary
A collated set of observational data from a variety of sources (section 3.1.1) was analysed to quantify any association between ADD use and depredation by seals.
A consistent finding of this analysis was that ADD use is associated with higher levels of predation, regardless of the temporal scale of the analysis (monthly, per stocking period and per depredation event). This association was evident even when available potential explanatory covariates were accounted for. However, this should not be over interpreted as the relationship between higher levels of depredation and ADD use could be caused by ADDs being more likely to be used where there is an identified depredation problem. The available data were not sufficient to not validate or eliminate this possibility. What is clear from the available data is that ADD use does not eliminate the problem of depredation. How much ADD use may have reduced depredation relative to what it would have been at those sites without the ADD operating, is unknown.
There are indications of variation in the relationships between ADD use and depredation occurrence between ADD type. Ace Aquatec RT1, GaelForce and 'Unknown ADD type' were used relatively few times (214, 85 and 122 months respectively; 8, 5 and 7 stocking periods), and so the sample size is too small to draw any inference. All other ADD categories were significantly positively associated with seal depredation at various magnitudes, depending on the question and modelling approach used. However, this result should not be taken as evidence that certain devices are 'more effective' than others due to the inability of this analysis to provide causal evidence between ADD use and depredation occurrence (there are differences between sites and specific details of usage which could not been accounted for in this analysis). Other factors unaccounted for in this analysis and unrelated to device effectiveness could drive any association between device type and higher occurrence of predation.
This analysis has demonstrated that seal depredation was reported in 39% of the monthly periods in the dataset, and in 71% of all stocking periods. Use of ADDs was common, with ADD use reported in 53% of the recorded monthly periods.
If it were possible to show sites where ADD use is restricted were representative of baseline levels of depredation for all farms, then the effectiveness of the overall strategy employed by finfish farmers could be quantified. When ADDs were restricted, depredation occurred in 47% of months; where ADD use was not restricted depredation occurred in 37% of months. However, this observed reduction could be due to differences in anti-predator measures being installed at sites where depredation is, and is not, expected.
Where the use of anti-predator nets, seal blinds or square nets had any significant associations with the occurrence of seal depredation, these tended to be positive. This should be interpreted in the same way as results on ADD usage: anti-predator measures may be more likely to be adopted where there is a problem or there is anticipated to be a problem. The exception to this was where the presence of seal blinds was associated with a reduced duration of depredation event.
However, it is important to note that there are a number of caveats that must be considered when interpreting the results of this section. The analysis used a collated set of observational data from a variety of sources. Therefore, the data collection was not designed to explicitly test hypotheses about the efficacy of ADDs and was not designed as to be able to reliably determine causality of variation in the levels of seal depredation. Instead, to develop a robust understanding of how ADD use influences seal depredation, specifically designed, randomised, replicated, control/treatment trials would be required.
Whilst the analytical techniques employed were designed to account for the confounding effects of multiple covariates on the resulting relationships between ADD use and variation in depredation activity, there were a number of additional extrinsic and intrinsic factors that were not known and were therefore unable to be included. These include elements such as site-specific differences in the size of farms, number of cages, locations, proximity to seal haul outs, local density of seals, differences in local species composition and differences in depredation behaviour between seal species and individuals, history of depredation issues and history of the control measures installed at each site.
In addition, the temporal resolution of the data on depredation was not available at a very fine temporal scale (monthly). There could be patterns at a daily or weekly level that would not be evident from this dataset. Depredation by seals is likely to vary considerably throughout a month, and this variation will be missed by such coarse data.
Further implications of these findings, and the recommendations for research to further determine ADD efficacy are provided in section 6.2 and 5.4 respectively.
Contact
Email: marine_conservation@gov.scot