Aquaculture - use and efficacy of Acoustic Deterrent Devices (ADDs): report
A report into Acoustic Deterrent Devices (ADDs) in the aquaculture sector to provide a better understanding of how they are being used, their efficacy and any potential for impact on sensitive non-target species. Records described the extent of ADD use in Scotland from 2014 to 2020.
3 Extent of ADDs in Scottish Aquaculture
3.1 Description of the collated information on ADDs
One aim of this project was the collation of information on ADDs to provide the most comprehensive and accurate description possible of their extent in Scottish finfish aquaculture. This involved the collation of records from disparate and unsystematic data sources which presented significant challenges.
Available data sources were examined for suitability (i.e. Marine Scotland's Seal Licensing survey and RSPCA Assured's records). This process highlighted some questions regarding the quality and completeness of the information, which are explained below for each data source. Efforts were then made to address these questions and improve the quality of the data by accessing additional data sources. Industry-held data were important to this process, which involved continued liaison with finfish producers and ADD manufacturers, with the assistance of the Scottish Salmon Producers Organisation. Available data sources covered different periods of time and some overlapped. The aim was to verify existing records where possible and identify missing or inaccurate data records wherever necessary, in order to build the most comprehensive dataset possible, with a primary focus on attaining the most up-to-date information possible. Where available, data was also collected that could be used to assess the efficacy of different management measures.
The resulting dataset therefore collates data from various sources with different temporal scales of resolution, covering different but overlapping spatial and temporal extents, and including different variables. Wherever possible matching variables have been combined to produce a semi-continuous time-series for each finfish farm. Where data sources contradicted one another, an order of precedence was adopted by which one data source was assumed to be more accurate than the other[3]. Finfish producer records were taken as the most accurate as they were supplied directly for this purpose and were the most up-to-date information available.
Information collected could not be independently verified and it is therefore possible that inaccuracies remain in the collated dataset, but in the absence of a comprehensive systematic data source, the approach taken for this project was the most practical one available. Despite the limitations of the available data, it provides the best possible description of recent industry practices, and the data are still considered suitable for the identification of broad patterns in ADD use over time and between regions.
3.1.1 Data sources
The primary focus of the data collection was to obtain information on the extent of ADD use within the aquaculture sector.
Where possible, data relating to the use of alternative anti-predator measures was also collected from the same data sources in order to inform the analysis of efficacy of different methods (section 4). Information was collected on: net shape and materials, lethal removal of seals, anti-predator nets (secondary layer of netting, usually larger mesh, hung outside of the primary fish net to provide a secondary barrier against predators) and seal-blinds (additional layers of netting attached to the base of nets around the 'mort-sock').
A list of all actively producing finfish farms taken from the Scottish Government data portal (Scotland's Aquaculture, 2020) was used as a reference for the true number of operating sites (216 sites in January 2020). This project only considered sites producing finfish in seawater, with shellfish and freshwater farms excluded from any assessment.
Data obtained from the following data sources have been collated into one dataset, covering the period from October 2014 to July 2020.
3.1.1.1 Seal licensing survey
Information was collected annually through the seal licensing scheme from all sites that applied to Marine Scotland for licences to kill or take seals. The purpose of the survey was to evidence that all suitable non-lethal measures were employed before a licence was granted. This process also provided information on the reported extent of ADD use, including ADD type, number of transducers, monthly seal depredation rate, as well as some information on the use of alternative measures: anti-predator nets, seal blinds and weighting systems. Records also indicated whether or not the ADD was in use during each month.
Almost all actively producing finfish farm sites are contained in this dataset, but the completeness of the ADD information provided varied greatly between sites and producers, leaving omissions relating to the use of ADDs over certain time periods. This information is provided directly from producers, but as ADD usage was not the focus of this data collection, accuracy or completeness was not verified during collection. ADD use may not necessarily have been reported fully or consistently between years and sites.
Seal licensing information has been collected annually since 2014 and was available for each month over the period October 2014 to October 2019.
These records represent a consistent source of information over the period of interest. However, there is no longer a requirement to collect information for this purpose due to changes to the Marine (Scotland) Act 2010. This survey collects retrospective data annually, and the final survey was conducted in October 2019.
3.1.1.2 Accreditation schemes
A number of accreditation schemes are active in Scotland, or have been in the recent past, including but not exclusively: Whole Foods, Aquaculture Stewardship Council, Friends of the Sea, Label Rouge, Best Aquaculture Practice (Global Aquaculture Alliance), as well as organic schemes such as the Soil Association. Where contact information could be obtained, these schemes were contacted to request data relating to anti-predator measures, with a response received from the RSPCA scheme, 'RSPCA Assured'. The extent of information on anti-predator measures held by other schemes is not known.
Records provided by RSPCA Assured are collected annually through site audits, with additional supplementary information being collected periodically. Records included information on ADD types on site, as well as some data on alternative anti-predator measures (e.g. anti-predator nets, net shape, and net material). Information was obtained for the period January 2014 to July 2020 and the data collected during each audit was assumed to be valid for the following year or until the subsequent audit. These records cover 68% of the actively producing finfish farm sites, with missing data occurring where audit information was incomplete and where companies were not enlisted to the scheme.
3.1.1.3 ADD manufacturers
The manufacturers of all commercially available ADDs were contacted for information on the extent of use of their devices. Data were provided by OTAQ and Ace Aquatec, relating to 32 active sites (15% of all active finfish farms).
Data on the use of ADDs were provided either on a weekly schedule for each site, or as a snapshot of the most up-to-date information relating to what was in use at a particular site. The number of devices installed at each site were also provided. Information supplied covered the period March 2018 to November 2019. Records were assumed to be valid for the year following unless otherwise stated or records provided by finfish producers were in contradiction.
3.1.1.4 Finfish producers
All major finfish producing companies operating in Scotland were contacted with a request for accurate information on use of anti-predator measures, with a focus on ADDs. Requests were made for information focused on ADD type, location and use, with additional supplementary data requested on alternative management measures wherever possible, and any available historic records with evidence on the efficacy of ADDs. Responses were received from all producers contacted, but the extent and resolution of information received varied greatly. Follow-up dialogue was then used, focusing on verifying and, where necessary, correcting information supplied from other sources.
Information was supplied on the types of ADDs installed at time of the request and, in the case of one company, rates of seal predation. A small amount of additional supplementary data relating to other management measures such as net materials was also provided, but data on ADD status (on/off) over time were not provided. Information on ADD installation covered the period March to July 2020. Seal depredation data supplied by one finfish producer covered the period January 2016 to November 2019.
3.1.2 Proportion of stocked time with available data
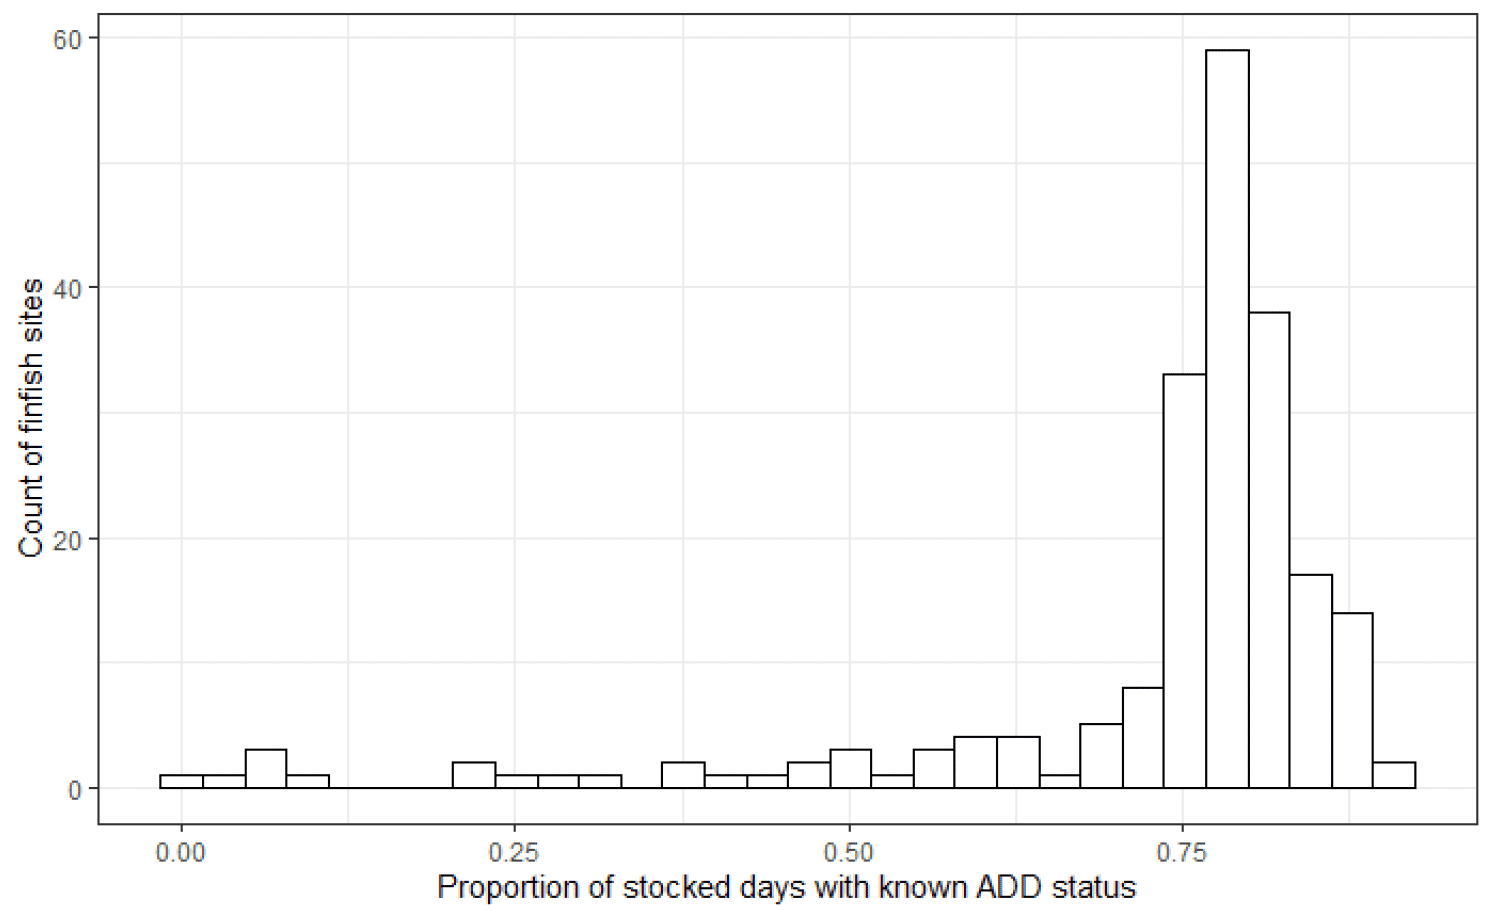
To assess the completeness of the dataset over time, the number of days each site was stocked with fish was compared against the number of days for which records of ADD use were obtained. Figure 2 shows that for most sites, ADD use information was available for at least 75% of stocked days.
Stocking dates were collated from two sources: the Scottish Government website records of biomass (owned by the Scottish Environment Protection Agency), and the seal licensing dataset. Neither dataset alone was found to contain a complete set of stocking dates, but by combining the two we have the best available record of stocking dates. Different farm identification systems are used for each of these datasets, so they were combined by matching unique farm identification records, such as site name and geographic coordinates.
3.2 Most recent extent of ADDs at finfish farms
A primary aim of this project was the collection of up-to-date information to describe the most recent use of ADDs. However, the use of ADDs is dynamic and has changed over time, including over the time span of this project. Records collated through this project could be considered as 'points in time', i.e. only valid for the date of collection, but data collection did not occur all at one point; it was ongoing through the length of the study. In order to present an overall picture of ADDs, we therefore needed to define a time window within which to describe their extent and use.
The time window for which we have the most complete dataset on ADDs is the winter of 2019 – 2020 (October 2019 to April 2020). This time period includes the very end of the seal licensing survey dataset, along with additional information from ADD manufacturers, finfish producers, and RSPCA Assured. By defining this time period we can describe an overall picture of ADD extent as a snapshot in time, using all available data sources. A total of 193 finfish farms are included, representing 89.4% of the 216 operating farms over the same time period.
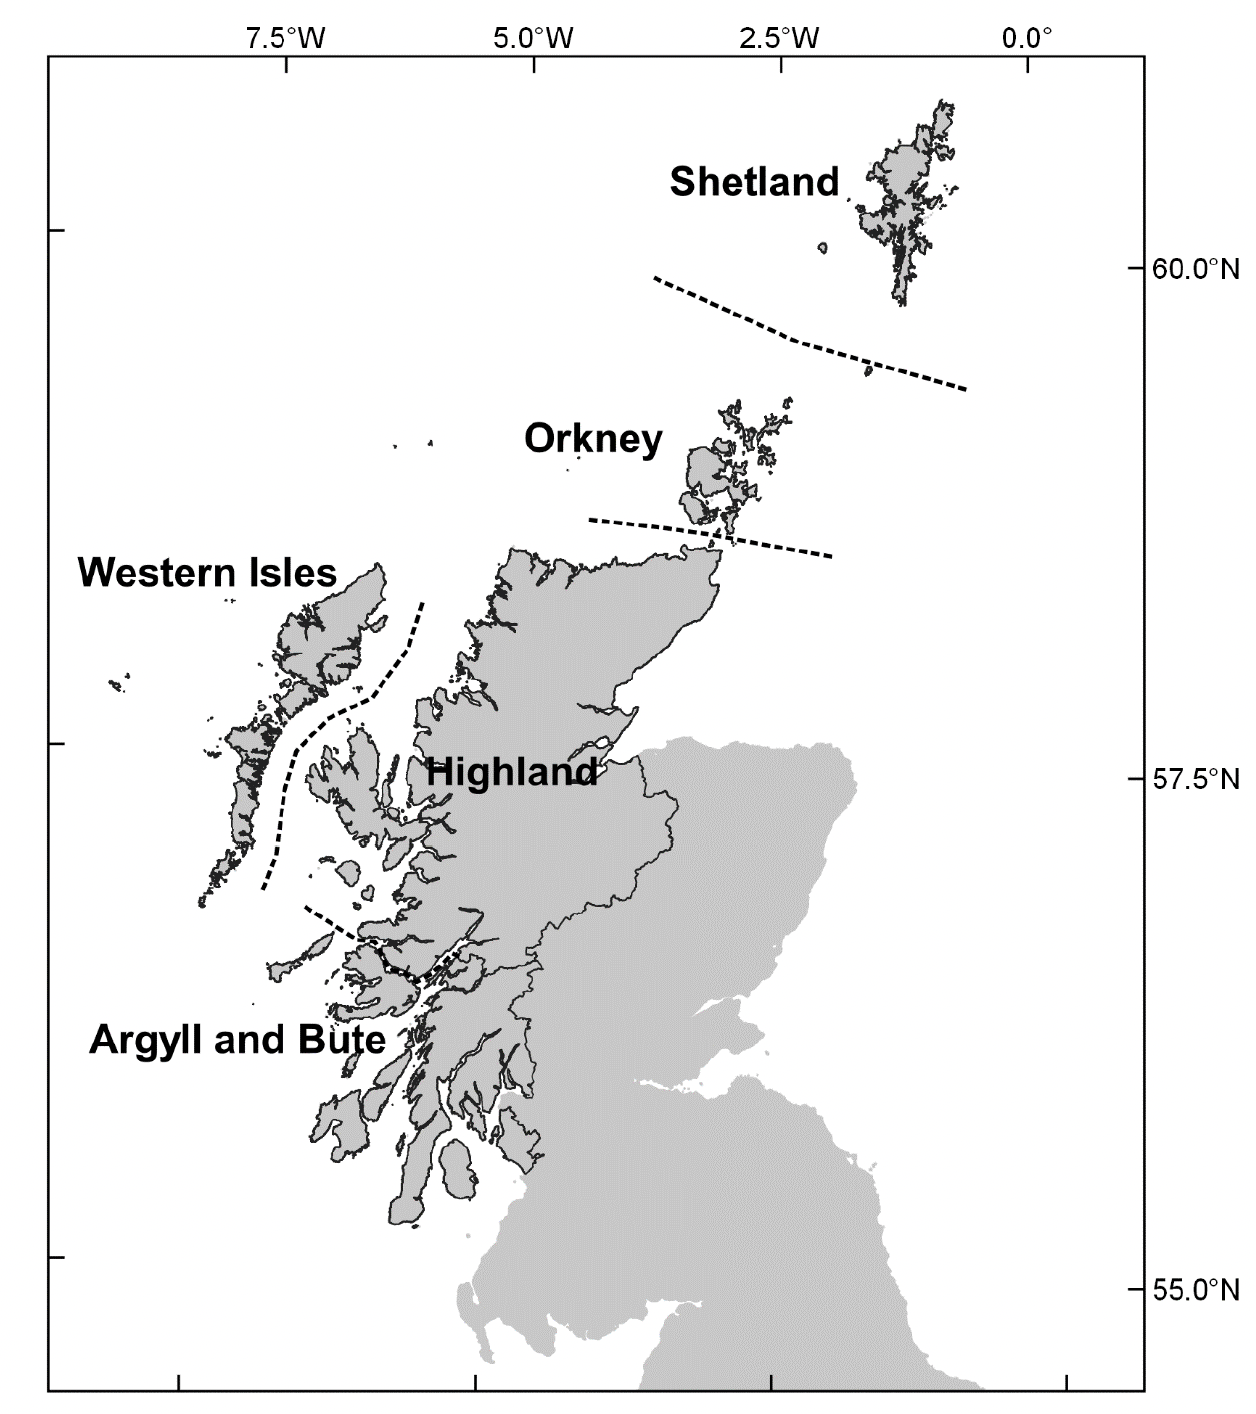
Finfish sites have been categorised into regional groups according to their local authority area (see Figure 3). This level of categorisation was chosen in order to provide insight into geographic variation. Finfish sites in the Firth of Clyde around Arran are included in Argyll and Bute.
| Regions | ADD Installed | Sample size | % with ADD | |
|---|---|---|---|---|
| Yes | No | |||
| Highland | 45 | 8 | 53 | 85% |
| Orkney | 8 | 15 | 23 | 35% |
| Shetland | 15 | 27 | 42 | 36% |
| Argyll and Bute | 32 | 8 | 40 | 80% |
| Western Isles | 32 | 3 | 35 | 91% |
| Grand Total | 132 | 61 | 193 | 68% |
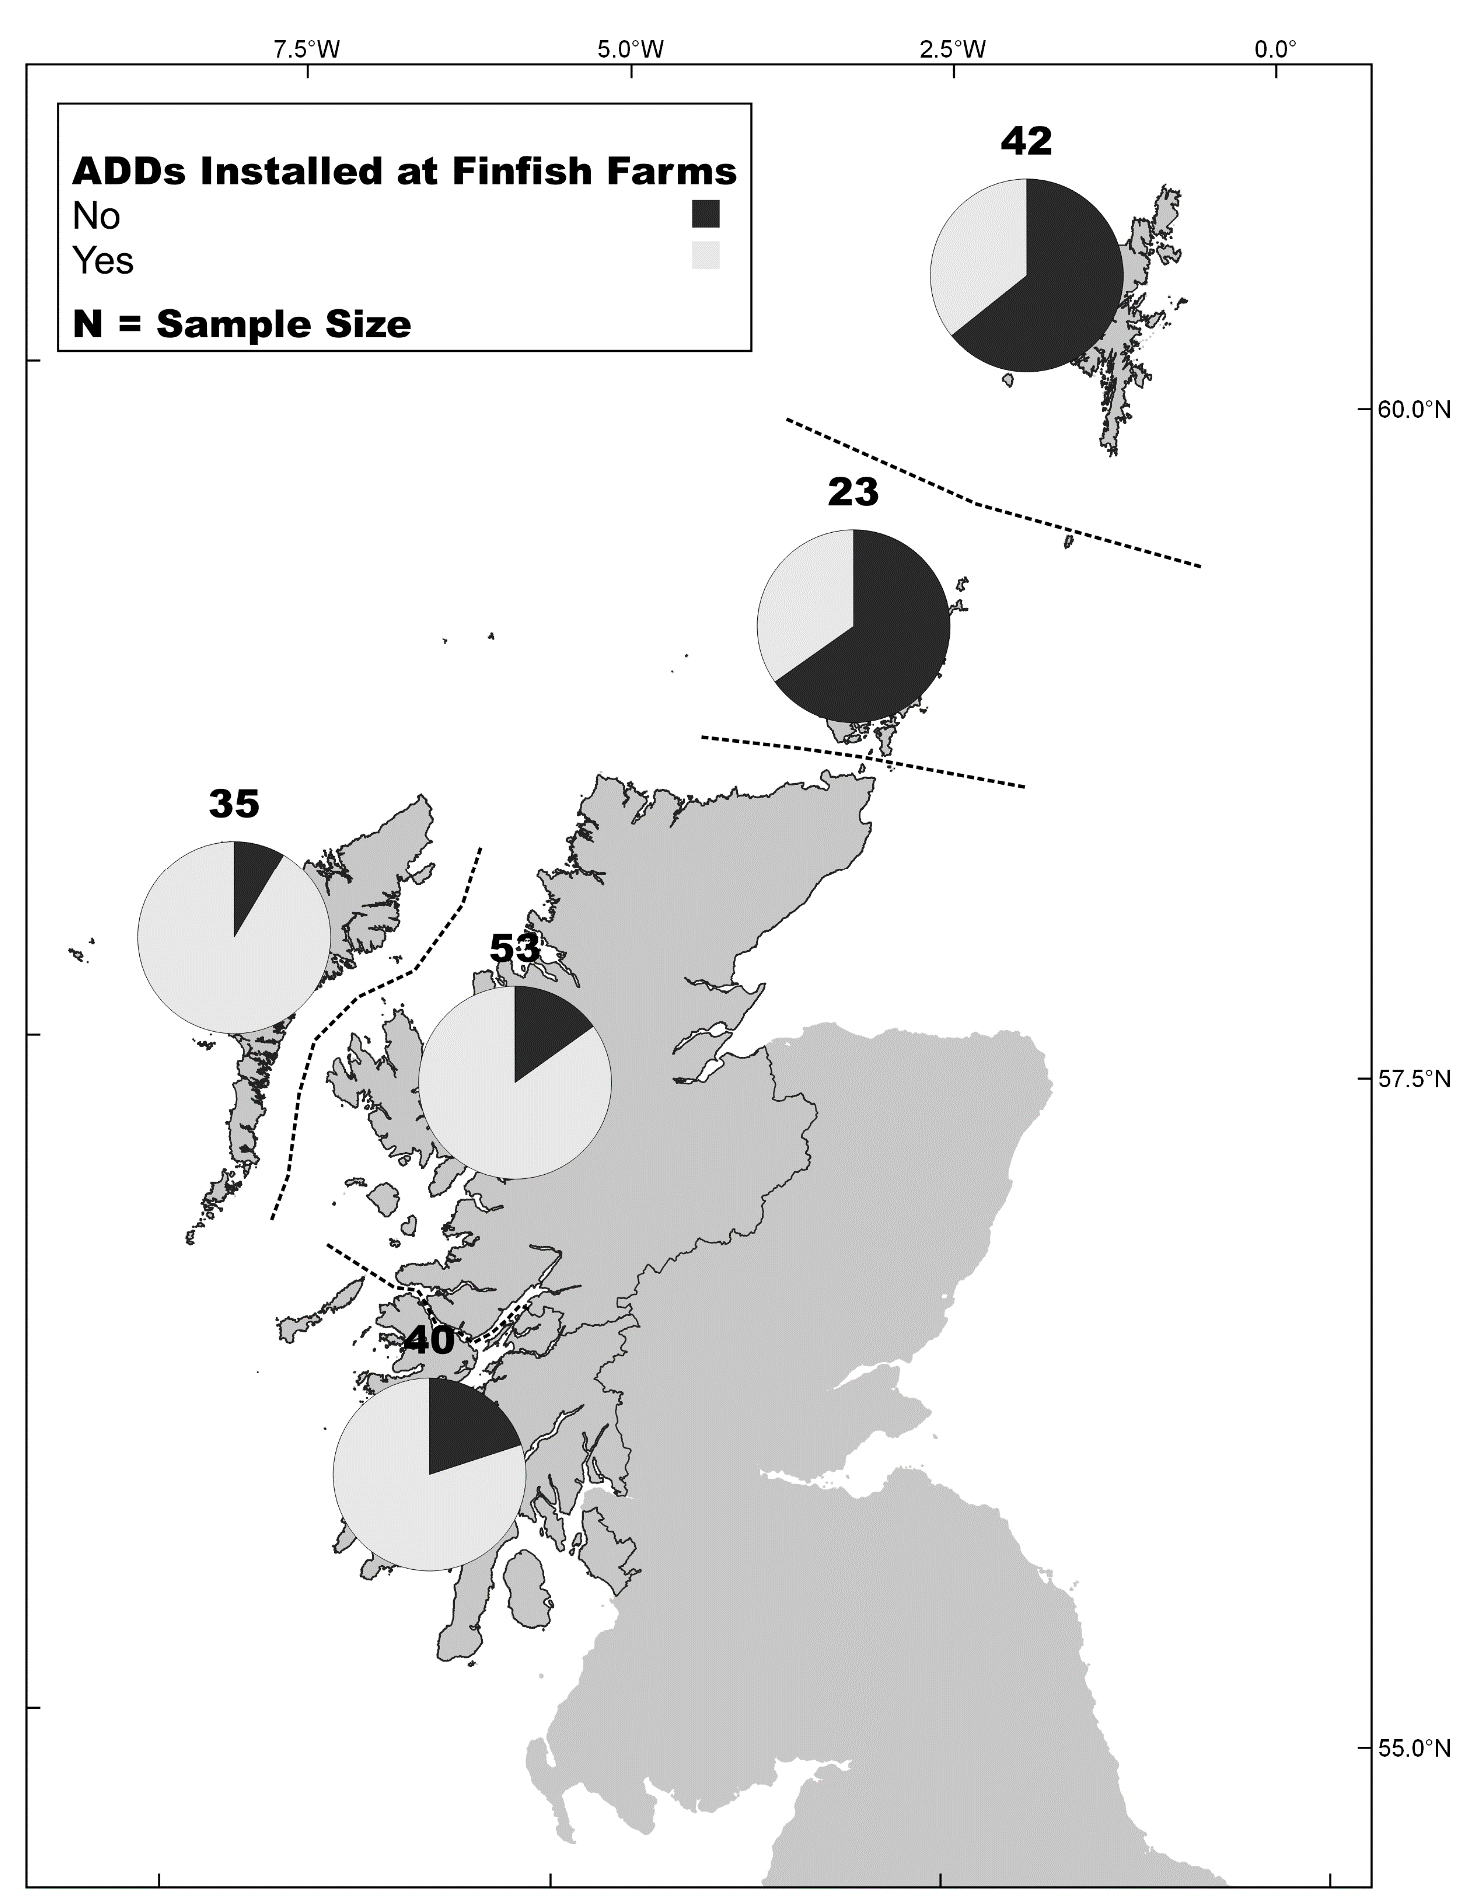
The total number of finfish sites which had ADDs installed over the winter of 2019 to 2020 was 132, or 68% of total operating sites. In contrast, there were 61 finfish farms (32%) which did not have an ADD installed over the same time period. This proportion varies by region (Table 1 and Figure 4), with Shetland and Orkney Isles both having relatively low numbers of ADDs installed as a proportion of the number of sites. The highest proportion can be found in the Western Isles, with 32 sites out of 35 having an ADD installed (91%).
In total there are seven different types of ADD installed at finfish farms over the winter of 2019 – 2020 (listed in Table 2).
The sound characteristics of each ADD has been described in several other reports (Coram et al., 2014, McGarry et al., 2020, Thompson et al., 2021) but a brief description is included here for reference (Table 2). Where records indicate that an ADD is installed, but do not specify the ADD type, and where this information could not be verified in communication with operators or manufacturers, these have been recorded as 'Unknown'.
| Device | Comment |
|---|---|
| Airmar dB Plus II | These are different iterations of the original Airmar dB Plus II, which emit the same signal types but may have slight differences in operating features. |
| GaelForce SeaGuard | |
| MohnAqua MAG Seal Deterrent | |
| Ace Aquatec US3 | This includes records of older devices listed as US2 which is also made by Ace Aquatec and producing the same signal. |
| Ace Aquatec RT1 | A low-frequency device produced by Ace Aquatec. |
| Terecos DSMS-4 | No longer in production but still in use |
| OTAQ Seal Fence | Operates in Protect or Patrol mode. |
| Region | Airmar | Ace-US3 | Ace-RT1 | GaelForce | MohnAqua | OTAQ | Terecos | Unknown |
|---|---|---|---|---|---|---|---|---|
| Highland | 15 | 5 | 2 | 3 | 3 | 20 | 7 | 3 |
| Orkney | 2 | 1 | 4 | 0 | 1 | 0 | 0 | 0 |
| Shetland | 9 | 2 | 9 | 0 | 1 | 1 | 1 | 1 |
| Argyll and Bute | 4 | 2 | 0 | 0 | 2 | 24 | 2 | 0 |
| Western Isles | 1 | 2 | 0 | 2 | 3 | 23 | 1 | 4 |
| Total | 31 | 12 | 15 | 5 | 10 | 68 | 11 | 8 |
| % of active finfish farms | 14% | 6% | 7% | 2% | 5% | 31% | 5% | 4% |
Table 3 shows the number of sites with each type of ADD over winter 2019 - 2020, broken down by region. Several sites are reported to have multiple ADD types, and therefore the combined totals are higher than the number of sites that have ADDs. The most commonly installed ADD type is the OTAQ system, which was installed at 68 finfish farms during October 2019 to April 2020, this equates to 31% of all active finfish farms (Table 3). The Airmar and similar devices (GaelForce and MohnAqua) combined are installed at 46 sites, which equates to 21% of active finfish farms.
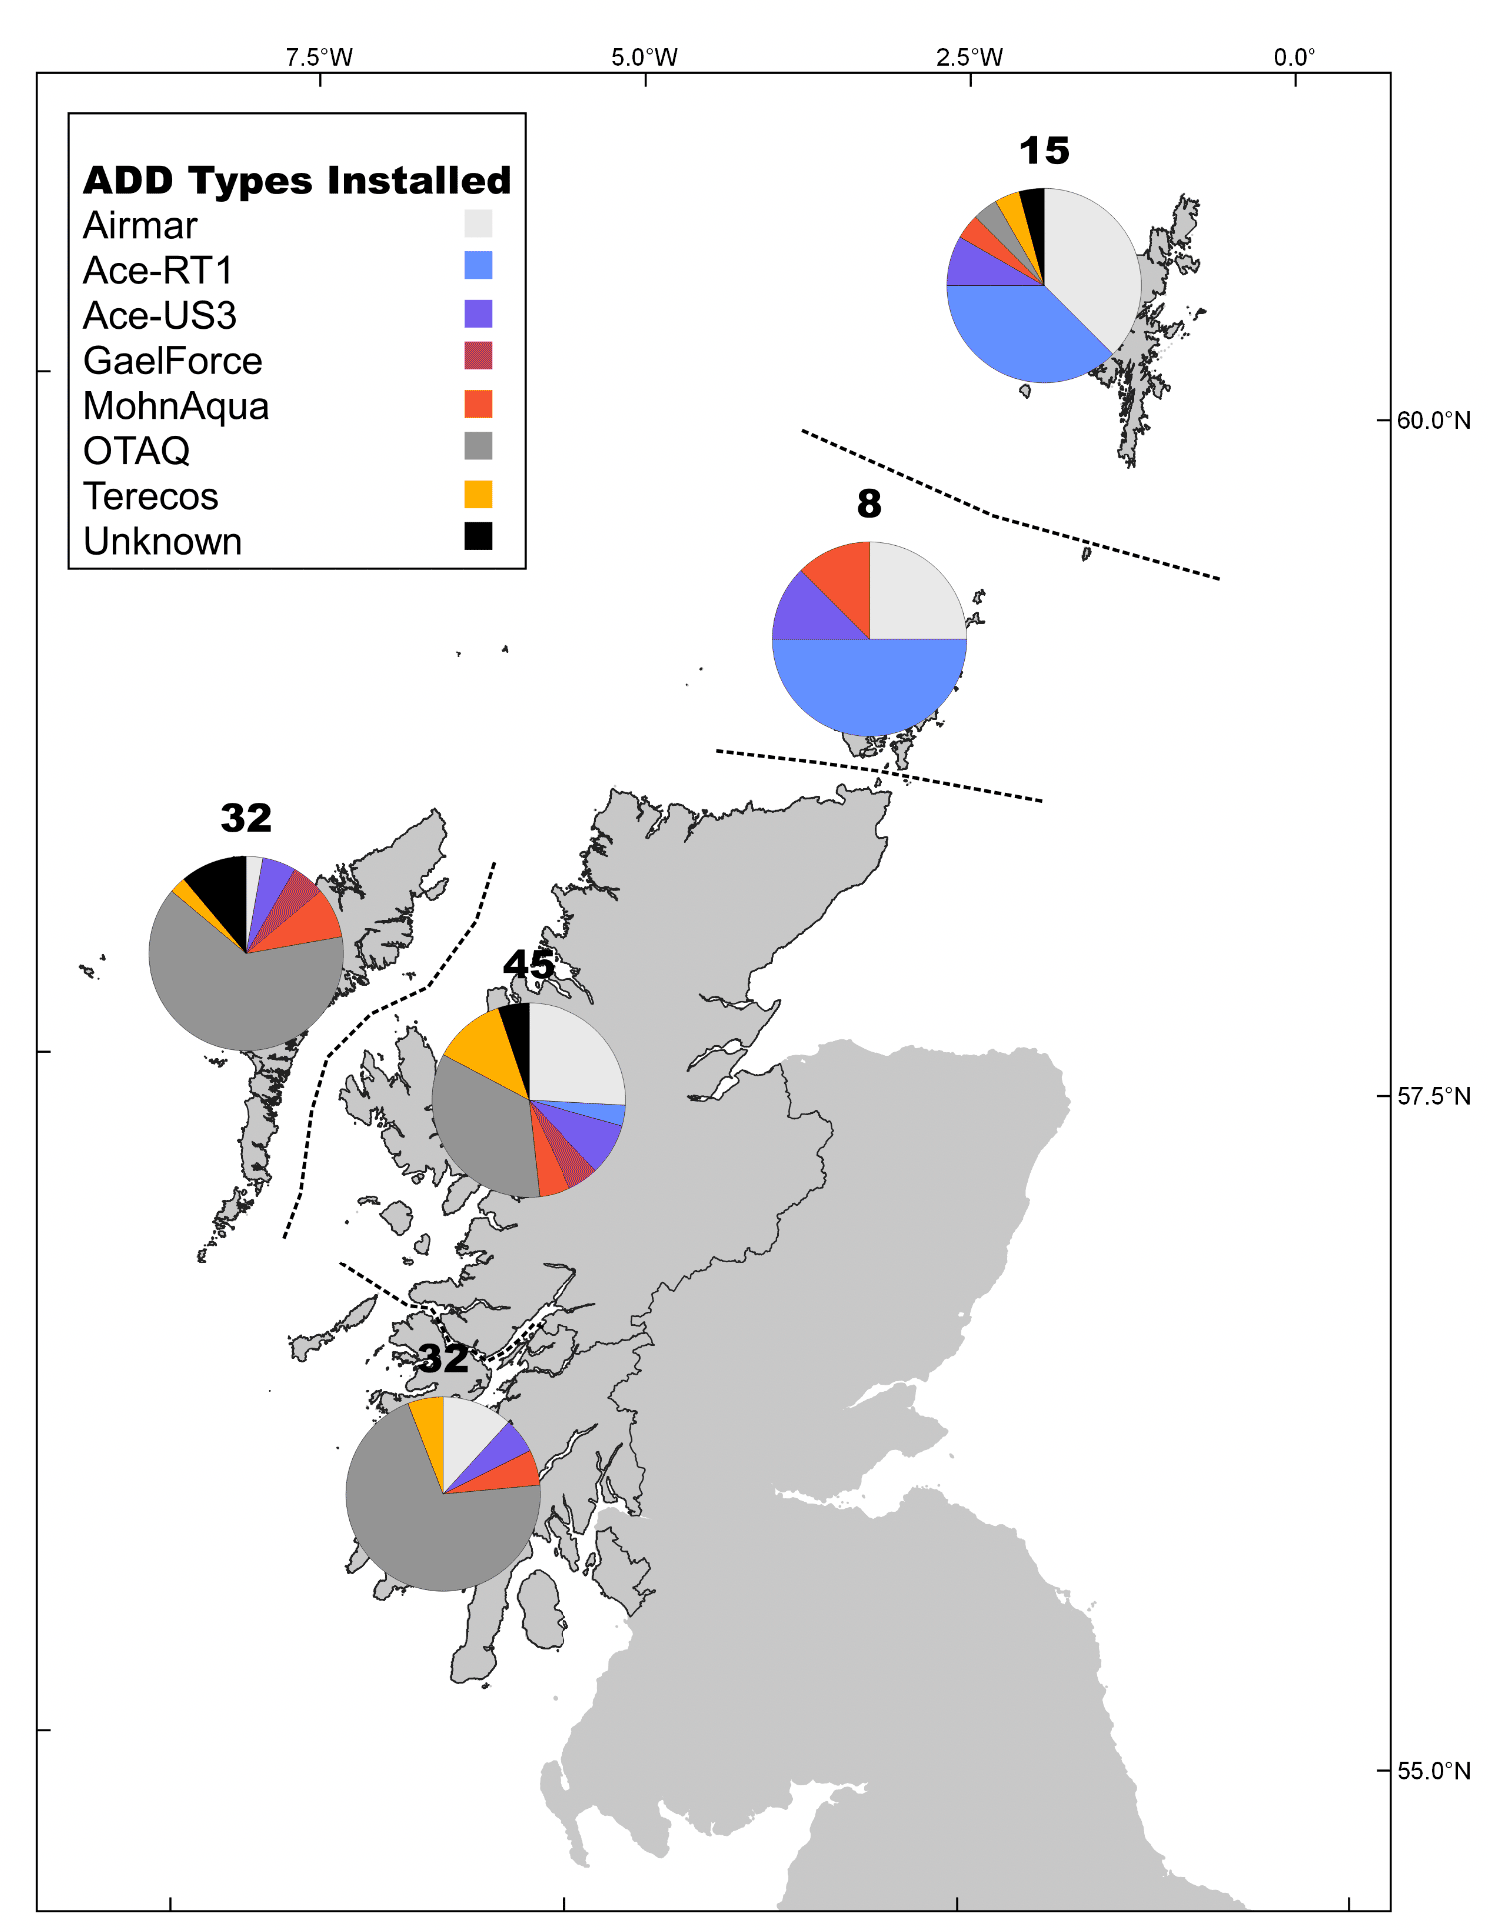
There are regional differences in the types of devices installed. Figure 5 shows the regional proportions of sites with each of the different types of ADD in winter 2019 - 2020. Airmar, GaelForce and MohnAqua devices are distributed across all regions, with the largest proportions of farms with these devices in Shetland, Orkney and Highland regions. OTAQ equipment is not generally installed in the Northern Isles, but makes up the largest proportion of finfish farm sites in the Western Isles, Highland and Argyll and Bute. The largest proportions of ADDs in the Northern Isles is the Ace Aquatec RT1 and Airmar.
3.3 Changes in ADDs over time
This section explores the changes in the presence of ADDs at finfish farms over time, providing a broadscale assessment of their historical use from 2014 to 2019. The cessation of the seal licensing survey in October 2019, combined with the collection of additional information from alternative sources after this time, means that the most recent information from 2020 is not necessarily comparable with earlier years and so is not considered here.
3.3.1 Extent of ADDs
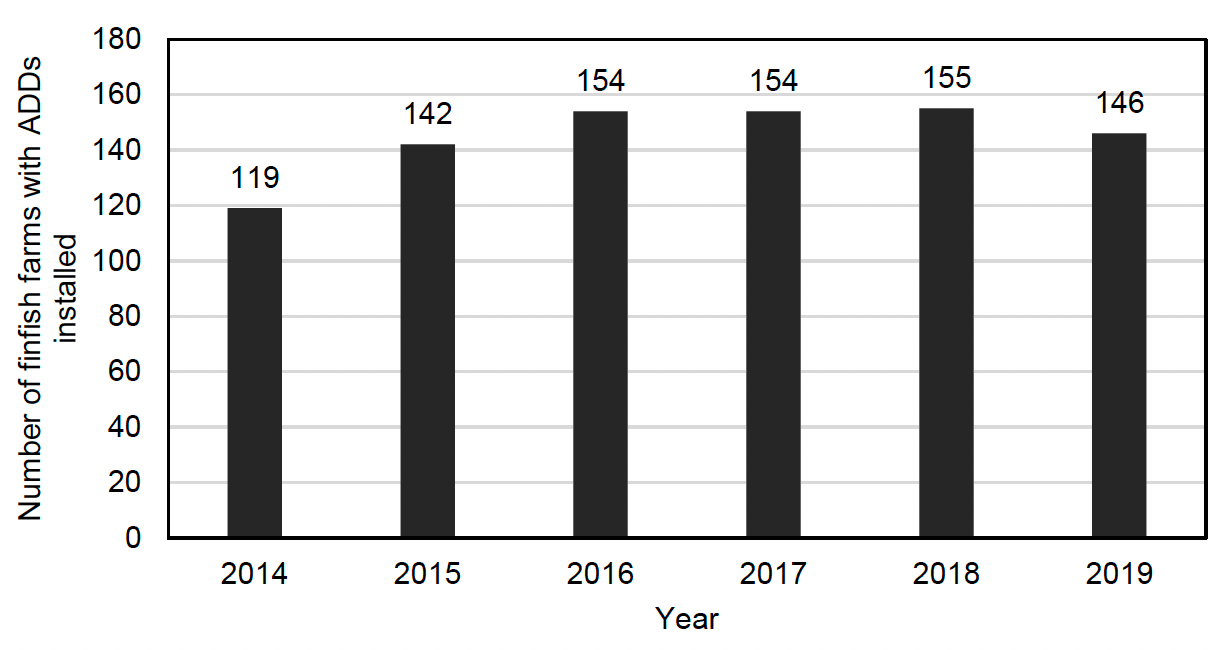
From 2014 until 2016, the number and proportion of finfish sites with ADDs increased from 119 to 154 (58% to 67% of total sites). From 2016 to 2018, the number of sites with ADDs was stable at 154/155 (around 70% of active finfish farms). After a peak from 2016 to 2018, the number of sites with ADDs declined to 146 (68%) in 2019 (Figure 6).
These changes over time are shown broken down by region in Table 4. As described above for the most recent information (section 3.2), the highest proportion of finfish sites equipped with ADDs in recent years has been in the Western Isles and the Highlands. The proportion of sites with ADDs increased in all regions except Argyll and Bute from 2014 to 2019. In Highland, Shetland, Argyll and Bute, and the Western Isles, this increase occurred from 2014 until around 2017, since when it has stabilised or decreased slightly. Orkney has the lowest number and proportion of finfish farm sites with ADDs, but this increased in 2019.
| Region | 2014 | 2015 | 2016 | 2017 | 2018 | 2019 | ||||||
|---|---|---|---|---|---|---|---|---|---|---|---|---|
| Highland | 41 | 78.8% | 44 | 72.1% | 50 | 82.0% | 51 | 85.0% | 52 | 85.2% | 50 | 82.0% |
| Orkney | 2 | 9.5% | 4 | 17.4% | 4 | 17.4% | 2 | 8.3% | 2 | 8.3% | 8 | 36.4% |
| Shetland | 11 | 21.2% | 18 | 33.3% | 22 | 41.5% | 23 | 48.9% | 24 | 54.5% | 16 | 36.4% |
| Argyll and Bute | 38 | 88.4% | 44 | 84.6% | 44 | 86.3% | 42 | 82.4% | 42 | 84.0% | 37 | 72.5% |
| Western Isles | 27 | 77.1% | 32 | 82.1% | 34 | 85.0% | 35 | 94.6% | 34 | 89.5% | 34 | 91.9% |
| Grand Total | 119 | 58.3% | 142 | 61.7% | 154 | 67.2% | 154 | 70.3% | 155 | 71.1% | 146 | 67.6% |
3.3.2 Use of ADDs
Only a proportion of the ADDs that are installed on finfish farms are actively used (switched on) at any one time. Table 5 shows the percentage of time (stocked days) where sites with ADDs installed had them switched on, broken down by region and year. From 2014 to 2016, there was a reduction in the proportion of time (days stocked) that sites with ADDs installed had them switched on, from 93% to 77%, but from 2016 to 2019 this value rose again to 90%. There are some regional differences from year to year, but no consistent pattern in the percentage of days that ADDs were switched on.
| Region | 2014 | 2015 | 2016 | 2017 | 2018 | 2019 |
|---|---|---|---|---|---|---|
| Highland | 93% | 91% | 89% | 89% | 91% | 91% |
| Orkney | 100% | 82% | 92% | 69% | 100% | 100% |
| Shetland | 100% | 95% | 95% | 89% | 66% | 91% |
| Argyll and Bute | 90% | 82% | 66% | 93% | 89% | 84% |
| Western Isles | 94% | 88% | 66% | 84% | 95% | 94% |
| Total | 93% | 88% | 77% | 89% | 89% | 90% |
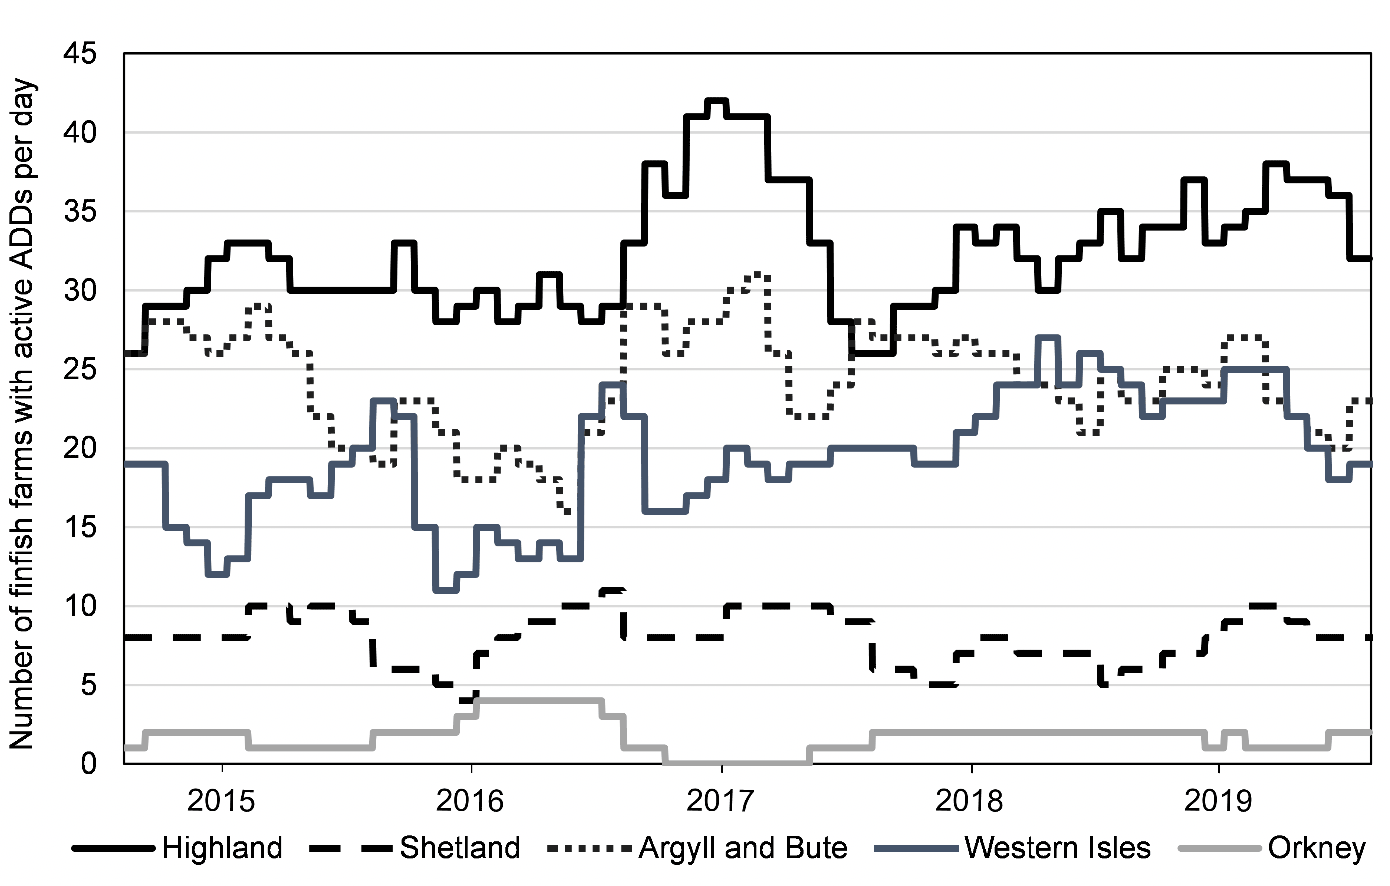
The total number of finfish farms actively using ADDs over time, as well as the regional breakdown in this metric, are shown in Figure 7. The number of farms where ADDs were reported as being in use are plotted from October 2014 to October 2019. Despite fluctuation over time and slight changes in certain regions, the overall total number of farms with ADDs switched on has remained consistently between 80 and 100 farms (apart from one period in 2016 where the total dropped below 80 farms).
3.3.3 Number of transducers in use
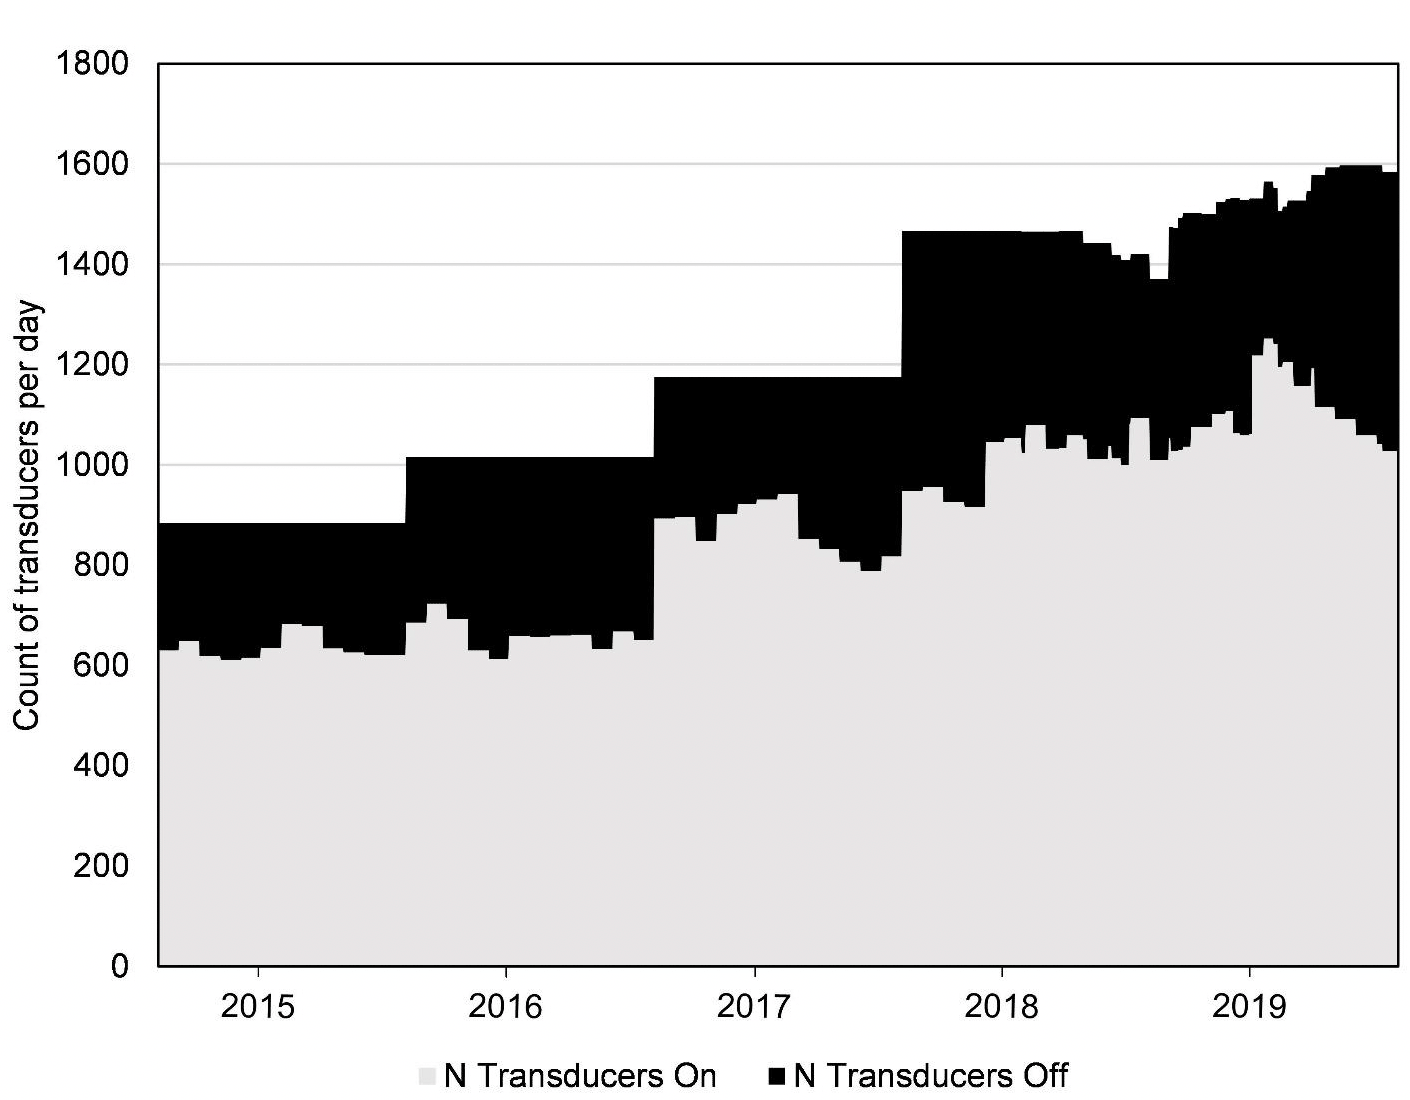
As well as the number of finfish farm sites with ADDs, it is important to consider the number of units (transducers) installed, and how many of these have been in active use. Figure 8 shows the change over time in the number of transducers on finfish farm sites. A continuous time series shows the daily total number of transducers installed on finfish sites, separated into two categories depending on whether the ADD was turned on (grey) or turned off (black).
From 2014 to 2016, the number of transducers increases in line with the total number of finfish farms using ADDs, but after 2016, when the number of farms with ADDs peaked and began to decline, the number of transducers continued to increase. The increase continued until the end of 2019, when 1,583 individual transducers were present on farms, although the rate of increase appears to have slowed since 2017. Since early 2019, a gradual reduction in the proportion of transducers being actively used seems to have been occurring, reducing from 72% in February 2019 (1,107 out of 1,532) to 65% (1,027 out of 1,583) in October 2019.
3.3.4 ADD types
There has been a change in the models of ADDs reportedly being used from 2014 to 2019 (Figure 9). Use of the Terecos system has declined since 2016, having been installed at 49 finfish farms at the peak, but dropping to 17 by 2019 (Table 6).
Earlier records show that the majority of farms with ADDs were using either 'Airmar' or 'MohnAqua' systems, both of which emit the same sound signal (likewise GaelForce). However, use of the MohnAqua and Airmar systems has generally decreased, while OTAQ, Ace Aquatec RT1 and GaelForce (who acquired MohnAqua in 2016) have increased. The newer OTAQ equipment has similar signal characteristics to the Airmar/ MohnAqua/ Gaelforce systems, but it features a second, lower amplitude, mode of operation called 'patrol mode'.
There has been an increase in the use of the Ace Aquatec RT1, which has been replacing the US3 since 2016. This may be important for the frequency characteristics of sound output and may also have an impact on the total number of transducers operating, as RT1s are generally used in low numbers (i.e. one or two transducers per site).
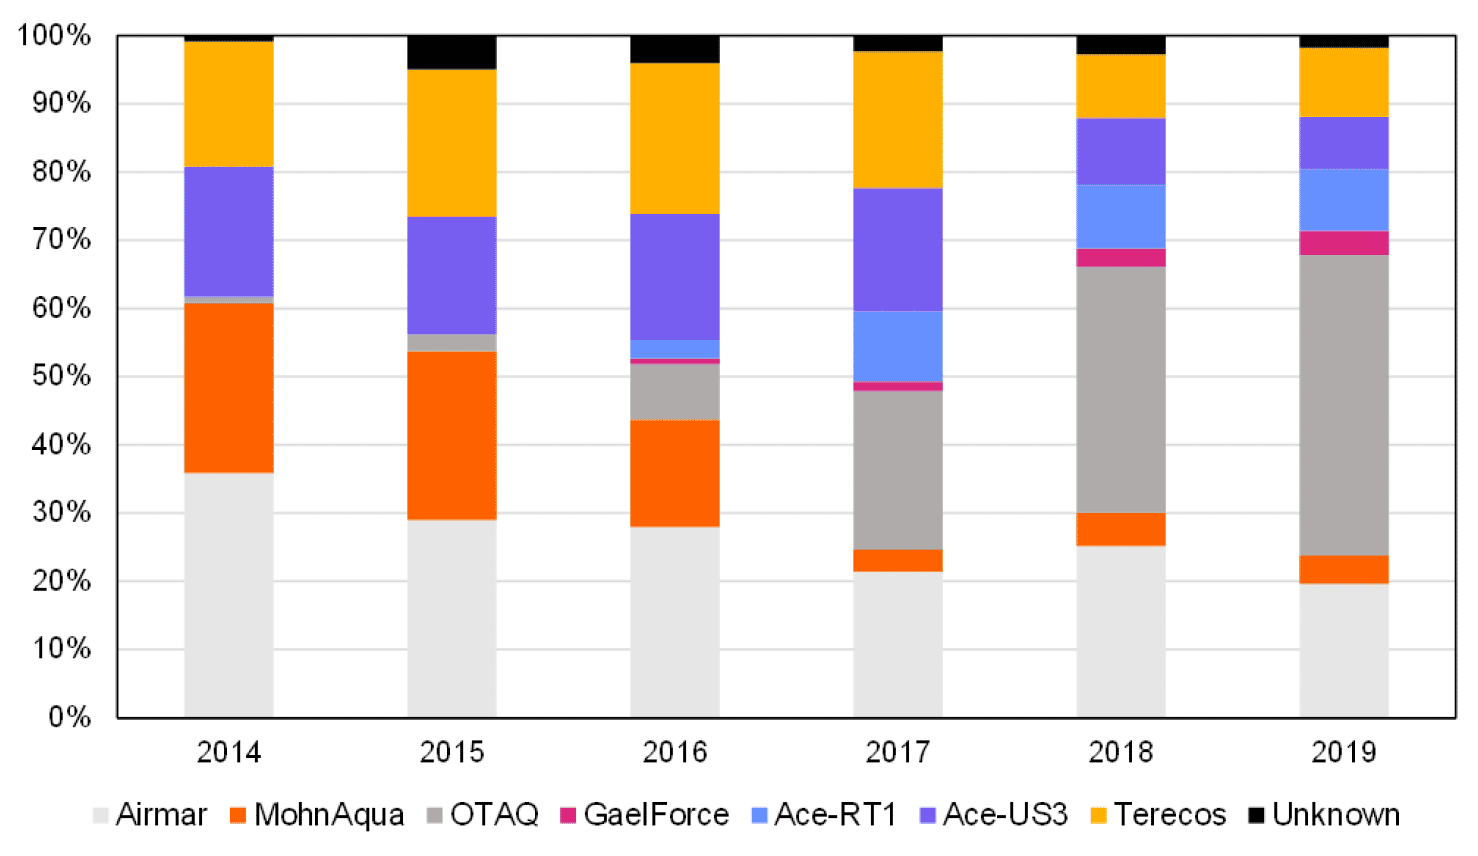
Table 6: Number of sites with each type of ADD per year
| ADD type | 2014 | 2015 | 2016 | 2017 | 2018 | 2019 |
|---|---|---|---|---|---|---|
| Airmar | 43 | 47 | 62 | 46 | 46 | 33 |
| Ace-RT1 | 0 | 0 | 6 | 22 | 17 | 15 |
| Ace-US3 | 23 | 28 | 41 | 39 | 18 | 13 |
| GaelForce | 0 | 0 | 2 | 3 | 5 | 6 |
| MohnAqua | 30 | 40 | 35 | 7 | 9 | 7 |
| Terecos | 22 | 35 | 49 | 43 | 17 | 17 |
| OTAQ | 1 | 4 | 18 | 50 | 66 | 74 |
| Unknown | 1 | 8 | 9 | 6 | 6 | 3 |
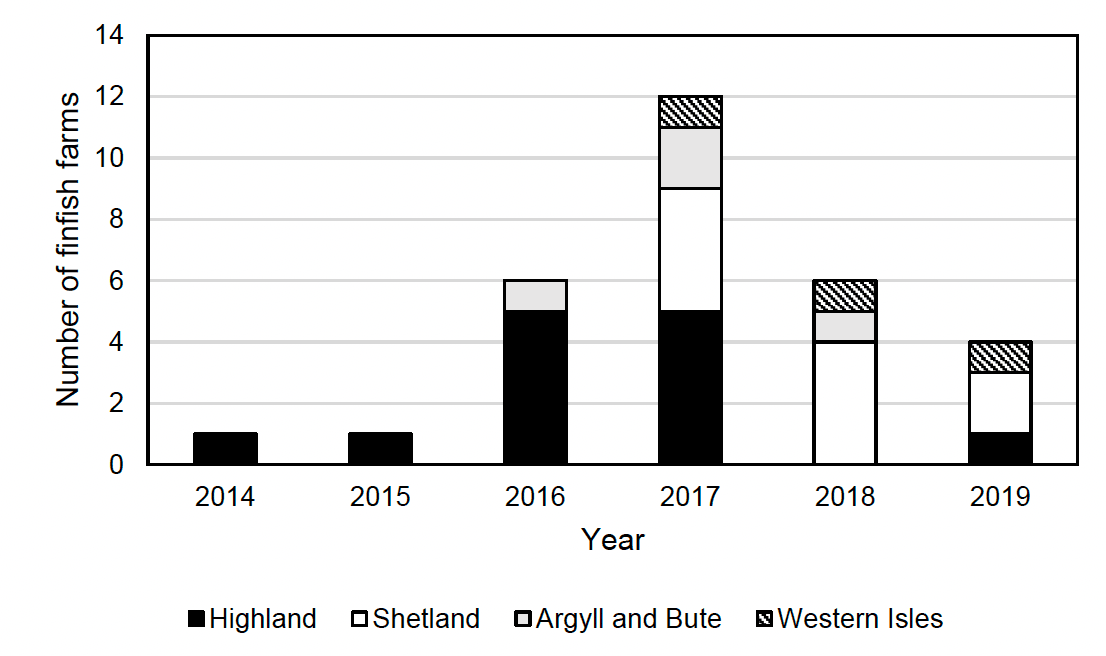
3.3.5 Number of farms with multiple ADD types
From 2014 to 2017 there was an increase in the number of farms equipped with multiple types of ADD, particularly in certain regions (Figure 10). At the peak in 2017, there were 12 finfish farm sites which had multiple types of ADD installed. In some cases, farms have up to three different models of ADD installed. In 2014 and 2015, only one site reported having more than one type of ADD but since 2016 this appears to have become more common, with 12 sites reportedly having more than one device in 2017. Figure 10 shows this is mostly due to deployment strategies in two regions, with this practice initially adopted in Highland, and since 2017 in Shetland (and to a lesser extent the Western Isles). Since 2017, the number of finfish farms using multiple ADD types has reduced to just 4 (Figure 10), which has been mostly driven by changes in practice in the Highland region.
3.4 Use of multiple transducers
ADD systems usually comprise of multiple transducers, each of which generally emits an intermittent sound pattern when the system is turned on. The effective, or 'real-world' duty cycle of the ADD system is the proportion of time that the overall ADD system is actively emitting sound. This is an important factor in assessing the cumulative sound output, but the sound characteristics derived ADD manufacturer specifications that are often used for assessments typically relate to a single unit only. The effective duty cycle will depend upon (1) the duty cycle of signal emissions per transducer, (2) the total number of transducers per farm, and (3) any method of synchronising or otherwise limiting the effective duty cycle.
There is an important link between the impact of increasing duty-cycle and number of transducers on the overall effective duty-cycle. Assuming multiple transducers in the same system are active within the same time period, but not synchronised, the consequence is likely to be an increase in the effective duty cycle. In instances where sites use large numbers of unsynchronised transducers, this could in theory result in an effective duty cycle of 100% (continuous noise emission).
Table 7 provides device duty cycle values that are derived from a typical single transducer for the main ADD types, although where options for reducing the effective duty cycle are available (e.g. synchronising the sound output from multiple units, or limiting the effective duty cycle) these are included.
| Manufacturer | Mode | Single Transducer Duty-cycle | Notes | Source |
|---|---|---|---|---|
| Airmar/ GaelForce/ MohnAqua | N/A | 50% | Lepper et al. (2014) | |
| Ace Aquatec US3 | All | 0.7% - 8% | Signals from individual units can be synchronised to avoid increasing duty cycle. A feature allows automatically 'ramp-down' duty cycle from 8% - 0.7% after a period of depredation | Ace Aquatec (personal communication, 26/11/2020) |
| Ace Aquatec RT1 | All | 0.7% - 8% | Signals from individual units can be synchronised to avoid increasing duty cycle. A feature allows automatically 'ramp-down' duty cycle from 8% - 0.7% after a period of depredation | Ace Aquatec (personal communication, 26/11/2020) |
| Terecos | All | 100% | Lepper et al. (2014) | |
| OTAQ | Patrol | 9.1% | Asynchronous, each unit fired in turn | OTAQ (personal communication, 2/3/2021) |
| Protect | 31.6% | OTAQ (personal communication, 2/3/2021) |
In practice for most models of ADD, multiple units (transducers) are typically installed at finfish sites, although the number of transducers will vary by site. Figure 11 shows the number of units typically used for each of the ADD types at finfish farms. The distribution for the Airmar device is bimodal, with peaks at four and 12 units per site, but with some sites having up to 24 units. This distribution is similar for GaelForce, and MohnAqua with a peak around 12 and likely reflects the same deployment plan of approximately one unit per net. The Terecos and Ace Aquatec US3 devices have a lower mean number of devices per site, and the RT1 is typically installed as a single unit or in pairs. The highest numbers of devices are generally seen for the OTAQ devices, with over 30 installed in some instances, which may reflect the installation of this equipment on sites with a larger number of nets.
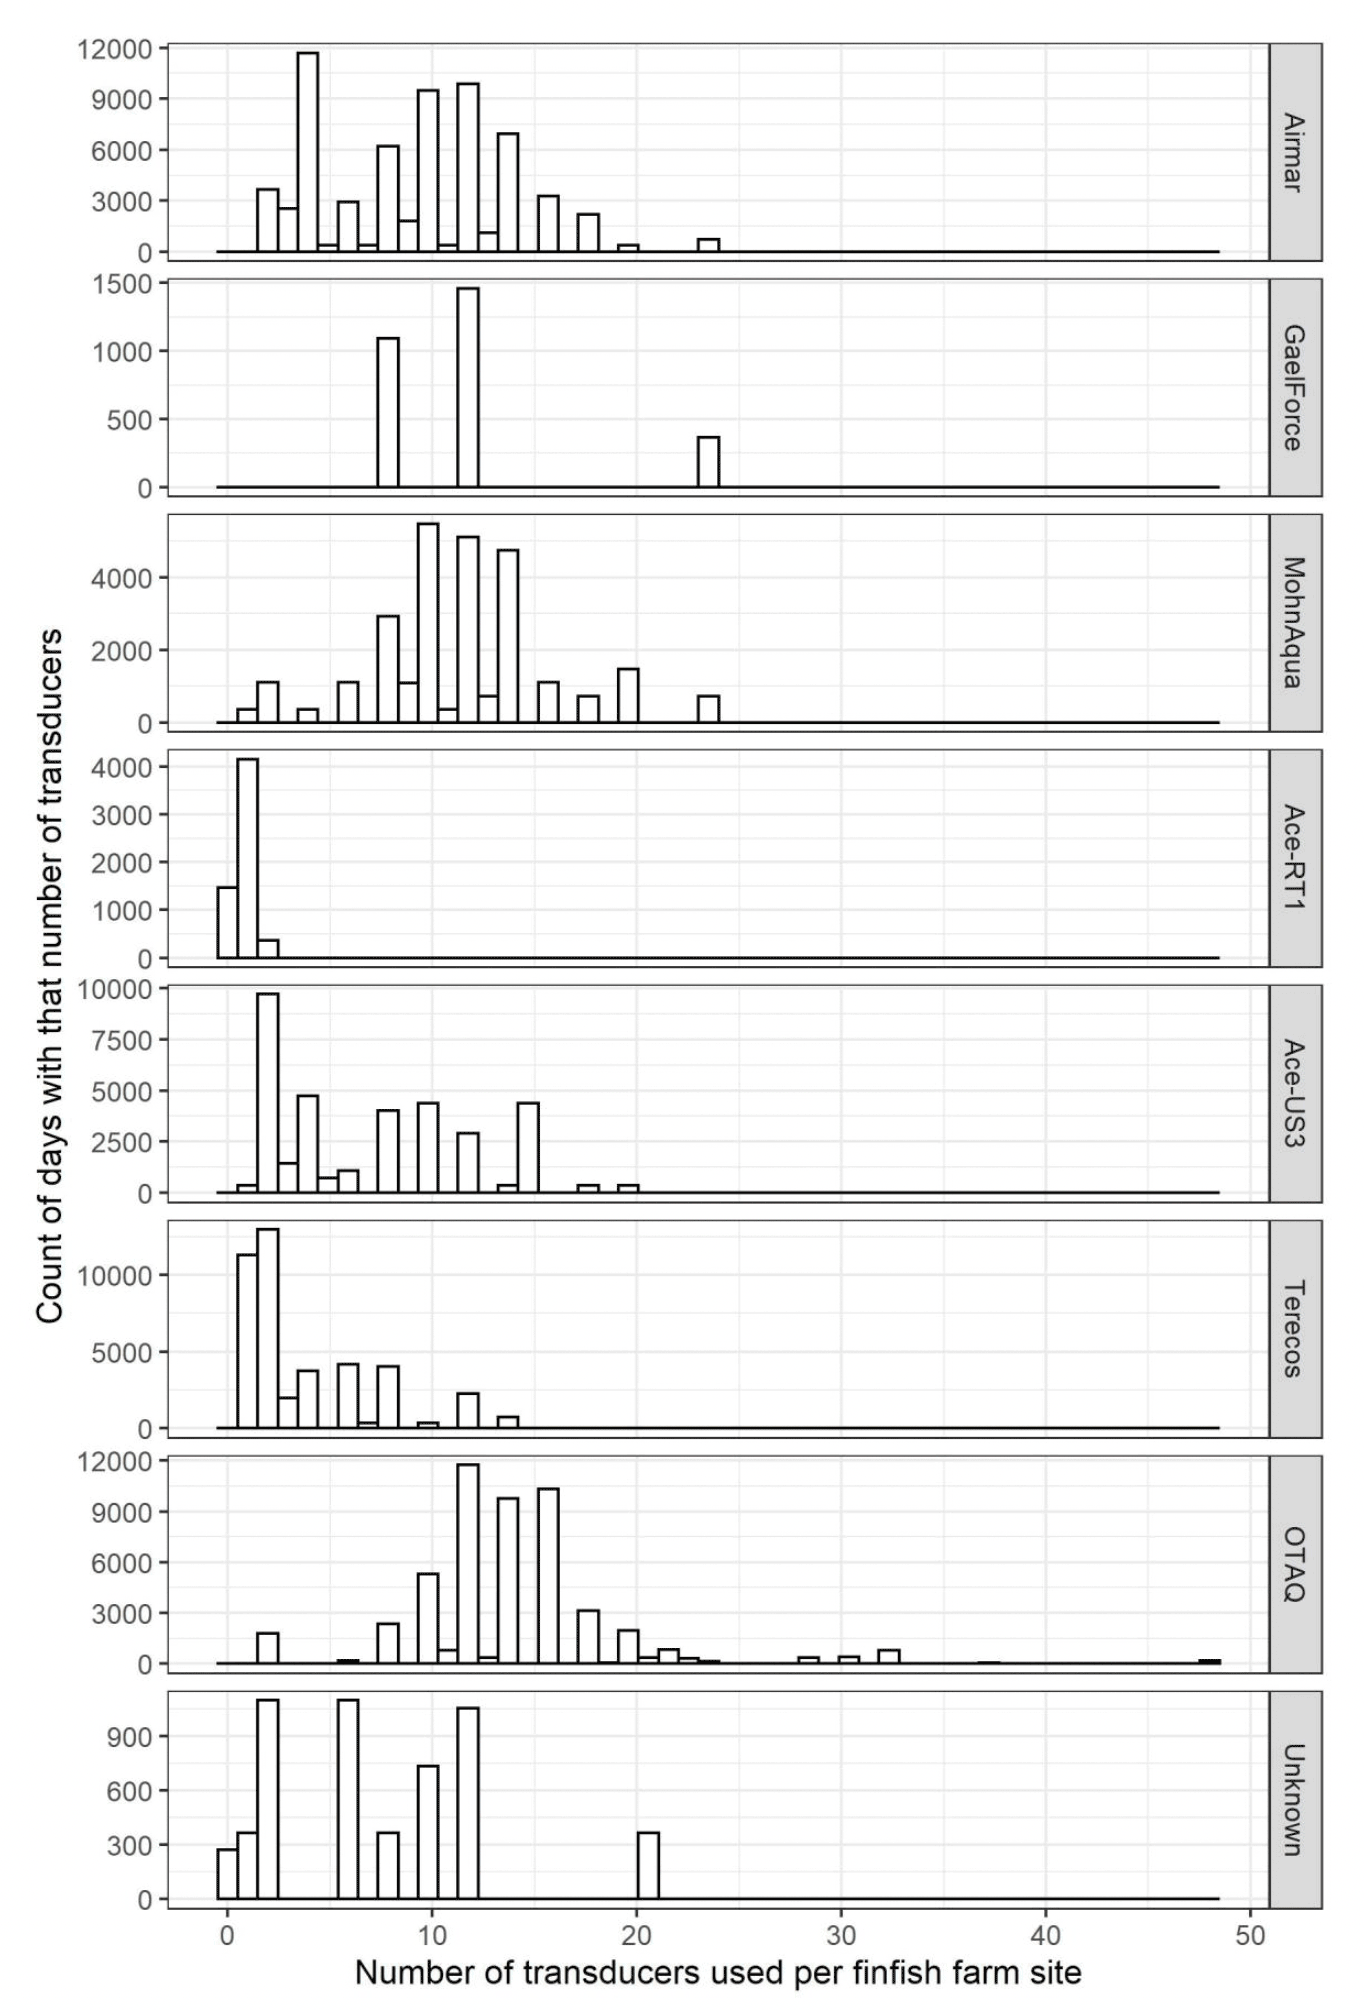
The number of transducers installed at a site is typically agreed between the site manager and ADD manufacturer. Deployment strategies recommended by the manufacturer typically use one device per net. In some cases, the manufacturer or installer may recommend additional units (for example at the end of a group of nets) to provide homogenous coverage around the site perimeter.
As well as changing the effective duty cycle, the sound emitted from multiple transducers may interact and modify the received amplitude of sound signals. There is potential for constructive and destructive acoustic interference when the maxima of two acoustic waves add together, or work to cancel each other out, depending on the phase difference, and this has the potential to affect the received amplitude in parts of the sound field. Where signals overlap in time, constructive interference is likely to increase the received amplitude above the measurements typically made for only one transducer (e.g. in Lepper et al., 2004). There is a need for additional research on the effect of signal overlap on received amplitude in real-world application.
3.5 Characterisation of ADD use patterns
In order to accurately assess the sound output from ADDs under real-world conditions, it is important to understand their typical patterns of use. It has been reported that different farms adopt a variety of 'strategies' in relation to ADD use (Northridge et al., 2010). Specifically, some finfish farm managers preferred to use ADDs continuously in order to discourage seals from learning to become interested in nets. Other managers switch ADDs on once fish are over a certain size, and others switch them on only when seals are around nets, or when depredation is being observed. No information on such strategies were available for analysis from the seal licensing survey, finfish producers or accreditation schemes.
As systems have developed, some ADD manufacturers now have the ability to remotely monitor ADD status by the collection of real-time usage data on farms through a 4G linked online portal. At the time of writing this type of system is used by two manufacturers which have the option to automate the collection of data on ADD use at a per-device basis and at a fine temporal resolution (for example in ten-minute blocks). This feature has the potential to allow the collection of data that can inform our understanding of real-world patterns of ADD use.
3.6 Summary
There is no single, comprehensive source of information on the nature and extent of ADD use at finfish farms in Scotland. A collated dataset has been created, combining information on ADDs from a variety of disparate sources. The complete collated dataset covers the time period from 2014 to 2020. This dataset was collated from a variety of sources, none of which were completely comprehensive, verifiable or systematic, therefore these results should be interpreted with a degree of caution. Regardless, these data are still considered suitable for the identification of broadscale patterns in ADD use over time between regions, and provides the best possible description of recent industry practices.
The most recent information available was examined to indicate levels of recent ADD use (winter 2019 – 2020), including regional differences, while data on historic use between 2014 and 2019 was examined to determine changes in use over time. The extent to which different ADD devices were used and how this varied between regions and over time was also examined.
Data from the most recent period available (October 2019 – April 2020), revealed that ADDs were installed at 68% of all Scottish finfish farms, although this percentage varied regionally. Highest levels of ADD use were recorded in the Western Isles, where 91% of farms reported ADD use. Lowest levels were recorded in Orkney and Shetland with 35% and 36% of farms using ADDs respectively. The most commonly installed ADD type during this time was the OTAQ, which was in installed at 31% of active farms over the same time period. Again, this varied between regions; the OTAQ device was not reported at any farms in Orkney and only by a single farm in Shetland, whereas it was more prevalent across farms in Argyll and Bute and in the Western Isles. In the Northern Isles the Ace Aquatec RT1 and the Airmar devices were most commonly reported.
When considering trends over time (2014 to 2019), the number of sites with ADDs installed increased between 2014 and 2018, peaking at 155 in 2018, which was around 70% of active farms, and declined slightly in 2019 to 146 sites. The total number of ADD transducers at farms steadily increased over the time period 2014 to 2019. This may have been largely driven by changes in the device types being used, towards types which are typically used in larger numbers. It could also be influenced by changes in the size of finfish farms over this time period.
There was a change in the ADD types installed over time. In 2014 the 'Airmar' type ADDs (Airmar, MohnAqua and latterly GaelForce) were the most widely installed devices, together being present at 73 finfish farms. By 2019, the OTAQ device was the most commonly installed device (74 finfish farms), with Airmar and MohnAqua installed at 46 sites.
Between 2014 and 2016 the total number of transducers installed increased in line with the reported increase in total number of farms with ADDs. After 2016, when the number of farms with ADDs stabilised, number of transducers continued to increase between 2016 and 2019, although the rate of increase slowed after 2017.
Between 2014 and 2016 there was a reduction in the proportion of time that ADDs were reported as being actively used (turned on), from 93% to 77%, this increased following 2016 and has remained at 89 - 90% since 2017. The total number of farms where ADDs were reported as being turned on remained between 80 and 100 for most of the period between 2014 and 2019. The number of finfish farms actively using ADDs reduced in Argyll and Bute and the Western Isles through 2019, which may be driving the observed reduction in the overall number of transducers being used over the same time period. Changes to a small number of large finfish farms (which typically use larger numbers of transducers), would explain why this pattern is not obvious in the number of farms actively using ADDs. At some finfish sites multiple ADD types are also installed, although this appears to be relatively uncommon. This practice increased between 2015 and 2017, when 12 sites had more than one type of ADD, and then subsequently decreased again.
Different device types are installed with different numbers of transducers. Information collected by this project show that GaelForce, MohnAqua and Airmar ADDs usually have around 12 transducers per finfish farm site, which indicates they are typically installed with one per net. Terecos and Ace Aquatec US3 devices are generally installed in slightly lower numbers. The highest number of transducers are typically found at sites with OTAQ equipment. This may be representative of differing deployment strategy suggested by ADD manufacturers, or may be a result of OTAQ equipment being installed at larger sites. The Ace Aquatec RT1 is usually installed singly or in pairs.
The effective duty-cycle of an ADD system is greatly increased by the use of multiple unsynchronised transducers. Unless transducers are synchronised with each other, or the duty-cycle of each transducer is adjusted in relation to the total number of units, the effective duty-cycle increases in relation to the number of transducers. In instances where sites use large numbers of unsynchronised transducers, this may result in an effective duty cycle much greater than the duty cycle of the individual units, and in some cases could in theory, lead to duty cycles of up to 100% (continuous noise emission).
The use of multiple transducers also has the potential to increase the peak received amplitude of sound around a finfish farm, but this effect is complex. There is a need for additional research on the effect of signal overlap on received amplitude in real-world application.
The availability of data from automated systems developed by ADD manufacturers may be a useful way of collecting and providing detailed records of patterns of ADD use to inform future assessments.
Finally, while these data sources have allowed general conclusions in trends in time and space, they do not explain why these changes have occurred. There is very little fine-scale information on temporal patterns and strategies of ADD use which would be required to fully understand the nature and extent of noise emissions from ADDs and to be able to predict potential effects.
Contact
Email: marine_conservation@gov.scot