Updates to SIMD Income and Employment Domains
Updates to SIMD Income and Employment Domains
Income Domain
37. The income domain identifies areas where there are concentrations of individuals and families living on low incomes. This is done by looking at the numbers of people, both adult and children, who are receiving, or are dependent on, benefits related to income or tax credits. It is not possible to look at actual income as there are no data available at datazone level so the indicators used in this domain are known as proxy indicators.
38. The benefits data used in SIMD 2009 covered the 2008 calendar year. This publication presents analysis of a revised version of the first annual update to this domain ( SIMD 2009+1: 2009 benefit data, 2008 tax credits and 2008 population data) and a new version of the domain using more up-to-date data ( SIMD 2009+2: 2010 benefit data, 2009 tax credits and 2009 population data). Details of the reasons for the revisions to the SIMD 2009+1 income domain are provided in annex B.
39. The different versions of the domain used to date are shown in the table below.
| Version | Period benefits data relates to # | Period population data relates to | ||
|---|---|---|---|---|
| Adult Benefits | Dependent Benefits | Tax Credits 3 | ||
| SIMD 2004 | 2001/2002 | 2001/2002 | 2002 | April 2001 |
| SIMD 2006 | 2005 | 2005 | N/A | Mid 2004 |
| SIMD 2009 | 2008 | 2008 | 2008 | Mid 2007 |
| SIMD 2009+1 | 2009 | 2009 | 2008 | Mid 2008 |
| SIMD 2009+2 | 2010 | 2010 | 2009 | Mid 2009 |
# Note that the periods between versions of the domain are not of equal length.
40. Due to changes to the benefit system the indicators used in the income domain have changed over time so care needs to be taken when making comparisons. However SIMD 2009+2 is consistent with the revised version of SIMD 2009+1 published in this paper and so direct comparisons can be made between these two versions of the domain. These are also largely consistent with SIMD 2009 although there has been a small change in which dependents are included in the domain. This has been caused by the introduction of income-based Employment and Support Allowance as outlined in Annex B and on the SIMD website: http://www.scotland.gov.uk/Topics/Statistics/SIMD/AnnualUpdates. The indicators used are listed in Annex A and the SIMD 2009 Technical Report4 provides further information.
Number and percentage of income deprived
41. SIMD 2009 used 2008 benefit data and so did not reflect the impact of the economic downturn. SIMD 2009+1 used 2008 and 2009 data and provided some indication of the impact of the downturn. SIMD 2009+2 uses 2009 and 2010 data and so may begin to show the effects of the recovery.
42. The SIMD 2009+1 and SIMD 2009+2 income domains are very highly correlated with a Pearson's correlation coefficient of 0.99.
43. The figures quoted below can be found in charts 4 and 5 in this document and in table 3, found here: www.Scotland.gov.uk/Topics/Statistics/SIMD/AnnualUpdates.
Chart 4: Percentage of population income deprived by local authority, SIMD 2009, SIMD 2009+1 and SIMD 2009+2
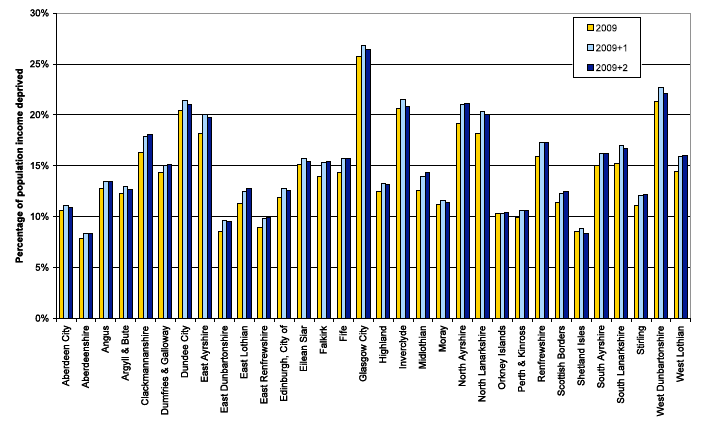
44. 16.2% of the population of Scotland are income deprived according to SIMD 2009+2. This represents a small decrease from SIMD 2009+1 when 16.3% were income deprived but an increase from SIMD 2009 when the figure was 15.1%.
45. Between SIMD 2009+1 and SIMD 2009+2, 15 local authorities saw a small decrease in the percentage of people who are income deprived with a further 6 experiencing no change and the remainder experiencing generally small increases. In all but 1 local authority (Shetland Islands) the latest figures remain above the SIMD 2009 figure.
46. North Ayrshire has experienced the largest increase in the percentage of the total population who are income deprived since SIMD 2009 - a rise of 1.9 percentage points (from 19.2% to 21.1%).
47. The biggest reduction since SIMD 2009+1 was in Inverclyde which has seen a fall of 0.7 percentage points from 21.5% to 20.8%.
48. Glasgow City continues to have a higher proportion of its population experiencing income deprivation than any other local authority at 26.4% (a decrease from 26.8% in SIMD 2009+1). Other local authorities with high percentages include West Dunbartonshire (22.1%), North Ayrshire (21.1%) and Dundee City (21.0%).
49. In contrast, just 8.3% of the population of Shetland Islands is income deprived.
Chart 5: Percentage of population income deprived by income domain vigintile, SIMD 2009, SIMD 2009+1and SIMD 2009+2
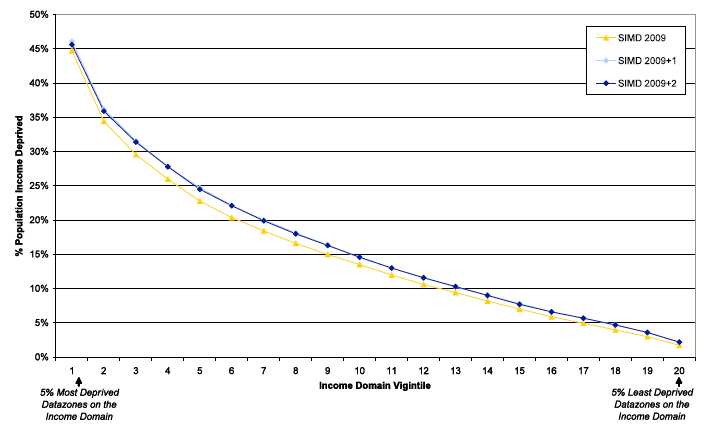
50. Chart 5 shows that the distribution of income deprivation across vigintiles (5% bands of datazones) has remained very similar between SIMD 2009+1 and SIMD 2009+2.
The 15% most income deprived datazones
51. 90% of the datazones in the 15% most deprived in the SIMD 2009+2 income domain were also in the 15% most deprived in the SIMD 2009+1 income domain.
52. The figures quoted below can be found in chart 6 in this document and in table 4, found here: www.Scotland.gov.uk/Topics/Statistics/SIMD/AnnualUpdates.
Chart 6: local share of 15% most income deprived datazones by local authority, SIMD 2009, SIMD 2009+1and SIMD 2009+2
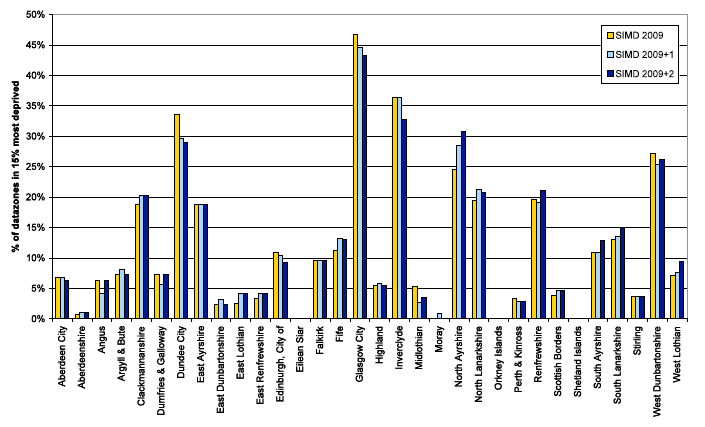
53. Glasgow remains the local authority with the highest share of its datazones in the 15% most income deprived although the number has fallen. Forty-three per cent (300) of its datazones are in the 15% most income deprived, down from 45% (310) in SIMD 2009+1 and 47% (324) in SIMD 2009.
54. Between SIMD 2009 and SIMD 2009+2, North Ayrshire has gained an extra 11 datazones in the 15% most income deprived whilst Fife and South Lanarkshire have both gained 8. Besides Glasgow (a reduction of 24 datazones), Edinburgh (-9) and Dundee City (-8) have seen the biggest reductions in the number of datazones in the 15% most income deprived.