Minority ethnic groups - understanding diet, weight and type 2 diabetes: scoping review
A scoping review to support our understanding of diet, weight and type 2 diabetes in minority ethnic groups in Scotland, their access and experiences of services to support weight management and type 2 diabetes, and recommendations for change.
Ethnic Minorities and Weight
Body Weight in ME groups
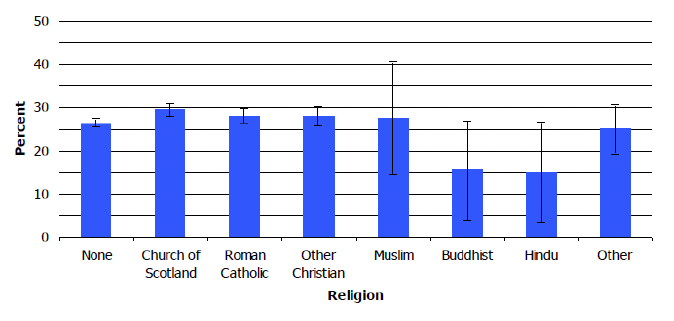
The Scottish Health Topic Report (Scottish Government, 2012) remains the latest data we currently have, on the weight status of ME groups in Scotland:
- Chinese and Asian Other respondents had significantly lower levels of overweight and obesity than most other ethnic groups (Figure 3);
- Buddhists and Hindus had a tendency towards markedly lower levels of obesity compared to others, although small sample sizes mean wide confidence intervals, (Figure 4).
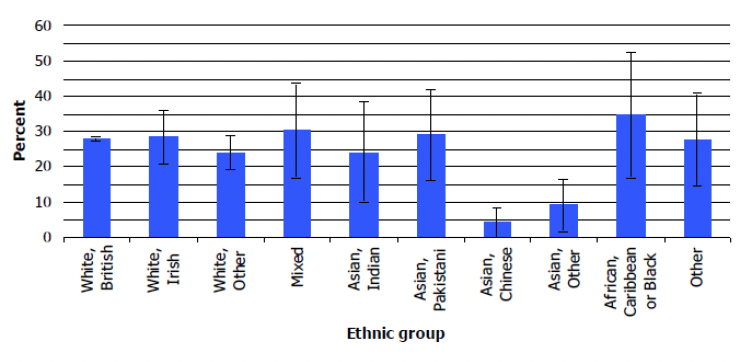
The ethnic groups considered were: White, British; White, Irish; White, Other; Mixed; Asian, Indian; Asian, Pakistani; Asian, Chinese; Asian, Other; African, Caribbean or Black; Other. Participants' weight and height were measured during the interview and overweight and obesity were defined using Body Mass Index (BMI), defined as weight (Kg)/height (m2): a BMI from 25 to less than 30 was classified as Overweight; 30 to less than 40 as Obese, excluding morbidly obese; a BMI of more than 40 as Morbidly obese.
It is well known that there are biological ethnic differences in BMI risk thresholds for diabetes among different ME groups. Among women, a waist circumference of 88 cm in the white subgroup is regarded as having the equivalent health risks to the following: South Asians, 70 cm; Chinese, 74 cm ; and Black, 79 cm. Among men, a waist circumference of 102 cm equates to 79, 88, and 88 cm for South Asian, Chinese, and Black participants respectively (Ntuk et al., 2014). This means that conventional clinical definitions for overweight and obesity, that are derived from populations of white European descendent, are not appropriate for non-white groups. NICE (2014) recommends the use of lower BMI thresholds (23 kg/m2 to indicate increased risk and 27.5 kg/m2 to indicate high risk) to identify overweight and obesity among Black African, African-Caribbean and Asian (South Asian and Chinese) groups and those at risk of developing type 2 diabetes.
Lower thresholds were not used to identify overweight and obesity among Asian groups in the SHeS analysis. This means a potential underestimation of overweight and obesity among these communities. The impact at population level is likely to be very minimal.
The UK Government reports statistics on the prevalence of overweight and obesity among ME groups in England and provides a more up to date indication of differences by ME group. Regarding adults, the latest statistics from the Active Lives Adult Survey are (Gov.UK, 2021):
- in the year to November 2020, 62.8% of adults (aged 18+) in England were overweight or obese, a similar percentage to November 2019 (62.3%);
- White British adults were more likely than the average to be overweight or obese (63.7%)
- 67.5% of Black adults were overweight or obese – the highest percentage out of all ethnic groups;
- 32.2% of adults from the Chinese ethnic group were overweight or obese – the lowest percentage out of all ethnic groups;
- the percentage of adults from the Asian (59.7%), Other White (58.0%) and Mixed (59.6%) ethnic groups who were overweight or obese was lower than average;
- the percentage of adults in the Other ethnic group (61.2%) who were overweight or obese was similar to the national average;
- while percentages were broadly similar to those from November 2016 for most ethnic groups, this was not true for White British people, where it went up from 62.0% to 63.7%, and for Black people, where it went down from 72.8% to 67.5%.
It is worth noting certain aspects of how the UK data has been collected and reported compared to SHeS:
- Ethnicity classification is different from SHeS, reported above. Estimates in the UK data are shown for 7 ethnic groups, Asian, Black, Chinese, Mixed, White British, White Other, Other, while the SHeS considered more categories for ethnicity.. However, data on the lower rates of overweight and obesity in Chinese and Asian communities compared to the general population is consistent with the results of the SHeS Topic Report;
- For England, people were asked for their self-report height and weight and these figures were used to determine their BMI, while SHeS BMI data relies on measured height and weight. However, English data adjusts for the known bias from self-report BMI where people tend to underestimate their weight and overestimate their height leading to a lower self-report BMI than is actually the case. Thus the two analyses should be reasonably comparable.
- As in SHeS, a BMI of 25 or more was classified as overweight and a BMI of 30 or more was classed as obese. Therefore, different BMI thresholds were not used for different ME groups, contrary to NICE (2014) guidelines. Hence the data should be approximately comparable.
The UK Government (Gov.UK 2020) also reports statistics of children in state-funded mainstream primary schools who are overweight or obese. Data about children in independent and special schools are not included. Estimates are published for two school years: reception year (when children are usually 4 to 5 years old), and year 6 (when children are usually 10 to 11 years old). Children are defined as overweight or obese based on their body mass index (BMI), which is measured using their weight, height, age and sex. This data comes from Public Health England and 16 ethnic groups are recognised, the same used in their 2001 census.
The latest confirmed statistics from England for percentage at risk of overweight or obesity are for the year 2020/21[4]. There was a noted sharp increase in overweight and obesity prevalence across all groups compared to previous years which has been put down to impact from the Pandemic. For example, 22.4% of children aged 4 to 5 in England were at risk of overweight or obesity in 2017/18 compared to 27.7% in 2020/21, see Table 1.
The data shows that at age 4 to 5 years, Asian children have lower prevalence compared to the average, and Chinese children are at much lower risk. However, by age 10 to 11 years, Asian and Chinese groups are either at a similar level to average or above. At both ages, Black African/Caribbean children have a markedly higher prevalence.
| Reception Age 4 to 5 yrs |
Year 6 Age 10 to 11 yrs |
|
|---|---|---|
| Total |
27.7 |
40.9 |
| White |
27.4 |
38.8 |
| Asian |
25.8 |
46.7 |
| Black |
37.9 |
52.4 |
Source: National Child Measurement Programme (NCMP) Dataset, NHS Digital 2021
White – British, Irish, any other white background
Asian – Indian, Pakistani, Bangladeshi, any other Asian background
Black – Caribbean, African, Any other Black background
Factors Affecting Body Weight in ME groups
There is a direct relationship between dietary habits and weight[5]. As mentioned previously, Asian groups are generally reported as eating more fruit and vegetables than other groups, possibly indicating an overall healthier diet. This might in part explain the apparent lower incidence of overweight and obesity in their communities. However, some caution should be adopted in this regard, because if lower BMI thresholds have not been used in prevalence estimations there might be a significant underestimation. There are indications that Black groups may have an unhealthier diet, although this is primarily about what takes place in the US. We have no data to understand this more clearly in the UK, however, it may also be true here given the prevalence of overweight and obesity among Black communities despite not using lower BMI classification thresholds.
In this regard it is important to mention that some ME groups hold traditional beliefs around food, health and views on body image that may conflict with those based on scientific research. Specifically, overweight children are seen as healthy, and obesity in adults is seen as a symbol of affluence and success (Leung & Stanner, 2011). Moore et al. (2022) observe these strong cultural norms around weight in some UK Black African and Caribbean communities. In their qualitative study, they observe that the advice to lose weight for people diagnosed with T2D was extremely difficult to reconcile with cultural associations with prosperity and health, in both genders. Furthermore, in women there is also an issue of attractiveness and desirable maturity. As a consequence, some of the participants were following the health advice to lose weight only as far as it fitted within the cultural identity. This for example involved losing weight, but not to the degree that it was noticeable by family and friends.
CWIN (2019), the community-led project in Glasgow, also reports mixed cultural attitudes towards obesity. While some participants reported a positive attitude towards being overweight, others see obesity as a health problem or medical condition. Furthermore, someone also highlighted the stigma and the shame of being obese, especially for unmarried women. The report also discusses participants' awareness of the links between diet, overweight and health conditions, and it is noted that most people are aware of this. However, there might be a knowledge-action gap and other work observes that to have a good knowledge and awareness of a healthy diet did not necessarily translate to behaviour (Leung & Stanner, 2011).
Participants also think that their attitude and behaviour towards diet and obesity are strongly affected by the people they socialise with, such as family and friends (CWIN, 2019). This is consistent with some academic literature, which reports social pressure to eat large portions of traditional food during social events to comply with social expectations (Moore et al., 2022).
Regarding broader factors that affect weight status, obesity has been associated with experiencing discrimination and racism. Williams et al. (2019) conducted a review of literature reviews and meta-analyses from 2013 to 2019 to understand how discrimination affects health, finding 29 studies (US and international). They concluded that experiences of discrimination reported by adults are adversely related to mental health and indicators of physical health, such as overweight, other preclinical indicators of disease, health behaviours, utilisation of care and adherence to medical regimens. One of the included articles is Paradies et al. (2015), who conducted a meta-analysis on the relationship between reported racism and mental and physical health outcomes, analysing 293 studies (predominantly carried out in the US). They concluded that racism is significantly related to poorer health, with the relationship being stronger for poor mental health and weaker for poor physical health. However, overweight-related outcomes were the only physical health ones significantly associated with racism.
This is observed also in Europe, where a high prevalence of discrimination among migrants groups has found to be associated with obesity (Agyemang et al., 2021). This paper also highlights the stress of the migration process itself, which might subsequently have an impact on health through the adoption of risky behaviours. Furthermore, it is also important to consider the factors previously mentioned that affect diet and, as a consequence health, such as dietary acculturation and socioeconomic inequalities.
To conclude, while it is beyond the scope of this review to critically analyse all the factors that influence people's weight, some interesting issues have emerged that are specifically related to migrants and some ME groups. These needs to be considered when designing weight management programmes and services for these populations.
Weight Management Services and Programmes
This is an area where there is increasing attention, as weight is the biggest modifiable factor for T2D and it has been demonstrated that a significant weight loss can put diabetes into remission (Lean et al., 2019). In 2018 Scottish Government published it's Diet and Healthy Weight Delivery Plan, setting out five outcomes to support people to eat well and have a healthy weight. In support of Outcome 3, Scottish Government also published the Framework for the Prevention, Early Detection and Early Intervention of type 2 diabetes to ensure everyone across Scotland diagnosed with, or at risk of, type 2 diabetes has access to quality weight management services (Scottish Government, 2018).
Work is currently under way to develop and refine a new dataset that focuses on people at risk of T2D and their journey into and through NHS weight management services (Tier 2 and Tier 3). Public Health Scotland (2021) Referrals to NHS Board Commissioned Weight Management Services (Tier 2 and Tier 3) is the first report from this data and has been published as experimental statistics as this dataset is still being refined and improved. The report includes the number of referrals by ethnic group but caution is advised around interpreting this data as ethnicity was not known (missing) for a substantial portion of the data (31.4%):
- Nationally, 64.2% of individuals referred were White, 2.2% Asian/Asian Scottish/Asian British, 1.2% Other ethnic group, 0.6% African, 0.3% Mixed or Multiple ethnic groups, 0.1% Caribbean or Black.
- The Asian ethnic group had the lowest median BMI (BMI 38.0), as they are one of the groups with a lower BMI threshold for referral. Across NHS Boards, median adult BMI ranged from 34.7 to 42.9.
As this is the first report, the only information available at this time is the number of people being referred to weight management services, but not yet information about the numbers accessing and sticking with weight management services (WMS). However, this will be a regular publication from now on, with data from October 2020 to September 2021 currently being analysed by PHS and being published later this year. What the Scottish Government hopes to get from this new dataset is:
- If the people in weight management services are the ones then diagnosed with diabetes;
- If people are staying in or dropping out from these services;
- If they are dropping out, why? And what types of people are they?
- If they are staying, what are the outcomes?
Additional insights are offered by an 8 week Discovery project conducted by the Digital Transformation Service working on behalf of the Scottish Government Diet and Healthy Weight Team (Digital Scotland, 2021). The aim of this work was to explore the experiences of people living with a higher weight (including those with T2D) in areas of high deprivation with NHS weight management services and healthcare professionals. This is to better understand patients' needs, access and barriers to services and reduce health inequalities.
The results of this work show that language is the biggest barrier for ethnic minorities accessing WMS. Although translation services are provided in some cases, health practitioners struggle to engage with some people who don't speak English, as they might need longer appointments. Furthermore, additional challenges are faced by people living in deprived communities, including from ME. They might face difficulties in accessing digital services, more unhealthy food options are available in those areas, and someone might not be able to cook from scratch. Furthermore, weight management is not seen as a priority in a situation where people need to deal with housing, a limited budget and sometimes mental health.
Academic research shows that weight management may be a particularly thorny issue in diabetes prevention and care, as this is an area where health outcomes can be poorer for ME groups compared to the white population. Goff (2019) reports that in the US, it was observed that African Americans attending a diabetes prevention programme achieved on average half of the weight loss than that achieved by White Americans.
Other studies found more positive results, for example Bhopal et al. (2014)'s evaluation of a weight management programme for South Asian communities in Scotland. However, these were still relatively modest.
To conclude, very limited evidence exists and more research is needed to understand what helps to improve referral, engagement, persistence and effectiveness of weight loss services and programmes for those in ME groups. Work is currently underway in the Scottish Government and Public Health Scotland to improve the available evidence on referrals, including by ethnicity, to weight management services and statistics on the numbers of people accessing, attending and sustaining weight management programmes. Section 6 provides more details on WMS in the context of prevention and treatment of T2D.
Contact
Email: socialresearch@gov.scot