Technical, Logistical, and Economic Considerations for the Development and Implementation of a Scottish Salmon Counter Network: Scottish Marine and Freshwater Science Vol 7 No 2
This report provides an extensive review of electronic counter technologies and their potential for implementation in Scotland’s rivers. We consider all major types of proven counter technologies and software implemented by companies and government agenci
3.0 Software: Automating Counts and Quality Control
3.1 Existing Software
3.1.1 DIDSON Software
Sound Metric Corporation - DIDSON 300: DIDSON Display and Control Software
The DIDSON Display and Control Software ( DCS) is Sound Metric's proprietary software for the DIDSON line of multibeam sonar systems. This Windows-based software functions as the main control module and data processing software for the DIDSON. Along with a computer, DCS is required in the daily operation and data collection of sonar files (.ddf) from the DIDSON. The software is included with the purchase of a sonar unit; DIDSON purchasers can obtain future software upgrades at no additional cost.
Data Collection
DCS can control the frequency, ping rate, duration, schedule of collection and the file size of the data collected (Martignac et al . 2014). Changing the frequency and ping rate allows for a range of image qualities. The duration and file size settings provide options for collecting smaller, more frequent, data files providing easier transfer and manipulation of data. While file corruption rarely occurs, less information is lost if the data files are small. The record scheduling setting provides users with options in subsampling. In systems where target population sizes are large, the DIDSON can be controlled by DCS to automatically collect data according to a set schedule (Maxwell and Gove 2004).
Data Processing
DCS provides the user with various tools to streamline and optimize data processing. Figure 3.1 provides a preview of the software's interface. Below are descriptions of the notable functions:
- Background subtraction: Static repeating background is removed with this function. After the function is applied, only signals of moving objects theoretically remain, aiding in the efficiency of fish detection.
- Convolved samples over threshold ( CSOT) tool: Periods of inactivity within the collected data are removed with this function. With the function applied, only periods with fish passage remain. Another function with CSOT is a size threshold (in cm 2). Once this threshold is set, objects smaller than the threshold are filtered out which enables the targeting of specific species.
- Correct transmission loss: Differences in fish echo intensity in relation to their distance from the sonar head is equalized with this function. This increases the image quality of objects at far range.
- Display echogram mode: Converts the swath-mapping (fan) display into an echogram, where the central beam is plotted in relation to distance from the sonar head in a time series.
- Mark fish: Fish length is determined automatically for a particular object selected by the user. Once selected, the data can be exported to a separate text file.
- Measure: Fish length, width and distance can be measured manually with this function.
- Playback: This function is very similar to video players. Data can be played continuously, frame by frame, in reverse, and paused. In addition, the frame rate can be adjusted to accelerate viewing speed.
- Rectangular display: Stretches the swath-mapping (fan) display into a rectangular display.
- Zoom: Magnifies the ensonified image of the users selected region.

Figure 3.1. DIDSON DCS interface depicting the sonar's ensonification region.
Data Export and Analysis
Apart from the ability to export the lengths of manually selected fish, the DCS does not have the ability to automatically detect fish and export the data (Rakowitz 2009). A user is required to watch and enumerate objects that resemble fish manually using a counter (e.g., tally wacker) (Cronkite 2006). DCS's CSOT function provides significant time savings by eliminating data with no activity. Although this function sounds beneficial in theory, we have not tested its accuracy. There have been reported cases of the CSOT eliminating data files containing target fish (H. Enzenhofer, pers. comm.; F. Martens, pers. comm.; D. Peard, pers. comm.). To the best of our knowledge, the DIDSON DCS also does not have additional analysis functions for displaying data in a graphical format.
Recommendations
Although the DIDSON DCS provides time saving functions for the enumeration of fish, the lack of an automated fish detection feature requires a large time investment for manual analysis. Third party software such as Echoview is recommended to save analysis time.
3.1.2 Echoview Software
Sonar data is typically collected in a proprietary video format developed by each manufacturer. Traditionally, the data is analyzed manually by an operator watching and identifying ensonified images or by the equipment's proprietary software. There are many advantages in using the human eye for manual enumeration of fish. The ability to discretionally recognize specific images and patterns, combined with background knowledge, enables operators to identify errors during manual analysis that may not be recognized by automated software. This must be balanced against the significant time investments required to conduct manual counting, particularly when fish migration is over an extended period of time. Software analysis of sonar data varies depending on the program being used, but in general they all share the same advantages. Software can process large amounts of data very quickly, detect anomalies the human eye cannot see, automate analysis, and offer objective results. Combining both human and automated analysis methods can generate confident estimates.
Echoview Software Pty Ltd: Echoview 6.1
Echoview Software Pty Ltd. was established in 1995 in Tasmania, Australia. Echoview 6.1 is a third party Windows-based program used for visualization and analysis of hydroacoustic data. Version 6.1 of the software was released in January 2015; a new iteration of the software is scheduled to be released in 2016. Echoview is an industry standard software package with the ability to read ensonified data in multiple proprietary sonar recording file formats such as the Simrad (EK60, ES70, EK80 and ME70), BioSonics (DT-X), HTI (Models 241 and 244), Sound Metrics ( DIDSON and ARIS), Kongsberg Mesotech (M3, SM20 and EM Series), Reson (SeaBat T20, 6K, 7K and 8K Series), Furuno (FQ80, ETR-30N and FCV-30), BlueView (2D imaging sonar), RDI ADCP (Workhorse series) and ASL AZFP. For the purpose of our analysis, we evaluated Echoview using data collected by DIDSON multibeam sonars.
Template Creation in Echoview
Multibeam sonars emit sound waves directionally in a fan-like shape, collecting data that is visualized within a swath. Echoview software operates by applying virtual algorithm variables in sequential steps to yield various processing effects. An example of the data manipulation flowchart used in our analysis is shown in Figure 3.2. A data manipulation template can be created using a data file over a short time period. After the template is fine-tuned and perfected, the template can be applied to multiple data files to perform the same actions on the whole dataset, thus saving a significant amount of processing time for the user.
When a DIDSON data file is imported into Echoview, the multibeam data is displayed as a virtual echogram, where the ensonified images are stitched together into a video-like format. Ensonified objects are plotted in relation to the angle of beams and distance to the sonar head. Repeating background objects are removed using the "Multibeam Background Removal" variable ( Figure 3.2). The remaining echoes are amplified using the "Beam Dilation Filter 3 x 3" variable. Next, clusters of objects in each data frame (referred to as pings by Echoview) are identified as fish by the "Multibeam Target Detection" variable. Size classes are then removed using the "Length Filter" variable. Next, the multibeam data (angle of beams vs. range to sonar) is converted into a time series of single beam data (ping vs. range to sonar) by applying the "Target Conversion" variable. This display enables Echoview to group detected clusters together into fish tracks. Lengths are colour coded in relation to time as a quality control variable using " TS Substitution Length Review", and direction of travel is detected in relation to time using " TS Substitution Angle Review". Creating and applying the data manipulation flowcharts is not an intuitive process. For our analysis, this was only possible after initial training (see the "Echoview training" section for an overview of time used in training). We analyzed data from two different DIDSON configurations in our case studies: Kitwanga River using a low resolution (0.7 MHz) setup, and Mitchell River using a high resolution (1.8 MHz) setup. Creating and fine tuning of the procedures described in Figure 3.2 for low resolution data took approximately 6 hours (refer to Case Study 1, Section 3.1.2) and creating and fine tuning of the flowchart for high resolution data took approximately 5 hours (see Case Study 2, Section 3.1.2).

Figure 3.2. Echoview's data manipulation flowchart used in Case Study 1. (a) A single echogram ping of DIDSON data, with an image of Fish #1 ensonified. (b) Same image as (a) but with the background removed and beam dilation filters applied. Fish #1 is the only object remaining after the variables are applied. (c) Virtual echogram converted into a time series of single beam data, with each ping displayed next to one another. Ping 1250 from (a) and (b) are displayed within the thin rectangular box. The fish tracking setting is applied, showing a trace of Fish #1 in the water column in relation to time (blue line). (d) Time series of single beam data, displaying the length of each ensonified object in relation to time. The same coloration indicates objects with similar lengths. Fish #1 is shown as the purple line, and ping 1250 is displayed within the thin rectangular box. (e) Time series of single beam data, displaying the angle of each ensonified object in relation to the sonar head through time. The full rainbow coloration indicates a track of movement from one edge of the ensonified region to the next. Fish #1 is shown as the rainbow line, and ping 1250 is displayed within the thin rectangular box.
Automating Data Analysis using Scripts
After the creation of a data manipulation flowchart, a user is required to apply the template for the detection of fish track data. Although there are already significant time savings yielded by automated analysis of the multibeam data (e.g., in contrast to watching the files in real time), the process of opening a file, applying a template and exporting fish tracks for every DIDSON data file is time consuming. Raw DIDSON data from Case Study 1 was split into 184 files (31 hours of data, 10 min each file). Data from Case Study 2 was split into 48 files (16 hours of data, 20 min each file). Applying templates for every file becomes extremely time consuming. Fortunately Echoview has the ability to automate this process by using scripts.
Echoview supports various forms of scripting language, such as: Visual Basic, Visual Basic for Applications, R, Matlab, JScript, Java script, Borland C++ Builder, Delphi, Visual C++, C# and Visual J++. By creating a script in any of the above languages, data files can be analyzed by Echoview automatically with the push of a button. The script opens each data file, applies the template, and exports the fish tracks into a .csv file without human supervision. Although the time savings of using a script for one file is trivial, it becomes significant when it is applied to many data files. In our analysis, we were able to modify an existing Microsoft Visual Basic script provided by Echoview after our initial training (see the "Echoview training" section for an overview of time used in training). Four hours were required to understand and modify the script for our case studies (refer to Case Studies 1 and 2). We were then able to pre-process data overnight without supervision. Fish tracks for Case Study 1 were completed in 116 min, and fish tracks for Case Study 2 were completed in 41 min. Time requirements for this automated analysis will vary with the processing speed of the computer.
Verification of Echoview Data
The last step of analysis is verification by the user. This step is necessary to identify whether the software's fish track detections are true or not. Depending on the quality of the collected video data and template parameters set by the user, the efficiency of this process can vary considerably. After the verification process, the data is exported into a .csv file for further analysis. Timestamps, fish length, positioning data and many other variables can be generated and exported automatically. Although the initial template setup and this verification process are extensive, significant time savings remain as a result of using the software to perform the bulk of the analysis. With the low-resolution data (see Case Study 1), the verification averaged 1 min per fish ( Table 3.1). With the high-resolution data (see Case Study 2), verification averaged around 0.5 min per fish ( Table 3.2). For a comparison of Echoview to manual analysis, see section "Cost and effectiveness of Echoview analysis to manual analysis" in addition to Case Studies 1 and 2.
Table 3.1. Summary of time requirements and number of fish enumerated from Case Study 1: Kitwanga River Steelhead enumeration using low-resolution DIDSON data using Echoview.
| Kitwanga River Analysis | 1 | 2 | 3 | 4 | Total |
| Total amount of data (hrs) | 8.33 | 7.17 | 7.33 | 7.83 | 30.67 |
| Echoview analysis | |||||
| Verification time-Echoview (hrs) | 2.00 | 2.00 | 4.33 | 5.50 | 13.83 |
| Number of fish detected-Echoview | 94 | 96 | 288 | 322 | 800 |
| Average processing time per fish (min) | 1.28 | 1.25 | 0.90 | 1.03 | 1.04 |
| Manual analysis | |||||
| Total analysis time-Manual (hrs) | 4 | 4 | 4 | 4 | 16 |
| Time savings (%) | 50% | 50% | -8% | -37.5% | 13% |
Table 3.2. Summary of time requirements and number of fish enumerated from Case Study 2: Mitchell River Sockeye migration estimation using high-resolution DIDSON data using Echoview
| Mitchell River File # | 1 to 24 | 25 to 48 | Total |
| Total amount of video (hrs) | 8 | 8 | 16 |
| Echoview analysis | |||
| Verification time-Echoview (hrs) | 2.3 | 2.6 | 4.9 |
| Number of fish detected-Echoview | 296 | 395 | 691 |
| Average processing time per fish (min) | 0.47 | 0.40 | 0.43 |
| Manual analysis | |||
| Total analysis time-Manual (hrs) | 3 | 3 | 6 |
| Time savings (%) | 23% | 13% | 18% |
Total Time Estimation in a Typical Analysis
Table 3.3 depicts a summation of the total time required for fish enumeration analysis using DIDSON data. After completing our initial training (refer to "Echoview Training" section), the flowchart template and script modification were relatively simple to complete. Manual verification for both analyses required the most time. Compared to the Kitwanga River analysis (Case Study 1), the reduction in time of the Mitchell analysis (Case Study 2) was due to increased data quality and resolution.
Table 3.3. Summary of total time requirements for DIDSON data analysis using Echoview. Verification is the average time of all fish analyzed.
| Case Study | Data Resolution | Flowchart Template Creation | Script Creation | Verification |
| Kitwanga River | Low (0.7 MHz) | 6 hrs | 4 hrs | Average 1 min per fish |
| Mitchell River | High (1.8 MHz) | 5 hrs | 4 hrs | Average 0.4 min per fish |
Echoview Training
Since analyzing stationary multibeam sonar data is very specific, information on training time requirements is lacking. Depending on the level of sonar knowledge and scripting experience the user has, training time will vary. In our analyses, we did not have any previous sonar or scripting knowledge. We were provided with an Echoview license, DIDSON video data, and manually enumerated DIDSON data. Training was complete when we were able to replicate the information from the manually enumerated counts. Time requirements and accuracy of our results from Echoview were compared to manually enumerated data in the following case studies. An estimated cost of training for a MSS biologist is shown in Table 3.4. Note that Echoview offers a three-day training course at a rate of £575. We cannot speak to the effectiveness of this training course. Learning how to use Echoview software is broken into the following steps:
Basic Understanding - 17 hours
This step involved general familiarity with Echoview, navigating the software, reading and loading raw files, understanding echograms and interpreting virtual variables. Echoview's self-education manuals were used to facilitate this learning process.
Intricate Understanding - Additional 75 hours
This involved tasks such as adjusting filters, removing background noise, enhancing signals, detecting fish tracks, counting fish, exporting data and QA/ QC of exported data. Echoview's self-education manuals, YouTube channels, a user forum and scientific literature were used to facilitate this learning process. A one-year technical support service was included with our lease of Echoview which we used extensively to facilitate the learning process.
Scripting and Automating Analysis - Additional 25 hours
This stage involved learning how to update existing Microsoft Visual Basic Scripts to enable automation of Echoview. Echoview staff provided an example script which we modified for use in both case studies.
Table 3.4. Estimation of training cost in relation to the hourly rate of a MSS biologist.
| Task | Hours required for training | Cost to MSS (£50/hour) |
| Basic Understanding | 17 | £850 |
| Intricate Understanding | 75 | £3,750 |
| Scripting Knowledge | 21 | £1,050 |
| Total | 113 | £5,650 |
Software Cost
Echoview is separated into 13 specific modules that can be purchased or leased separately to answer specific questions. In our analyses, six modules were required: base, bathymetric, fish tracking, stationary sonar, scripting and analysis export (see Table 3.5 for a cost summary). With the lease or purchase of a new license, Echoview includes a free 12-month maintenance and support contract (Echoview Upgrade & Support Agreement - EUSA). We found the EUSA to be invaluable and Echoview's staff were very willing to offer assistance.
Table 3.5. Cost summary of Echoview software modules used in analysis.
| Modules | 4-week lease cost (minimum lease period) (£) |
Cost (£) |
| Base | 206.80 | 1654.40 |
| Bathymetric | 206.80 | 1654.40 |
| Analysis Export | 523.60 | 4188.80 |
| Fish Tracking | 265.11 | 2120.96 |
| Stationary Sonar | 356.33 | 2850.56 |
| Scripting | 211.53 | 1692.16 |
| Total | £1770.16 | £14 161.28 |
Cost and Effectiveness of Echoview Analysis Compared to Manual Analysis
In our analyses, we found the amount of time required for Echoview's verification process to be highly variable. With the low-resolution data, the verification averaged 1 min per fish ( Table 3.1). With the high-resolution data, verification averaged approximately 0.5 min per fish ( Table 3.2). Data quality significantly enhanced Echoview's ability to detect fish tracks and reduced the amount of manual verification.
Manual analysis times were provided by the Ministry of Environment British Columbia ( MOE) for Case Study 1; and by the Department of Fisheries and Oceans Canada ( DFO) for Case Study 2 ( Tables 3.1 and 3.2). Manual time estimates also included extra time used to perform quality assurance and control, and record physical data. Manual data analyses were viewed in fast-forward, ranging from 5 to 12 times the speed of normal data collection in order to save time. It should be noted that the analysis times are an estimated average, which could vary depending on the accuracy requirements and extra data (length estimates, timestamps, and signal strengths) of specific projects.
There are two main constraints operators face when manually analyzing multibeam sonar data: budget and time considerations, and effectiveness of analysis ( Figure 3.3). Budget and time constraints force users to increase viewing speed of the DIDSON data in order to complete the analysis on time. This typically results in reductions in the effectiveness of fish counts resulting in missed or misidentified fish (refer to Case Study 1). Increased effectiveness is achieved by reductions in viewing speed, resulting in additional time and costs (refer to Case Study 2). From our analyses, Echoview balances the trade-off between these two constraints by providing objective results in a relatively short period of time.

Figure 3.3. Flowchart illustrating budget and effectiveness trade-off in manual analysis.
Echoview Advantages
Echoview has the ability to apply templates to data in subsequent years or data from similar sites. Since sonar deployment sites are typically stationary, the physical characteristics of a site are similar every year. Thus, applying a set template to similar data is relatively easy and requires only minor modifications. Compared to manual methods, the use of Echoview also integrates an objective method into analyses. Since manual analysis of a DIDSON dataset would require multiple people, additional error could be incorporated into estimates as a result of different interpretations of the data. Once an Echoview template and script are created, it is relatively easy for a trained Echoview user to instruct a naïve user to perform manual verification. This eliminates the need to fully train all staff in the use of Echoview. Echoview also has the ability to interpret fish tracks that are impossible to detect by the naked eye with low-resolution DIDSON data. This aspect is further explored in Case Study 1.
Echoview Disadvantages
There are some disadvantages in the use of Echoview. The initial investment in Echoview is relatively high. The amount of cost savings after the initial investment is dependent on the duration and number of projects the software can be applied to. While the software has the ability to identify and determine the lengths of moving objects in hydroacoustic data, it becomes problematic when the migration density of fish is high (Case Study 2). Fish that are too close together are often ensonified as one object; while teasing apart the fish signal is possible, it is a time consuming task. The additional time required to perform this task may not be as efficient compared to manually analyzing the data. Moreover, the length estimates from these fish may be inaccurate as the signals are mixed together and difficult to separate. In Case Study 1, we found the DIDSON lacks the ability to detect smaller fish at distances further than 15 m. Due to the decreased signal sizes at long ranges, fish sizing seemed to be inaccurate under long range detection. While this may not be a fault in Echoview, it should be noted that Echoview's results are completely dependent on the quality of the raw DIDSON data.
3.1.2.1 Case Study 1 - Kitwanga River Steelhead Enumeration Using Low Resolution (0.7 MHz) DIDSON Data
Introduction
Ministry of Environment of British Columbia ( MOE) collected abundance data for summer steelhead ( Oncorhynchus mykiss) using a DIDSON hydroacoustic system. Such data is important for management purposes, however, the cost of analyzing the DIDSON data from the Kitwanga River are prohibitive due to the high number of person hours required to interpret data. Enumerating the migration of steelhead in the river requires manual analysis of the DIDSON data, where an operator watches the DIDSON video and counts the fish observed. Every fish in the video are interpreted and measured to determine the species and other physical data, and requires the operator to watch the video in real time. Time constraints do not make it practical to perform a manual analysis on an annual basis. Therefore, Echoview software was tested to determine the feasibility of using it as a cost-effective tool for the data analysis component. The goal of this study is to compare the effectiveness and efficiency of manual enumeration to semi-automated enumeration using Echoview. The efficiency analysis is reported in Section 3.1.2; the accuracy analysis is reported below. The DIDSON raw data and manually-derived results were provided by MOE.
Methods
Study Site
The Kitwanga River is a fifth-order river in the lower Skeena watershed in the North West region of British Columbia, Canada. Kitwanga is a small but biologically-rich river system, with a total mainstem length of 59 km and a drainage area of approximately 83 000 hectares (Cleveland, 2000). The Kitwanga River supports six species of Pacific salmon, including Chinook salmon ( O. tshawytscha), chum salmon ( O. keta), coho salmon ( O. kisutch), sockeye salmon ( O. nerka), pink salmon ( O. gorbuscha), kokanee salmon ( O. nerka) and steelhead ( O. mykiss). Resident rainbow trout ( O. mykiss), cutthroat trout ( O. clarki) , Dolly Varden ( Salvelinus malma) , bull trout ( S. confluentus) , mountain whitefish ( Prosopium williamsoni) and various other species of coarse fish also reside in the river (Grieve and Webb, 1997). Kitwanga summer-run steelhead typically commence their spawning migration into Kitwanga River from mid-April until the end of May, during freshet flows.
DIDSON Installation
All raw data was collected by MOE from 20 April to 30 May 2013 using a DIDSON 300 sonar unit (Sound Metrics Corp.). River substrate consists of cobble to small boulders, with no large woody debris at the sample site. Water velocity averaged around 1.5 m/s during peak flows. Hydraulic conditions at the DIDSON site were laminar and unidirectional. The river cross sectional wetted width was approximately 26 m, with an average water depth ranging 0.05 to 0.5 m, and maximum depth of 1.2 m at peak freshet. Water clarity was variable, with clarity decreasing significantly during freshet flows. The counter was mounted on a specially designed metal frame, anchored to the river bottom, angled to ensonify the water column from bank to bank. Data was collected on the low frequency setting (0.7 MHz) with a capture range of 0.83 to 40 m in front of the sonar head. A 1.5 m diversion fence was mounted perpendicular to the river channel to divert steelhead a minimum of 1 m from the DIDSON to ensure steelhead migrate within the field of view. The fence was located approximately 0.4 m downstream of the DIDSON counter, anchored to concrete lock blocks on river left. A concentration lens was attached to the DIDSON to focus the beams into the appropriate water depth for the site of the counter, providing a data capture angle of 29° horizontal by 3° vertical (pers. comm. D. Peard). DIDSON data was collected using Sound Metric Corp's proprietary Display and Control Software ( DCS). The DIDSON DCS was set to record a new file every 10 minutes. 184 files collected between 20 April to 26 April 2013 were used in IFR's comparative analysis. This subset of data was chosen by IFR staff because it represented a range of daily steelhead migration rates (10 to 280 fish per day).
Manual Analysis
The manual enumeration of steelhead was completed by biologists. 184 DIDSON data files were analyzed by watching each file using DIDSON DCS. For the purpose of enumerating steelhead, only fish greater than 83 cm in length were identified as steelhead and included in the escapement estimate. All fish measured as less than 83 cm in the DCS software were intentionally untracked and not recorded. The biologist manually measured each fish that migrated past the sonar beam and determined its length, using the measurement tool provided by the software. If the fish was deemed longer than 83 cm, a timestamp, fish length, distance from sonar head, and direction of travel were recorded. The total amount of time estimated to analyze the data manually was recorded for comparison (See Section 3.1.2).
Echoview Analysis
Echoview (Version 6.1, Echoview Software Pty Ltd.) was used for the semi-automated enumeration of steelhead. Following the steps described in Section 3.1.2 - "template creation in Echoview", "automating data analysis using scripts", and "manual verification of Echoview data", the same 184 DIDSON data files used in the manual analysis were evaluated. Timestamps, lengths, distance from sonar head, and direction of travel of all fish seen by Echoview were exported into Microsoft Excel, and no size cut-offs for steelhead were used in the Echoview analysis.
Comparative Analysis
Using the timestamps and distance from sonar head, fish identified in the manual analysis were matched with fish identified in the Echoview analysis. Graphs of fish identified by the two methods were plotted using R (R Development Core Team 2009). Fish lengths and signal strength data plotted were determined by Echoview. Note that all fish identified through the manual enumeration method were identified by Echoview, suggesting that Echoview was at least as efficient as manual enumeration in detecting fish.
Results and Discussion
Fish Length and Distance from Sonar
Fish detected by the manual analysis were all determined to be greater than 83 cm, while length estimates generated by Echoview show the determined targets vary above or below 83 cm ( Figure 3.4). Only fish greater than 40 cm (determined by Echoview) were plotted in our analysis, as virtually all fish below 40 cm were not tracked in the manual analysis. This suggests fish below 40 cm were purposely untracked as they did not resemble the target species (steelhead, if > 83 cm). Between 0.83 to 9 m from the sonar (near-bank), a number of fish determined by Echoview to be only above 40 cm were detected by manual analysis as greater than 83 cm. Between 9 to 18 m from the sonar (mid-river), and 18 to 26 m from the sonar (far-bank), manual detection appeared to decrease in comparison to Echoview's detections. In general, there was also a decrease in the variance of fish size as distance from the sonar head increased; this was shown by a general lack of fish in the far-bank section below 50 cm and above 80 cm in length observed by Echoview. These results were likely due to a reduction of signal strength with increasing distance from sonar, leading to a lower detection probability ( Figure 3.6). The decrease in signal strength may lead to a reduction in image quality, potentially causing length inaccuracies that lead to target species misidentification.

Figure 3.4. Estimated fish lengths using Echoview in relation to distance from sonar. The variance in Echoview-measured fish sizes decrease as the distance from the sonar increases. Blue points are fish detected by Echoview and identified as the target species (steelhead, > 83 cm) by manual analysis. Note the high number of blue points measured to be < 83 cm by Echoview, suggesting that the manual estimates of size differ in comparison to Echoview estimates of size. Orange points are all other fish detected by Echoview, and represent fish that are either missed by manual counts, or assumed to be < 83 cm during manual analysis and therefore not tracked. The hashed area illustrates an area not ensonified by the DIDSON, located between 0-0.83 m from the sonar head. A 1.5 m diversion fence diverts fish at a minimum of 1 m to ensure migration is within the field of view. Only fish > 40 cm determined by Echoview are plotted, as fish < 40 cm were purposely not tracked in the manual method since they were not the target species.
Signal Strength and Fish Length
Figure 3.5 further illustrates the difference of the 83 cm fish size cut-off generated by the manual analysis; the length estimates generated by both methods were significantly different. Using data from Echoview, fish length was not a determining factor of signal strength, as signal strength generally ranged between 80 to 90 decibels (dB) across all lengths of fish. Signal strength indicated that 90 dB was the maximum strength that can be attained by any size of fish. Most fish with high signal strength seemed to have a higher probability of detection in the manual analysis, as it translated to a better quality image. The lack of fish detected with signal strengths less than 80 dB suggested that any objects or fish below this threshold were undetected by both the manual and Echoview analyses, or were not ensonified by the DIDSON counter.

Figure 3.5. Signal strength in relation to fish length as determined by Echoview. Blue points are fish detected by Echoview and identified as the target species (steelhead, > 83 cm) by manual analysis. Orange points are all other fish detected by Echoview, and represent fish that are either missed by manual counts, or assumed to be < 83 cm during manual analysis and therefore not tracked. The dotted line illustrates the established 83 cm fish size cut-off for manual analysis. note the high number of blue points measured to be < 83 cm by Echoview, suggesting manual estimates of size differ in comparison to Echoview estimates of size. Only fish > 40 cm determined by Echoview are plotted, as fish < 40 cm were purposely not tracked in the manual method since they were not the target species.
Signal Strength, Fish Length, and Distance from Sonar Head
Figure 3.6 reiterates the trends shown in Figure 3.5, but separates the detection by distance from sonar. Data generated by Echoview show fish migrating 0 to 9 m from the sonar head ( Figure 3.6a) had a signal strength range of 83-90 dB. Fish migrating between 9 to 18 m and 18 to 26 m ( Figure 3.6b and c, respectively) had a signal range of 80-90 dB. For manual analysis, there was a decrease in detection probability as distance from sonar increased.
Signal strength was consistently high for all lengths of fish and did not increase with fish length in the 0 to 9 m section ( Figure 3.6a). High signal strength typically provided a clearly ensonified video image, which translated into a high proportion of fish detected for both methods of enumeration. For fish above 80 cm, migration only occurred between 0 and 9 m from the beam, however this may have been an artifact of the low frequency data collected. Signal strength started to decline from the upper threshold at 9 to 18 m away from the sonar ( Figure 3.6b) and continued to decline at 18 to 26 m away from the sonar ( Figure 3.6c). Due to the signal strength's positive correlation with a high image quality, it is evident that fish with lower signal strengths were not detected during the manual analysis. There is a possibility that fish in the far end of the ensonified region may have appeared shorter during the manual analysis due to images not fully ensonifying. This may have resulted in an under representation in length, causing the fish to appear less than 83 cm and not tracked as a steelhead. Steelhead (> 83 cm) could still be moving in the far-bank, but their length measurements may simply be inaccurate.
Manual Count Effectiveness, Signal Strength and Distance from Sonar
The probability of a fish being detected through manual analysis increased with greater signal strength ( Figure 3.7). Through IFR's own visual observations, Echoview's detection of increase in signal strength typically translated to a clearer image of fish in the DIDSON data. This could explain why there was an increase in proportion of counts detected during the manual analysis in relation to stronger signal strengths. Manual detection probability decreased with an increase in distance from the sonar ( Figure 3.8). The inability to see fish during the manual analysis, or fish appearing to be smaller than target size due to low signal strengths, could explain the decrease in proportion of counts detected at farther distances from the sonar ( Figure 3.9).

Figure 3.6. Signal strength in relation to estimated length as determined by Echoview. The variance in Echoview measured fish sizes decrease as the distance from the sonar increases. Blue points are fish detected by Echoview and identified as the target species (steelhead > 83 cm) by manual analysis. Note the high number of blue points measured as < 83 cm by Echoview, suggesting manual estimates of size differ greatly in comparison to in comparison to Echoview estimates of size. Orange points are all other fish detected by Echoview, and represent fish that are either missed by manual counts, or assumed to be < 83 cm during manual analysis and therefore not tracked. Only fish > 40 cm determined by Echoview are plotted, as fish < 40 cm were purposely not tracked in the manual method since they were not the target species.

Figure 3.7. Proportions of counts detected in manual analysis increase relative to signal strengths, as determined by Echoview. Only fish > 40 cm determined by Echoview are plotted, as fish < 40 cm were purposely not tracked in the manual method since they were not the target species.

Figure 3.8. Proportion of counts detected in manual analysis decrease relative to an increase in distance from sonar. The hashed area illustrates an area not ensonified by the DIDSON, located between 0-0.83 m from the sonar head. A 1.5 m diversion fence diverts fish at a minimum of 1 meter to ensure migration is within the field of view. Only fish > 40 cm determined by Echoview are plotted, as fish < 40 cm were purposely not tracked in the manual method since they were not the target species.

Figure 3.9. Sequential frames showing a fish migrating through the DIDSON imaging region at an average of 25 m away from the sonar head. Plots illustrate the difficulty of identifying fish manually at greater distances from equipment.

Figure 3.10. Proportion of counts detected in manual analysis increase relative to greater fish length, as determined by Echoview. The dotted line illustrates the established 83 cm fish size cut-off for manual analysis in enumerating Steelhead. Only fish > 40 cm determined by Echoview are plotted, as fish < 40 cm were purposely not tracked in the manual method since they were not the target species.
Manual Count Effectiveness and Fish Length
Fish determined to be above 80 cm by Echoview had a high proportion of counts detected as > 83 cm in manual analysis. The detection was likely high because fish determined to be > 80 cm by Echoview looked significantly larger on the DIDSON display ( Figure 3.10); it was unlikely they would be missed. For fish determined to be 40 to 80 cm by Echoview, a portion of the fish were considered to be > 83 cm by manual analysis while the rest were considered to be below. This inconsistency in sizing was likely due to the inability of the human eye to decipher small differences in length.
Conclusions
We found various inconsistencies in fish length determination between the two methods of analysis using low resolution DIDSON data. Since we do not have true lengths of fish data collected, length accuracy of both analysis cannot be validated. We can only conclude that there was a difference of lengths generated between the two methods. Although there are shortcomings in the software's ability to analyze fish data (e.g., low signal strengths translated to potentially inaccurate length analysis), we felt that Echoview provided an objective and automated approach in determining length. There was a reduction in effort and increase in objectivity in the results when Echoview was used. It should be noted for the most part, Kitwanga River steelhead move in a single file pattern and the Echoview software functions optimally with this type of data. If the migration pattern changed into a cluster-like formation, the efficiency of Echoview's fish detection algorithm can change significantly (see Case Study 2 below).
3.1.2.2 Case Study 2 - Mitchell River Sockeye Enumeration Using High Resolution (1.8 MHz) DIDSON Data
Introduction
The Mitchell River is one of three major spawning areas for sockeye salmon ( Oncorhynchus nerka) of the Quesnel River system in British Columbia, Canada. The river is a sixth-order stream located in the Cariboo Mountains Wilderness Park, east of Quesnel in central British Columbia. The Mitchell River supports five species of Pacific salmon, including Chinook ( O. tshawytscha), coho ( O. kisutch), sockeye ( O. nerka) and steelhead ( O. mykiss). Resident rainbow trout ( O. mykiss), Dolly Varden ( Salvelinus malma), bull trout ( S. confluentus), mountain whitefish ( Prosopium williamsoni) and various other species of coarse fish are reported in Fish Inventories Data Queries (accessed 20 June 2015). Sockeye salmon typically migrate from late August to late September. While sockeye typically move in a single file formation in this system, there are some instances where clusters of fish move past the sonar head at once. In 2009, a DIDSON hydroacoustic sonar was used to collect migration data on this population. Data were manually enumerated, where DIDSON data was reviewed to enumerate the number of fish that swam past the sonar head. For the purpose of this report, we analyzed the same DIDSON data using Echoview to determine the accuracy and efficiency of the software program. Raw data and manual count results were provided by Fisheries and Oceans Canada ( DFO). The efficiency of using Echoview as a data analysis tool is reported in Section 3.1.2.
Methods
Site Characteristics and DIDSON Installation
The DIDSON unit was deployed approximately 1 km downstream of spawning grounds and 7 km upstream of Quesnel Lake ( UTM: 10 U 648388 5853209). River substrate consisted of silt to large gravel with some large woody debris and in-stream vegetation on the left bank. Water velocity ranged between 1.0-2.0 m/s with a gradient of < 1%. Flow pattern at the DIDSON site was laminar and unidirectional with no obvious turbulence and a water depth of 1.5 m through the ensonified area. The stream cross section was planar, with a wetted width of approximately 35 m. Two weirs were installed on each bank to limit the fish migration corridor to 10 m in width. Water clarity was generally high, but turbidity increased during high rain events. Data was collected using a DIDSON 300 sonar unit (Sound Metrics Corp.). The unit was deployed using a modified ladder and adjustable pole mount (Enzenhofer and Cronkite 2005) and angled approximately -10° to -12°. By reducing the migration corridor to 10 m, the DIDSON could be deployed at the high frequency setting (1.8 MHz) to collect high-resolution images collected at 4 frames per second (fps). Forty-eight data files, each 20 minutes in duration, were collected on 1 and 2 September 2009 and used in IFR's comparative analysis (one 20 min file from every hour over 48 hours). Manual sockeye enumeration was completed by DFO, and enumeration using Echoview was conducted by IFR.
Manual Enumeration
A modified manual fish counting method described in Cronkite et al. (2005) was used by DFO. Fish were counted using a hand held counter (e.g., tally whacker) and both upstream and downstream counts were entered into a Microsoft Excel spreadsheet. Fish that moved towards, and crossed, the upstream edge of the ensonified area were counted upstream, whereas fish that crossed the downstream edge of the ensonified area were counted downstream. At the discretion of the operator, fish that visually appeared to be the correct species were enumerated. Files were analyzed at 60 to 80 fps (fast forward) during low migration periods, and the fps rate was lowered during periods of high migration. Of the 48 data files analyzed, 20 files were re-analyzed at random to determine operator accuracy; if these counts were different, an average of enumerated numbers was used. Time required to manually enumerate fish was provided by DFO. All data files were analyzed using the DIDSON display and control software ( DCS) provided by Sound Metrics Corp. The following features available in the software package were used in the analysis (Cronkite et al. 2005):
- Background subtraction
- Transmission loss correction
- Echogram
- Mark fish
- Measure
- Rectangular display
- Zoom
Software Enumeration
Echoview was used for this analysis. Following the steps described in Section 3.1.2, IFR analyzed the same 48 data files used in the manual enumeration. Timestamps, lengths, distance from sonar head and direction of fish travel were exported into Microsoft Excel. The total amount of time required to analyze the data was logged for comparison.
Comparative Analysis
Due to the low number of co-migrant species and high number of sockeye salmon, timestamp, length, and distance from sonar data were not collected. Fish from both analyses could not be paired up for a direct comparison. Only the total number of fish from each analysis was compared.
Results and Discussion
The total number of manually counted up and down fish were 627 and 110, respectively. The total number of Echoview counted up and down fish were 623 and 68, respectively. The difference in the number of observed up counts ranged between 0 and 9, while differences between down counts ranged between 0 and 14 for the two methods. Manual and Echoview comparisons are presented in Table 3.6 and Figures 3.11 and 3.12.
Table 3.6. Comparison of fish counts in manual and Echoview analysis files.
| File # | Length (min) | UP | DOWN | ||||
|---|---|---|---|---|---|---|---|
| Manual enumeration | Echoview enumeration | Difference | Manual enumeration | Echoview enumeration | Difference | ||
| 1 | 20 | 21 | 25 | -4 | 5 | 2 | 3 |
| 2 | 20 | 24 | 25 | -1 | 5 | 3 | 2 |
| 3 | 20 | 34 | 32 | 2 | 4 | 3 | 1 |
| 4 | 20 | 20 | 21 | -1 | 2 | 1 | 1 |
| 5 | 20 | 22 | 24 | -2 | 1 | 0 | 1 |
| 6 | 20 | 12 | 12 | 0 | 4 | 1 | 3 |
| 7 | 20 | 7 | 10 | -3 | 0 | 0 | 0 |
| 8 | 20 | 0 | 1 | -1 | 0 | 0 | 0 |
| 9 | 20 | 0 | 0 | 0 | 0 | 0 | 0 |
| 10 | 20 | 0 | 1 | -1 | 0 | 0 | 0 |
| 11 | 20 | 0 | 3 | -3 | 0 | 0 | 0 |
| 12 | 20 | 0 | 0 | 0 | 0 | 0 | 0 |
| 13 | 20 | 0 | 0 | 0 | 0 | 0 | 0 |
| 14 | 20 | 0 | 0 | 0 | 0 | 0 | 0 |
| 15 | 20 | 0 | 0 | 0 | 0 | 0 | 0 |
| 16 | 20 | 0 | 0 | 0 | 0 | 0 | 0 |
| 17 | 20 | 0 | 0 | 0 | 0 | 0 | 0 |
| 18 | 20 | 0 | 0 | 0 | 0 | 0 | 0 |
| 19 | 20 | 0 | 0 | 0 | 0 | 0 | 0 |
| 20 | 20 | 0 | 0 | 0 | 0 | 0 | 0 |
| 21 | 20 | 0 | 1 | -1 | 0 | 0 | 0 |
| 22 | 20 | 43 | 43 | 0 | 10 | 5 | 5 |
| 23 | 20 | 44 | 41 | 3 | 19 | 5 | 14 |
| 24 | 20 | 33 | 34 | -1 | 2 | 3 | -1 |
| 25 | 20 | 26 | 17 | 9 | 6 | 4 | 2 |
| 26 | 20 | 34 | 30 | 4 | 0 | 3 | -3 |
| 27 | 20 | 31 | 22 | 9 | 2 | 6 | -4 |
| 28 | 20 | 19 | 14 | 5 | 4 | 1 | 3 |
| 29 | 20 | 17 | 12 | 5 | 0 | 0 | 0 |
| 30 | 20 | 28 | 22 | 6 | 3 | 7 | -4 |
| 31 | 20 | 6 | 7 | -1 | 3 | 1 | 2 |
| 32 | 20 | 25 | 24 | 1 | 2 | 2 | 0 |
| 33 | 20 | 1 | 6 | -5 | 0 | 0 | 0 |
| 34 | 20 | 0 | 3 | -3 | 0 | 0 | 0 |
| 35 | 20 | 0 | 4 | -4 | 0 | 0 | 0 |
| 36 | 20 | 0 | 2 | -2 | 0 | 0 | 0 |
| 37 | 20 | 0 | 1 | -1 | 0 | 0 | 0 |
| 38 | 20 | 0 | 0 | 0 | 0 | 0 | 0 |
| 39 | 20 | 1 | 1 | 0 | 0 | 0 | 0 |
| 40 | 20 | 20 | 20 | 0 | 0 | 0 | 0 |
| 41 | 20 | 0 | 0 | 0 | 0 | 0 | 0 |
| 42 | 20 | 0 | 0 | 0 | 0 | 0 | 0 |
| 43 | 20 | 0 | 0 | 0 | 0 | 0 | 0 |
| 44 | 20 | 0 | 0 | 0 | 0 | 0 | 0 |
| 45 | 20 | 10 | 14 | -4 | 3 | 3 | 0 |
| 46 | 20 | 85 | 82 | 3 | 22 | 8 | 14 |
| 47 | 20 | 32 | 34 | -2 | 8 | 8 | 0 |
| 48 | 20 | 32 | 35 | -3 | 6 | 2 | 4 |
| Sum | 960 | 627 | 623 | 4 | 110 | 68 | 42 |
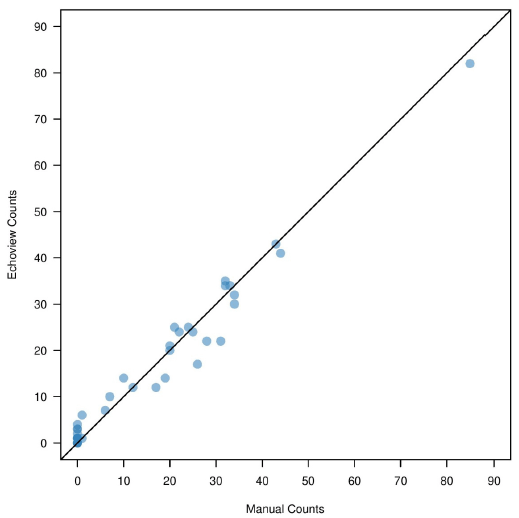
Figure 3.11. Comparison of up count fish between Echoview and manual analysis. Each point represents a separate analysis file.

Figure 3.12. Comparison of down count fish between Echoview and manual analysis. Each point represents a separate analysis file.
It is difficult to determine the exact reason for the count discrepancies between the two methods. Assumptions made by the DFO operator performing manual counts could have generated the observed difference in fish numbers. Since species identification was determined visually by estimating fish size, misidentification would result in different numbers of fish detections in the manual analysis. By watching the data at 60-80 fps manually, fish could have been overlooked during periods of low migration. The averaging of counts for files that were re-analyzed during the manual enumeration may also explain differences in fish numbers. High migration periods caused both methods to have difficulty determining fish numbers within a moving cluster ( Figure 3.13). For manual counts, the number of detected fish in these clusters could be subjective based on the operator's ability to track every fish ( Figure 3.13). In Echoview, it was equally difficult to determine the number of fish in clusters (e.g., ≥ 5 migrating). By watching the raw video while analyzing fish tracks, we had enough information to tease apart the majority of fish signals, but this was very time consuming and also somewhat subjective. In general, difficulty increased when individuals passed through the ensonified region in a cluster.

Figure 3.13. Raw DIDSON data during high migration periods, where sockeye salmon moved in a cluster formation. Both images show the difficulty in determining exact numbers of fish within the cluster.
Conclusions
Echoview provided similar counts to manual enumeration. For periods of low or single-file migration, the software was able to determine fish length and numbers with ease. Compared to Case Study 1, the high-resolution image quality enabled us to verify each fish faster. A comparison of estimated fish lengths between the two methods could not be made, as fish were not measured during the manual analysis. Accurate counts for clusters of fish were difficult for both methods.
3.1.3 BlueView
Teledyne BlueView Inc. - BlueView: ProViewer 4.2
ProViewer is a Windows-based program designed to view and record live imagery from imaging sonar and sonar data files (.son). This software is provided by the manufacturer as a free download from their website, or a CD provided with the purchase of a transducer. ProViewer provides basic features to set up and operate the sonar units, and allows users to record, open and view saved .son files.
System Requirements:
- Windows XP (Service Pack 3), Windows 7
- Dual-core CPU or better
- 1 GB or more of RAM
- 100 MB or more of free space
- .NET Framework installed
- Internet access
- Dedicated Ethernet port
Setup
Setup of the system is straightforward. Comprehensive reference documents (Software Handbook provided by BlueView) guide users through the process. Once the software has been connected to the sonar, users have the ability to adjust various settings to suit their data recording needs, which include:
- Range controls: Controls range to which sonar will image.
- Image rotation: Rotates sonar imagery to an angle defined by the user, dependent on mounting of sonar.
- Record: Save sonar data in proprietary file format (.son). The sonar data can be accessed at a later date and exported to a variety of standard formats such as .avi.
In previous software versions, users were not able to automate and control the recording times or file sizes. Users also had to manually start and stop the recording. If left recording for extended periods of time, one large file was created, increasing the risk of data corruption and loss. The current version (4.2) still does not support pre-set recording times, but does enable users to set the maximum sonar file size that can be recorded. Once this size is reached, the current file is saved and a new file will be created.
Play-Back
When a .son file is loaded through the software, users have various controls to view the recording. By default, range arcs and labels are superimposed on the recorded images. These provide a visual indication of how far objects or fish are from the sonar head, and can be toggled off if desired. Controls include:
- Play and Pause
- Next ping: Allows users to advance one ping at a time.
- Previous ping: Allows users to reverse one ping at a time.
- Fast Forward and Fast Reverse: Users can playback at faster rates. Four levels of speed in each direction are available.
Data Processing and Analysis
ProViewer does not offer any data analysis or processing capabilities. During playback of a file, users can modify the display options to fine tune video resolution:
- Sound speed: Depending on environmental conditions, the speed of sound value may need to be adjusted to attain better sonar imagery.
- Color map: This refers to the colours used to display the sonar image. Different colour maps have different characteristics to suit various operations. Some offer high image definition but low contrast, and vice versa.
- Sensitivity: Image sensitivity can be adjusted to improve image quality. For example, lowering the intensity will allow more of the background to be displayed, while increasing it will suppress background noise and increase the contrast of the image.
- Intensity: Intensity controls the brightness of the image.
- Gamma: This feature allows users to control the intensity or brightness at which the various colour maps are displayed.
- Measurement tool: A simple length measurement tool allows users to measure the distance between two user-defined points.
- ProViewer provides users options for exporting previously saved sonar data into several formats. Export options include screenshots, subset (range of pings) and video (range of pings in an AVI movie file).
Recommendations
Overall, ProViewer should only be considered as a viewing and operating software as it does not give the user the capability of automatically counting or tracking individual fish. For more detailed data analysis and processing, third party software is recommended.
3.1.4 Vaki
VAKI - Riverwatcher Counter: Winari Software
Winari is VAKI's proprietary Windows-based software designed to analyze and present data recorded with a Riverwatcher fish counter. Winari has three main functions: transfer data from the Riverwatcher unit, store and manage data retrieved from the unit and present the data in an organized format for the user. Winari is not required in the daily operations and data collection of the Riverwatcher; it is purely used as a data retrieval and analysis tool. Winari is free to download from the VAKI website.
Setup
Setup of Winari is straightforward with comprehensive reference documents provided by VAKI (Riverwatcher Software Manual). Installation requires a download and install of Winari from the VAKI website, an install of Video LAN VLC Media Player and installation of a USB-to-Serial converter into the host PC computer.
Functionality
Understanding the functionality of Winari through the reference documents was challenging due to several inaccurate translations in the English manual. Winari can manage multiple counters; each counter can be named specifically and accessed separately. Data can be downloaded onsite by direct connection or remotely using a landline or GSM mobile phone. Unlike hydroacoustic counters, fish data is only collected when an object breaks the optical beam in the counter. Continuous images are not collected to imitate a video, however the sensitivity of the counter to trigger the video recording can be adjusted to reduce the number of potential false negative counts. All data files collected are synchronized for each potential fish in the Winari software. A user can scroll through each proposed fish to verify whether the software's interpretation is correct. Figure 3.14 provides a preview of the Winari software environment. Under the user's discretion, data can be separated further in Winari depending on project requirements. Riverwatcher collects multiple data types that can be analyzed by Winari:
- .ARV files: Fish size, direction of travel, timestamp and positioning data is collected.
- . IMG files: Silhouette images of each fish are collected providing the user with a verification image for each ARV file. Silhouettes can be exported for further analysis.
- .VSB files: The functionality of light emitting diodes ( LED) in the Riverwatcher is recorded.
- .TDT files: Records temperature every three hours.
- Photo files: Real-time photos of each fish that trigger the Riverwatcher are collected. This file type is optional, but provides the user with the potential to verify species, sex or any other factors.

Figure 3.14. Winari's interface displaying data. An .ARV file (fish physical data) is paired with . IMG (fish silhouette) and photo data (digital image) to provide an overview of each object detected. Photo courtesy of Vaki.
Data Export and Analysis
Winari provides the user with the ability to export all data files above for each verified fish. Fish length, size, timestamp, visibility, temperature and other fish data can be exported separately or synchronized. Basic graphical analysis can also be performed using Winari, such as migration pattern in relation to time or fish lengths in relation to time.
Recommendations
Overall, Winari provides the user with a multitude of verification options to optimize data quality control. The automated fish detection feature eliminates the need of manual verification of lengthy video data, and the basic graphical outputs provide a simple and quick analysis for users.
3.1.5 Mark 12
EA Technology Limited and Scottish and Southern Energy - Mark counter: No software
There is no proprietary software required for operating the Mark 12 ( MK12) counter. A Mark 12 operates through a text-based menu system and can be accessed from any text-based terminal application such as HyperTerminal (Windows XP and older) and PuTTY (Windows Vista and newer). Connection to the counter can be achieved in two ways:
- Direct connection through a null modem cable (RS232) to a laptop or PC.
- PSTN phone line via a modem plugged into COM2.
Once a connection is established, the user is presented with the main menu that contains a set of numbered options. Selecting a number will access another menu or modify a value. To make any adjustments, the user must be well versed on principles of how resistivity counters function. Some of the modifications users can make are, but not limited to, the following ( EA Fish Counter User Guide):
- Site name and details: User can modify site name and add any other important information.
- Digital input activation: User can enable or disable the digital inputs from environmental monitoring equipment.
- Environmental transducers: User can enable or disable any of the environmental transducers (i.e., cameras, conductivity probes).
- Environmental monitoring logging period: User can modify the time (in minutes) between logging environmental inputs to file.
- Camera activation: User can enable or disable the cameras connected to the counter.
- Camera 'On' delay: Allows users to modify the length of time (in milliseconds) from when the fish triggers the first electrode to when the picture is taken.
- Camera modes: Allows users to toggle between the three camera trigger options. Each mode refers to the first LED for a fish event that will trigger a picture to be taken.
- Channel Activation: Allows the user to toggle each counting channel on or off.
- Minimum Electrode Current: Adjust level of current (in units of 0.016 mA) needed before channels can be active.
- Minimum Fish Current: Allows users to modify the minimum current before a fish is detected. Three options are available: automatic, static conductivity and static minimum fish current.
- Modify Counts: Allows users to modify all count variables for water drive card.
- Minimum Counts: Modify the delay between current exceeding minimum fish current and initiating fish detection.
- Maximum Counts per Fish: Allows user to set the maximum amount of time for a fish to complete passage over electrodes.
- Maximum Single Lamp Counts: Allows users to modify the time delay before an LED is extinguished when only one LED is on.
- Exit Delay Counts: Users can modify the delay between detecting a fish and conforming a fish event.
- Start Delay Counts: Users can adjust the delay between when an electrode is triggered (exceeds the minimum electrode current) and the channel becoming enabled.
- View Compact Flash Information: Allows users to view information about the file storage system. Details of both internal and external storage can be viewed.
- Reset Total Fish Counts: Allows users to reset the total number of fish. The daily totals will not be affected.
Overall, MK12 counters are data-logging devices that store data and allow users to retrieve that information. Although operating software is not required to run the MK12, the multitude of data that is produced by the counter can be viewed on MK's proprietary analysis software for further analysis and validation. Alternatively, data can be exported as .txt files and analysed by user-defined software. Files created by the counter are as follows:
- Fish Movements: File that holds the details of all fish movements for that week.
- Fish Signals: File written weekly that contains the fish signals that correspond to the fish movements.
- Daily Summary: File that displays all up and down counts of functioning channels.
- Events: Weekly file that contains information for any designated counter events, such as an error with the power supply.
- Pictures: If cameras are enabled, pictures are taken for each event. A corresponding picture (.jpeg) file is created to match all event data and is available for download.
We have not had the chance to view or review MK's proprietary analysis software, but through personal communication with MK12 operators, we believe the software will become invaluable, as it allows users to link all the corresponding fish events or partial events data from each of the files, thereby facilitating the validation process.
3.1.6 Logie Software
Aquantic Ltd - 2100C Logie Fish Counter: 2100C PC Control Program
Software provided by Aquantic is strictly controlling software enabling users to set up and control a counter. There are two versions of this software: a Windows-based version with more intuitive controls and a simpler DOS-based version for use with newer versions of Windows (7 or 10). Both of these programs are included with the purchase of a counter (pre-loaded on CD), can be downloaded for free from the Aquantic website, or at the request from the manufacturer (Brown 1998).
Through our experience, the Windows-based 2100C PC control program does not function or is unreliable with Windows versions newer than Windows 7. For Windows 7 and 8, the new DOS-based program is more reliable.
Functionality
With this software the user can set and display various parameters on the counter to suit specific requirements.
- Continuous display of status: If the counter is connected to a PC, the user can choose to have status information sent to the PC at regular intervals and on the occurrence of any change in status. It is primarily intended as a "front panel" for the counter when the PC/Palmtop is left permanently connected to the control port. The information displayed includes number of events, up/down counts, date and time and version number.
- Status dump: Every 30 minutes, the counter performs self-calibration which includes a conductivity reading. Users can select to have the counter send a status dump to the printer following calibration.
- Thresholds: The user is prompted to enter the channel number (1-4) upon which the current values for the up and down thresholds are displayed followed by a request to enter new values.
- Reset counts: After confirmation, the totals of all up and down counts are reset to zero.
- Insert Dummy fish: Allows the insertion of a "standard" fish signal into any of the four channels, as either an upstream or downstream "fish". This allows the user to test whether or not the counter is functioning properly.
- Enable/disable: Individual channels may be enabled or disabled as required.
- Event relay/Up relay/Down relay: The instrument is fit with a total of eight single-pole normally open relays and four single pole changeover relays. These may be assigned using the above commands to particular channels.
- Printer: The counter may, at the user's discretion, print information on each count as it occurs. The data printed consists of the date, time, conductivity at the time of the most recent calibration, channel, upstream or downstream movement and peak signal size, which is the highest peak recorded by the counter as the fish passes over the sensor. The peak signal size can be reported as a percentage from 0% to 99% or as a value from 0 to 127 (see 2100C Graphics Program section). If enabled, a printer, a computer, or text-capturing device (RX Reader) with an RS232 serial connection should be attached to the PRINTER port on the rear panel of the counter and set to the correct baud rate (9600), parity (even) and number of stop bits (one). In addition, the user can select whether the pseudo-graph output is enabled: see 2100C Graphics Programme details below.
- Pseudo-graph output: A pseudographical output has been made available via the printer port to be able to show fish waveforms on a PC display (Figure 2.4, Section 2). The user may select pseudographical output on a per-channel basis, although if any channel has this form of output enabled, all other channels have their normal printer output suppressed. The output takes the form of pairs of characters, representing the encoded value of the channel number and the signal value measured by the counter at its normal sampling rate. See section below for information on the 2100C Graphics Programme.
- Events: It is possible for a signal to be detected that exceeds the pre-set thresholds, but does not pass internal checks that determine whether or not it is a fish. The signal may, if the user desires, trigger the event relay, and generate a trace on the chart recorder output. This command enables or disables this occurrence. In addition, the user may choose to have the event relay operate as soon as an event is detected, rather than after the signal is processed. This would be useful for triggering still cameras. Users may also choose to log these signals or not, as required.
- Baud rates: Allow the user to individually configure the serial ports to operate at one of the following baud rates: 300, 600, 1200, 2400, 4800, 9600 and 19200.
- Re-calibrate counter: If this command is chosen, then the counter will perform its calibration procedure, which normally occurs automatically every thirty minutes.
- Conductivity calibration: The conductivity probe may be calibrated, to compensate for cable capacitance.
- Show conductivity: The current value of conductivity, as read by the probe, can be continuously displayed.
- Change algorithm (fast/slow): The fish discrimination algorithm built-in to the counter can take two forms: (1) a fast version that can count fish passing at a rate up to one fish every 0.5 s but which is more susceptible to false counts due to wind and waves, and (2) a slow version that can only count fish passing at a rate of no more than one fish every two seconds, but is more dependable at rejecting false counts.
- Channel length/depth: Electrode length and normal water depth for each channel may be entered.
- Length and conductivity compensation: Length and conductivity compensation factors may be entered.
- Maximum size: The range of values allocated to fish sizes may be set to 0-99% or 0-127.
- Datalog buffer format: The buffer holding the logged counts and/or events may be set to either Linear (stops logging once full) or Circular mode (starts overwriting data once full), or cleared (deletes data once full).
- Length compensation: The user is prompted for a length compensation factor (in % per m). This is used, along with the electrode length, to calculate a gain compensation factor for different sizes of weir sections
Data Management
Although the Logie PC control program does not have any data processing or analysis capabilities, the data stored within the counter can be downloaded by the user. This is done through the "Show/download the information logged in the counter" menu. This allows the user to display the events stored in the datalog on the screen or download them to a file (location specified by user). By default, the counter creates an .lg2 file that can be read as a .txt file by simply changing the extension name manually to .txt.
Users can also choose to download and display a specific number of records. This is done through the "show the last 100 records" option. This will download the specified number of records starting from the last recorded event.
2100C Graphics Programme
This program is designed specifically for recording pseudo-graphical information from the counter to a personal computer. The computer should be connected through a RS232 serial connection attached to the PRINTER port on the rear panel of the counter. Like the 2100 PC control Program, this program is strictly an operating/controlling program with no data analysis capabilities. 2100C Graphics Programme is available for download from the Aquantic website. Note that once the program has been downloaded from the website, the associated "GRPH.config" file should always be saved in the same folder as the program. Upon start up, the program looks for this file to establish connection. The GRPH.config file enables users to set the preferences for communication between the computer and counter.
2100C Options are as follows:
- Port: Allows users to input what communications port the counter is connected to (i.e., COM1, or COM2).
- Baud: Allows users to set the communications baud rate - this should always be set to 9600.
- Logfile: Default file name created by the program - this should be left as "grph.log"
Once the program is open there are various options available. Key options include:
- Set baud rate: Once connected, the user has the option to change the baud rate. Note that this is not recommended.
- Record data from counter in a file: Opens a file to record any graphical data sent to the computer via RS232 serial connection. The user has the option to name the file to suit their needs. The file, by default, is saved to the location where the program is located (e.g., Desktop). If the user does not assign a file name, then the data is saved to the default GRPH.log file.
The output takes the form of pairs of characters, representing the encoded value of the channel number and the signal value measured by the counter at its normal sampling rate. A small example of a typical output is:
S 19/03/97 23:11:54 150 1 D 050
D @@PP``pp@@PP``pp@@PP``pp@@PP``pp@@PP``pp@@PP``pp@@
D pp@@PP``pp@@PP``pp@@PP``pp@@PP``pp@@PP``pp@@PP``pp
F 1
The start of a fish record is indicated by the S, which is in the same format as the normal logged or printed data, except for the preceding S. The ensuing D records are the blocks of encoded data. The end of the output is indicated by the F record. To view the fish trace or waveform on a PC, the appropriate logging software is required.
2100B/C Windows Graph Programme with Video Capture
The 2100B/C Windows Graph Programme is designed specifically to view the Logie counters graphical output files. This is a Windows-based program that can open any .log file to view individual record/event traces. This program is designed specifically to view data and offers no analysis capabilities. The user simply loads the appropriate data file and scrolls through each individual trace (either an event or record) to verify the correct identification of the record by the counter algorithm.
3.1.7 SalmonSoft: FishTick Software
The FishTick software is third party video motion detection software developed by SalmonSoft. FishTick aims to remove periods without fish from digital video recordings to limit the amount of video a user has to analyze. The software has two components: a video-capture program (FishCap) and a video-review program (FishRev). FishTick is available in two versions: "Lite" with restricted features and "Standard" with full features. The software can work in conjunction with an external computer or can be loaded directly onto a digital video recorder ( DVR). It can be purchased as standalone software or with an entire counting system. Cost is dependent on the exact specifications of the software, ranging from £1938 to £4200. A report by the Environment Agency found FishTick can analyze 24 hours of video data in 15 minutes with a detection rate of 90% (Washburn et al. 2008b).
System Requirements - Video Capture Program:
- Windows XP, 7 or 8
- Dual core CPU at 2.0 GHz with a suitable video capture device
- Minimum 2 GB of RAM
- Installation of video device, Avid Dazzle recommended.
- Video from Firewire (IEEE-1394) adapters or MPEG or AVI files also accepted
System Requirements - Video Review Program:
- Windows XP, 7 or 8
- Dual core CPU at 2.0 GHz with a suitable video capture device
- 2 GB of RAM Minimum
- Microsoft Excel installed
- 19" monitor recommended
Software Setup
The current version of FishTick functions best when it is operated through an onsite computer. Future versions of the software will work best with video files downloaded off of DVRs. For a comprehensive list of DVRs that work with FishTick, contact the manufacturer directly.
Functionality
FishCap: Has an extensive list of parameters that can be modified. FishCap has two main functions. Firstly, the program can re-write recorded videos to separate segments with fish and segments without fish, limiting the amount of video the user has to review. Secondly, FishCap can be deployed in real time to only record fish videos when fish are present. Cameras can be activated to record only if a switch or tripwire is triggered.
FishRev: Allows the user to scan through video files with fish created by FishCap. Videos can be viewed at 1/6 th to 60 fps. Users can tally fish species using mouse or keyboard shortcuts, and the data can be automatically stored in Microsoft Excel files by date and time.
Recommendations
Overall, FishTick provides the user with features that can aid in the analysis of DVR recordings. If the program performs as intended, it can save valuable time by significantly reducing the amount of data.
3.2 New Methods
3.2.1 FishCounter R package
The FishCounter R package is an open source software that uses R code to automate the management and visual exploration of Logie counter data. The package has two main data management functions and six data exploration plotting functions described below. All functions were developed based on Logie counter user's experience within IFR and Marine Scotland Science (I. Simpson, pers. comm.).
How to use FishCounter
The FishCounter package is simple enough to be used by beginner R users. R statistical software is an open-source software based on the R language (Ihaka and Gentleman 1996), and can be downloaded for free at http://www.r-project.org/. R software contains a number of base functions, however the real power of R is the ability for additional functions to be written and compiled into packages. Additional packages can be downloaded from CRAN using the R console, and can also be downloaded from individual repositories such as GitHub. For example, the FishCounter package can be downloaded from GitHub by installing the devtools package (ref) and using the install_github function.
Using the FishCounter package requires the user to know how to set a working directory, install packages, execute functions and specify simple arguments for R functions. Once the package is installed, the user has access to help documentation that defines all of the functions and arguments.
Data Management
There are no built-in data management capabilities in the Logie software. The counter stores data until it is deleted, and unless the counter data is deleted, each successive download will contain previously downloaded data. This requires additional work by the user to sort and extract the unique data records. Furthermore, the counter data can contain errors that must be manually removed. FishCounter's bind_counter_data function automates the management of Logie counter data by binding individual download files together and producing a single master dataset ( Figure 3.15). Bind_counter_data requires that all Logie files are converted to .txt files and placed into a single folder. Within the bind_counter_data function there are a set of internal functions that "clean" the data by removing errors, counter status reports and redundant data. Removing errors is particularly important for the counter data since it is prone to producing irregular records (1-2% of all records are irregular). Note that there is an optional argument to print out all rows removed and the reason for their removal. Sample code is provided to demonstrate the installation of the FishCounter package and the running of the bind_counter_data function ( Figure 3.16). Once the master dataset has been generated, it must be read back into R (see Figure 3.17).
Logie's 2100C Graphics Programme can be used as backup source of data. This can be stored on a computer or on a small, low power secure digital data logger. Data produced by this stream does not have the same issues of downloading duplicate data and can be used to observe the change in resistance (i.e., the fish trace) for pseudo-validation. However, these data still suffer from errors (much lower error rate than the counter data, < 1%) and data are not managed. To graphically observe the data or to extract the original counter records, the user needs to sort and extract the relevant data. FishCounter's bind_signal_data function performs similar actions to the bind_counter_data function and will provide a single clean master dataset that can be used in place of the datasets directly downloaded from the counter.

Figure 3.15. Screen shot of example folder containing individual files (e.g., 050813.txt) and master data file produced by the bind_counter_data function (ExampleData2015.csv).

Figure 3.16. Screen shot of sample R code that demonstrates how to install the FishCounter package and use the bind_counter_data function.

Figure 3.17. Screen shot of sample R code that demonstrates how to read in the new master dataset produced by the bind_counter_data function. It also shows how to set the first_day parameter, which determines the day the dataset should begin.
Data Visualization
Data visualizations can be used to asses a counter's efficacy and to visualize migration timing. We developed a number of functions to produce plots commonly used by IFR staff to inspect in-season data. This helps staff identify and troubleshoot counter problems. Each plot function produces the visualization in a new plotting window or can be saved as a .pdf (or other image format) for reports and presentations ( Figure 3.18).

Figure 3.18. Screen shot of sample R code that demonstrates how to create .pdf files of output from two plotting functions.
hist_records - This function plots histograms of the distribution of peak signal sizes ( PSS) for up counts, down counts and events, which are user specified ( Figure 3.19). PSS can be a reliable indicator of relative fish mass. Determining species using indicators of fish mass is important for Scottish rivers and will require some information about species size relationships.

Figure 3.19. Plots of histograms of up count PSS values for Channels 1 to 3.
hist_records recognizes how many channels the counter uses and plots each channel. The user examines the distribution of signal sizes and can make comparisons among channels. This helps the user identify channels that are not operating properly and unusual fish behaviour. If the counter user expects fish will migrate through all channels, for example, the PSS distributions among channels should look similar. Differences in the distributions may suggest that the electrodes are not working or attached correctly. This series of plots requires some knowledge of how the counter operates in a given watershed and will be most useful to experienced counter users.
plot_events - This function plots time series of the mean number of events per hour for all channels, the number of events for each channel per hour, and the number of up counts per hour for each channel. An event is recorded (instead of an up count or down count) when changes in resistance do not meet the criteria for the record to be classified as an up or down count. This can happen when a fish attempts to cross over the electrodes but turns back before swimming completely over the counter sensor. Events can also occur due to low water levels over the electrodes, wind action, and other animals moving over the sensor units. Events commonly occur, but the baseline rate for each counter will differ. For each channel the events per hour can be compared to the mean events per hour for all channels, which provides a baseline value. Events are more common when there are higher upstream passage rates. The number of up counts per hour are plotted which allows the user to identify high event rates that do not coincide with high up count passage rates ( Figure 3.20). This series of plots require some knowledge of how the counter operates in a given watershed and will be most useful to experienced counter users.

Figure 3.20. Plots showing the number of events per hour by date. Each plot represents the events for a given channel. Black lines are the number of events per hour, blue lines are the number of up counts per hour, and the horizontal dashed red line is the mean number of events per hour for all channels. This provides a baseline for the typical number of events per hour and can be used as a benchmark for when there may be counter problems.
plot_pss_date - This function plots a time series of raw and daily mean up count PSS values for each channel, which are user defined ( Figure 3.21). PSS can be a reliable indicator of relative fish mass. This plot highlights changes in the distribution of PSS values through time, which, in some cases, can be used to identify changes in species (trout vs. salmon) or life history (one-sea-winter vs. multi-sea-winter in adult salmon).

Figure 3.21. Plot produced by plot_pss_date function. Grey points show the raw up count peak signal size values and the red points indicate the daily mean up count PSS values. PSS is an indicator of fish size. Note the declining PSS values from mid March to early April, depicting the switch from anadromous to resident Oncorhynchus mykiss.
plot_pss_hour - This function plots the up count PSS values by time of day ( Figure 3.22). The upper plot shows the total number of up counts per hour and the lower plot shows the raw PSS values by hour of the day. The upper plot allows the user to identify peak migration times in the day. The lower plot allows the user to identify differences in the PSS among hours. This information could be used to target trapping efforts, counter validation, or for identifying general fish behaviour.

Figure 3.22. The top plot shows the number of up counts by time of day, and the bottom plot shows the peak signal size by time of day.
plot_abundance - This function plots time series of daily and cumulative up counts ( Figure 3.23). This highlights the daily migration rates and how they relate to the total number of fish that have migrated upstream over the counter.
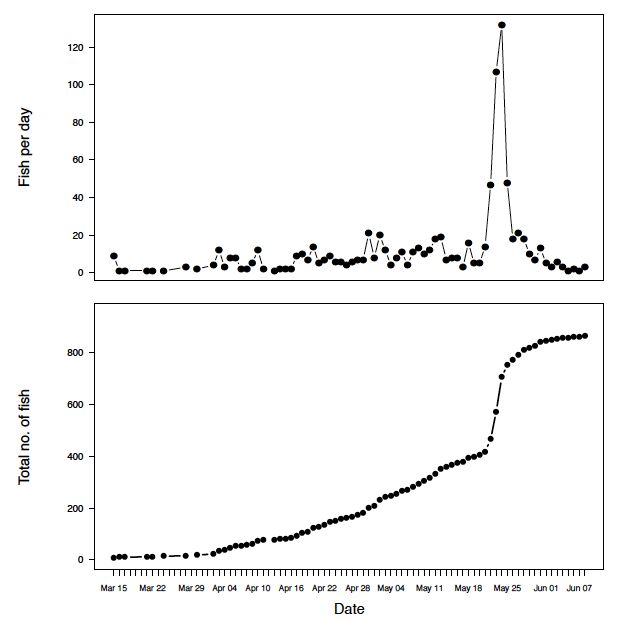
Figure 3.23. Plot produced by plot_abundance function. The top plot shows the daily number of fish passing through the counter. The bottom plot shows the cumulative abundance by day. This function plots the raw number of up counts and should not be used as a definitive count but as a minimum count.
3.2.2 Species Identification Models
Introduction
In many UK rivers, salmon ( Salmo salar) and trout ( S. trutta) migrate upstream to spawn at similar times. These species can migrate in similar abundances and, in some situations, overlap in size, complicating the enumeration of adult spawners by electronic fish counters. On some rivers there may also be other migratory fish species present that require consideration. Data on species identification is important for producing accurate species-specific estimates of abundance, conducting long-term monitoring, and setting conservation limits. While species identification is possible with video validation, in most cases it is not possible to identify all fish or may not be cost-effective; therefore, the species identification of many fish remains unknown. Development of methods that allocate unidentified fish to different species will help to improve the accuracy of fish counter estimates that will help to inform management decisions.
Counters can readily record metrics that are useful for identifying species such as length. For example, Vaki's Riverwatcher counters calculate the length of all recorded traces. Echoview software can provide length estimates from sonar images, and peak signal size from some resistivity counter setups can be used as an index of fish length. A simplistic approach to species allocation is to use minimum and maximum cut-off lengths that species are most likely to occur within. However, distinguishing species using length cut-offs relies on distinct species-length relationships (i.e., one species is consistently longer than the other), which is often not the case for salmon and trout in the UK. This approach also bins fish into two broad length categories, which is an unrealistic assumption. A more accurate approach is to apply proportions of each identified species within a size interval (~ 5 cm) to the numbers of unidentified fish in the same length interval. But, this also ignores the continuous nature of size data and requires a representative sample of identified fish for each length interval. Furthermore, neither approach provides estimates of uncertainty.
The previous length-interval approach, however, can be modified and an average proportion of each species within each length interval can be calculated using data from multiple years. This option usually results in a representative sample of identified fish for each length interval but averages all the variation in size-species relationships among years and ignores non-stationary in length-species relationships. For example, the average length of salmon returning from the sea increases throughout a year, while the average length of trout changes from month-to-month and often consists of a bimodal distribution of smaller brown trout and larger sea trout. There is also some variation in the species-length distributions of both species from year-to-year and there are normally different population components to consider that are linked to run timing and the length of time fish spend at sea. Models that account for seasonal and inter-annual variations in length-species relationships need to be developed to produce accurate species-specific abundance estimates. Gurney et al. (2014) provide methods for discriminating species using length and age distributions. While their methods provide accurate estimates of abundance for species by age, it requires both length and age data. Length data, or some measure of size, can easily be obtained using electronic fish counters, but age data requires fish be handled and sampled in the field. Different ages of salmon and trout migrate at different times of the year; therefore migration date might aid in species identification (Bacon et al. 2009) when age data are not available.
We used the Gala Water, a small tributary of the Tweed River, UK, as a case study to illustrate this model. The Tweed has annual migrations of both salmon and trout throughout the year, with the majority of salmon migrating between September and November. Trout migration consists of sea trout which typically spend one or two years at sea, and brown trout that are a resident form of trout that make annual spawning migrations to smaller tributaries. Fish are enumerated with a Vaki counter located at the bottom of a fish pass near the confluence of the Gala Water and Tweed. Due to high turbidity events, which are a common occurrence in UK Rivers, identification rates by video validation are variable, ranging from 34 to 59%. Since 2006, the Tweed Foundation has used the Vaki counter to generate a database of over 45 000 fish records that include calculated length, of which over 15 000 individuals have been identified to species using video validation.
We used a generalized linear modeling ( GLM) approach to determine the species of unidentified fish counts using length distributions. For each month, we estimated the probability a fish was either a salmon or trout based on length using data from the year of analysis (current method). We also tested a second method for years when validation data was limited which uses length distributions for each month from previous years (historical method), accounting for annual variation in the length distributions using a generalized linear mixed-effects model ( GLMM). Our analysis also accounts for uncertainty in our species-specific estimates of abundance.
Methods
Study Site and Counter
The Tweed catchment area is nearly 5000 km 2 and contains approximately 15% of the water used by salmon in Scotland. A Vaki counter was installed in 2006 to enumerate adult salmon and trout migrating upstream in the Gala River, which has a catchment area of 207 km 2 ( Figure 3.24). The counter is located in the lower part of the catchment at the Skinworks Cauld fish pass ( Figure 3.25). Each fish passing through the Vaki counter produces a silhouette that is used to measure the depth of each fish from which the length is estimated, as well as the direction of movement. A Vaki Riverwatcher model was used with Vaki's colour video camera attachment and light tunnel to control the position of each fish and provide illumination ( Figure 3.26).

Figure 3.24. Map of the Gala Watershed. The red dot indicates the location of the Skinworks Cauld fish pass and the Vaki fish counter at Gala. Grid reference: NT 487 367. Map courtesy of James Hunt.

Figure 3.25. Photo of the Skinworks Cauld fish pass and counter site. Photo courtesy of James Hunt.

Figure 3.26. Photo of the Vaki counter and colour video camera installation at the Skinworks Cauld fish pass. Fish enter the counter at the top of the photo and exit at the bottom. The triangular section of the counter box on the right side of the photo is the colour camera and viewing window. Photo courtesy of James Hunt.
Data
All fish passing through the Vaki counter were enumerated and had lengths estimated using a standard depth to length ratio. Lengths are measured to the nearest centimeter and are reported to be up to 90% accurate (http://www.vaki.com/Products/RiverwatcherFishCounter/). The species for all fish that were sufficiently visible was determined using colour video images ( Figure 3.27). Species that were not salmon or trout were removed from the dataset because they only represent a small fraction of the total number of fish enumerated each year. This included one grayling, 11 rainbow trout, and 1533 records that were determined not to be fish (i.e., otter). We excluded data from January to May 2014 because there were no fish to predict species during these months.
 salmon and B) trout swimming through the Vaki counter.")
Figure 3.27. Screen shot of A) salmon and B) trout swimming through the Vaki counter. Photo courtesy of James Hunt.
Model
We used a GLM to relate the length of individual fish to species identification (salmon [1] or trout [0]) based on species data that was video validated by observing fish pass through the counter. We evaluated two model forms: (1) a historical model that uses data from previous years of sampling, and (2) an in-season model that only uses data from the current year (2014 as an example). The historical model can be used when the number of validated fish in a given month is too few to confidently estimate the species distribution based on fish size. The current model can be used to fit months or years when the number of records with length data is sufficient to get confident estimates of species proportions.
Current Model
We fit a GLM to the 2014 data using the 'stats' package (family: binomial) in R (R Development Core Team 2012). We included length and month as explanatory variables. The model is as follows:

where, Y i,j is either salmon [1] or trout [0] for fish i, β 1 is the effect of length ( L). The effects of months June to December are described by coefficients β 2 to β 7, with October as the reference month (i.e., α); it is common practice to assign the factor level with the most data as the reference level when creating dummy variables. Each year the model is fit to a different dataset and the months included in each model will depend on the available data. If fish were only observed migrating from September to November, for example, then the model would only contain those months as predictors. Alternatively, if fish were observed migrating all months of the year, the model would contain all months as predictors.
Historical Model
We fit a GLMM to all available data (2006 - 2014) using the ' glmmADMB' package (Bolker et al . 2012) with a binomial distribution. We included fixed effects for length and month. To take advantage of all years of data, we included year as a random effect, which allows for variation among years in the relationship between fish length and species. The historical model is as follows:

The random intercept of year is a j with a mean of 0 and variance.
For both current and historical models, we estimated the number of fish that were salmon by summing the predicted probabilities of being a salmon (between 0 and 1) for each fish. To estimate the number of trout, we summed the predicted probabilities of being a trout for each fish. We present the estimated probabilities for each month with 95% confidence intervals. Note that the confidence intervals for the historical model only include error in the fixed-effects and not the random effect of year. Therefore, estimates of uncertainty are biased low, which can be significant if there is large variation between years. The approximate method was used to calculate the 95% confidence intervals. We illustrate the current and historical models by producing estimates of salmon and trout for 2014.
Results
Salmon and trout co-migrate through the Gala fish counter from July to December, although co-migration is limited to fewer months in some years (Figure 3.28). Salmon had longer bodies than trout on average, but there is substantial overlap in their length distributions (Figure 3.28). Between June and December 2014, 672 salmon and 1705 trout were visually identified by Tweed staff moving upstream through the counter. A total of 2439 fish were not identified due to water clarity issues. Using the current GLM, we predicted that of the 2439 unidentified fish, 947 (95% CI 841 - 1083) were salmon and 1492 (95% CI 1356 - 1598) were trout. Using the historical GLMM, we predicted 1070 salmon (95% CI 900 - 1246) and 1369 trout (95% CI 1193 - 1539).
 and trout (grey) by month and year.")
Figure 3.28. Length distributions for salmon (blue) and trout (grey) by month and year.
The uncertainty for both models overlap within species, but there is a greater difference between the number of salmon and trout estimated by the current model when compared to estimates for the historical model ( Figure 3.29). The current model has the benefit of using length-species relationships from the current year. However, it tends to produce uncertain and uninformative estimates for most months and sizes except October and November in 2014 ( Figure 3.30) The historical model produces more certain estimates over a longer time period (e.g., August to December 2014; Figure 3.31), because it draws on a much larger sample size (historical n = 15 252, current n = 2377) for all months by incorporating all years of data.
 and trout (grey) for 2014 using the historical and current models.")
Figure 3.29. Estimated abundance for salmon (blue) and trout (grey) for 2014 using the historical and current models. The dots represent the mean estimate and the bars are the 95% confidence intervals surrounding the mean estimates.
 and trout (grey) by month using the current model (GLM, family: binomial).")
Figure 3.30. Plots showing predicted probabilities of being a salmon (blue) and trout (grey) by month using the current model ( GLM, family: binomial). Length and month are the explanatory variables. The solid line is the mean predicted probability for a given fish length and shaded areas are the 95% confidence limits on the predicted probabilities.
 and trout (grey) by month using the historical model (GLMM, family: binomial).")
Figure 3.31. Predicted probabilities of being a salmon (blue) and trout (grey) by month using the historical model ( GLMM, family: binomial). Length and month are explanatory variables, and year has been set as a random effect. The solid line is the mean predicted probability for a given fish length and shaded areas are the 95% confidence limits on the predicted probabilities. Note that the 95% confidence intervals are only for the fixed-effects and underestimate the total uncertainty (fixed-effects + random effects).
Discussion
We used a generalized linear modeling approach to predict the species migrating through a Vaki counter in 2014 based on fish length. We applied two different types of generalized linear models, which used either the current years data (2014, current model) or all historical data (2006-2014, historical model). The two models predicted different numbers of salmon and trout, but in many cases the 95% confidence intervals overlapped.
The historical model has high statistical power because of the high sample size ( n = 15 252 identified salmon and trout between June and December). The biggest advantage of the historical model is that it draws on information from other years, which is particularly helpful when there have been few fish identified to species in the year of concern. Differences in uncertainty between the current and historical models during months with low sample sizes are illustrated by comparing the uncertainty in predicted probabilities for August (Figures 3.30 and 3.31). The main difference between the two models is that the historical model uses the average relationship between fish length and species, whereas the current model uses the specific relationship for the current year. This is an important difference to consider if in the year being predicted fish size distributions contrast greatly from the historical average. In years or months when this is the case, the current model will generate more accurate estimates. However, if year-to-year variability is relatively low, the historical method is favorable.
In our example, we compared the predicted probability of being a salmon or trout from June to December between two models (current and historical); alternatively, one could use the current and historical models together within a given year. For example, in October and November when there are typically a large number of fish validated to species, the current model will produce certain estimates that are probably more accurate than the historical model. In most other months, however, validated samples sizes are sufficiently low that most predicted probabilities within a month are uncertain. Although this combined method may improve estimates of abundance, the majority of fish migrate through the fish counter between October and November and are well represented by the validation data, making up the vast majority of the total abundance annually. Species length cut-offs could also be applied to reduce uncertainty. For example, if it is known that fish < 40 cm are always trout and fish > 100 cm are always salmon, this information could be used to determine species above and below these length cut-offs with greater certainty than the model. This could be incorporated using prior distributions in a Bayesian framework.
Although these methods are general, they rely on relatively large quantities of accurate length data and a length-species relationship. Therefore, applications of these models to other types of fish counters and sites with small sample sizes are likely limited. For example, resistivity counters provide rough approximations of fish length using peak signal size and would likely provide uncertain predicted probabilities of species unless there was a length cut-off between species. It is important to assess the quality of data and strength of the length-species relationship before applying these models to other fish counter data. The modeling approach presented herein can be used to determine the species identification of salmon and trout using length data. A combined modeling approach could be explored further. In addition, cross-validation of the models' predictions would also provide an estimate of the predicted error of the model.
References
Alaska Department of Fish and Game ( ADFG). 2015. Alaska Fisheries Sonar, Sonar Tools: Imaging Sonar. Available from http://www.adfg.alaska.gov/index.cfm?adfg=sonar.didson (assessed May 2015)
Aquantic Ltd. 1998. 2100C Logie Fish Counter - Operating and Technical Manual.
Bacon, P.J., Palmer, S.C.F., MacLean, J.C., Smith, G.W., Whyte, B.D.M., Gurney, W.S.C., and Youngson, A.F. 2009. Empirical analyses of the length, weight and condition of adult Atlantic Salmon on return to the Scottish coast between 1963 and 2006. ICES Journal of Marine Science 66:844-859.
BlueView Technologies, Inc. 2007. ProViewer Software Handbook. Part Number 201334-01
BlueView Technologies, Inc. ©2003-2007. ProViewer High Definition Imaging Sonar User's Handbook. PN 201310-02B.
Cronkite, G.M.W., Enzenhofer, H.J., Ridley, T., Holmes, J., Lilja, J., and Benner, K. 2006. Use of High-Frequency Imaging Sonar to Estimate Adult Sockeye Salmon Escapement in the Horsefly River, British Columbia, iv+47 pp.
EA Technology Ltd. 2006. Fish Counter System - User Guide Version 1.4, Guide produced for Scottish and Southern Energy.
Gurney, W.S.C., Brennan, L.O., Bacon, P.J., Whelan, K.F., O'Grady, M., Dillane, E., and McGinnity, P. 2014. Objectively assigning species and ages to salmonid length data from dual-frequency identification sonar. Transactions of the American Fisheries Society 143:573-585.
Holmes, J.A., Cronkite, G.M.W., and Enzenhofer, H.J. 2005. Feasibility of deploying a dual frequency identification sonar ( DIDSON) system to estimate salmon spawning ground escapement in major tributary systems of the Fraser River, British Columbia. Canadian technical report of fisheries and aquatic sciences 2592: xii + 51 p.
Ihaka, R., and Gentleman, R. 1996. R: A language for data analysis and graphics. Journal of Computational and Graphical Statistics 5: 299-314.
Rakowitz, G. (2009) Didson counting - manual or automatic?. (Proceedings of the Underwater Acoustic Measurements: Technologies and Results, Nafplion, Greece, 2009), 6 pp.
Sound Metrics Corp. 2015. DIDSON Sonars. Bellevue, Washington, United States. Available from http://www.soundmetrics.com/products/didson-sonars/Software.
VAKI Aquaculture Systems Ltd. 2015. Riverwatcher Fish Counter User Manual
VAKI Aquaculture Systems Ltd. 2015. Riverwatcher Software User Manual, Winari Software.