Delivering Scotland's circular economy - route map to 2025 and beyond: technical annex
This annex sets out the evidence base and rationale underpinning the consultation Route Map: Delivering Scotland’s circular economy, identifying our progress to date and the case for further change to meet our waste and recycling targets.
Progress to date and the case for further action
Introduction & Context
This section summarises progress against the five waste targets. Four of the targets are reported by SEPA and the most recent reporting year has been used as of March 2022[5]. The food waste target requires a bespoke methodology which is carried out by Zero Waste Scotland using several distinct data sources and is only updated periodically based on data availability.
At the time of writing, we have relatively limited information on any changes to waste arising and management since the COVID-19 pandemic. The SEPA cyber-attack means that all waste reporting (i.e. the basis of four of the five targets) for 2019 and 2020 is on hold, with only limited data available[6]. Household waste and landfilled waste data is available for 2020 and is used in the relevant sections below.
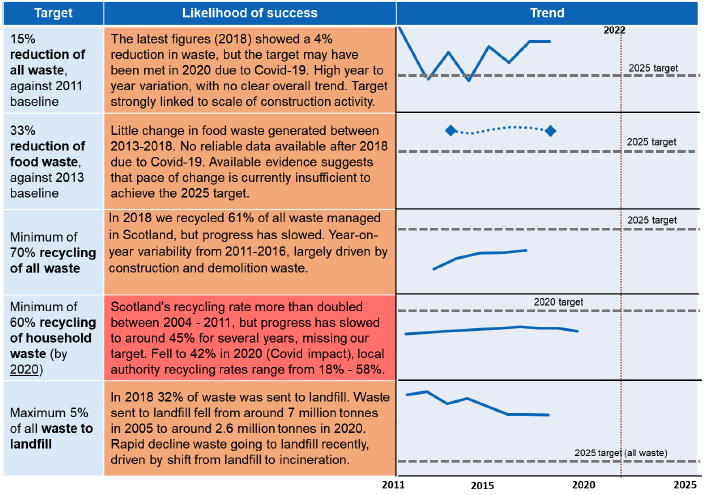
Key: Red indicates a missed target [Minimum 60% recycling of household waste by 2020]; Orange indicates target at risk [All other targets].
In addition to these waste and recycling targets, the 2020 Climate Change Plan update[7] set out emission 'envelopes' for each sector, which reflect the pathway to meeting our statutory targets to reduce emissions by 75% by 2030 (compared with 1990) and to net zero by 2045. In 2019, greenhouse gas emissions from the waste management sector[8] were 1.5 MtCO2e. To achieve our emissions envelopes we must reduce this to 0.9 MtCO2e by 2025 and 0.7 MtCO2e by 2032. These envelopes are built upon achieving our waste and recycling targets, as the foundation for our pathway to 2025 and baseline for future action.
15% Waste Reduction Target
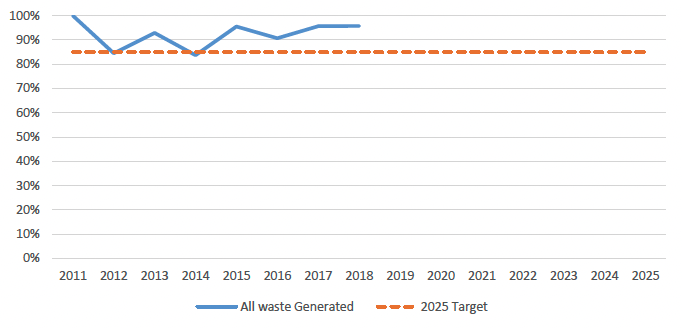
All waste generated since 2011 (blue line) is summarised in Figure 2, expressed as a proportion of the 2011 baseline of 11.96 million tonnes. The amber dashed line represents the 15% waste reduction target (10.2 million tonnes) by 2025.
The 10.2 million tonnes of waste required to meet the 2025 15% reduction target was met in 2012 (10.1 million tonnes) and 2014 (10.0 million tonnes) but has not been met in the four most recent reporting years (2015-18). Since 2015, the amount of waste generated compared to the 2011 baseline has reduced by between 4 and 9% depending on the year. In 2018 there was 11.45 million tonnes of waste generated, which was a 4% reduction on the 2011 baseline.
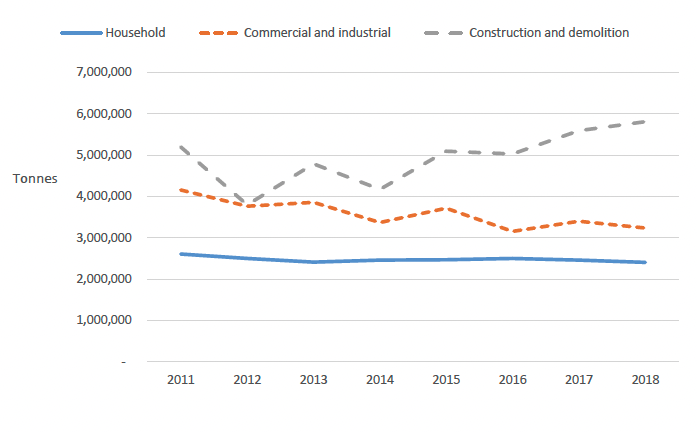
The trend in waste arisings by waste source type between 2011 and 2018 is summarised in Figure 3. Although there is variation from year to year, both Household waste and Commercial & industrial waste have shown downward trends from 2011 to 2018 with a combined reduction in waste generated for these two waste sources of 1.1 million tonnes (17%), Construction and demolition wastes comprised 5.8 million tonnes, or approximately 50% of Scotland's waste in 2018, and shows considerable variability in the quantities generated during the period 2011 to 2018[9], with an overall increase of 12%. Recent trends suggest Construction & demolition waste (which will be affected by the relative strength of activity in the construction sector) will largely determine whether or not the target is achieved in 2025.
The carbon footprint of Scotland's waste
The carbon footprint of Scotland's waste shows the impacts of the materials through their life (growing/extracting, processing, transporting etc) as well as their end-of-life impacts – effort that is thrown away when the materials become waste. In contrast to the relatively modest changes in the amount of waste generated in tonnage terms, the carbon footprint of Scotland's waste has fallen around 30% since 2011[10].
Of the 4.6 million tonnes CO2 equivalent reduction in carbon emissions between 2011 and 2018, 3.8 Mt CO2 equivalent (84%) was accounted for by the reduction in the carbon impact of materials production. Improvements in this metric do not therefore all show up in waste sector emissions. These savings contribute right across Scotland's economy, and on Scotland's overseas footprint as well. As we pursue a circular economy, and think increasingly about policy targeting material inputs, rather than starting with 'end-of-pipe' waste outputs, this need to think about the carbon impact of waste and resource policies across all sectors will be critical to delivering Scotland's net zero ambitions.
Wastes soils alone made up 4.29 million tonnes or 37% of all waste generated in 2018. Soil is a low-carbon waste stream, and overfocusing on this element of the target may not offer the best returns from waste prevention in terms of Scotland's net zero ambitions, with smaller tonnage materials having far greater carbon impacts.
In recent years we have also invested in several waste prevention actions to tackle problems other than weight or carbon impacts of waste. Specifically, this includes measures that target very high frequency items (such as single-use plastics) that frequently reach our shared environment as litter pollution on land or in the sea. The tonnage and carbon benefits from these changes are relatively small, but these measures help us avoid other social and ecological impacts.
33% Food Waste Reduction Target
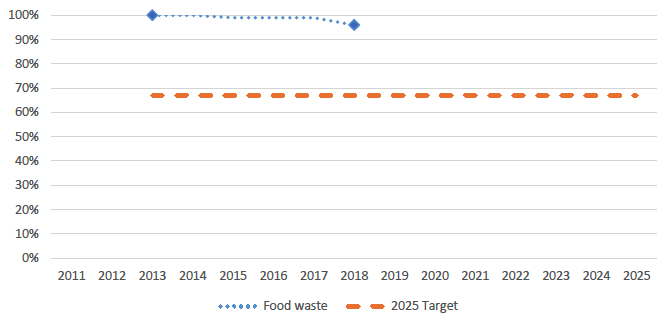
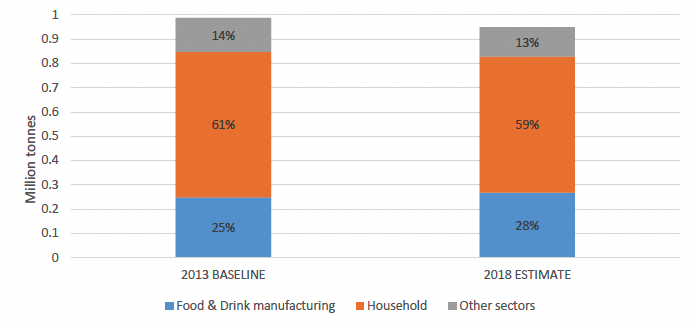
Food waste generated in Scotland in 2013 and 2018 is summarised in Figure 4 , expressed as a proportion of the 2013 baseline of 987,890 million tonnes. The amber dashed line represents the 33% waste reduction on the 2013 baseline by 2025. Food waste tonnage is very difficult to measure, as discussed below, and robust, annual data is not currently available. The 2018 data point in Figure 4 is not directly comparable with the 2013 baseline hence there is an element of uncertainty regarding progress against this target.
The 2019 Food Waste Reduction Action Plan (FWRAP) laid out the actions required to help Scotland deliver the ambitious target of a 33% reduction in per capita food waste below 2013 levels by 2025. To support monitoring progress, an estimate was calculated for the baseline line year of 2013.
Food & Drink manufacturing generated 25% (248,230 tonnes) of the 2013 baseline (987,890 tonnes), other sectors (hospitality, public sector, retail) generated 14% (140,714 tonnes), with the remaining 61% (598,946 tonnes) generated by Scotland's 2.4 million households.
An update to the baseline was published in 2016[11], this built on the original baseline calculation[12], and the scope of the original estimate[13]. Unlike the other targets, not all elements of this target are separately measured and reported each year. In particular household food waste estimates are dependent on bespoke waste compositional studies, plus an estimate of sewer disposal and home composting (which is out of scope for waste data recording systems altogether). For commercial waste streams, an estimate must be made of which material is food, and which is other waste, for many waste streams.
The household food waste to sewer and composting studies have not been updated since the original baseline estimate so are now out-of-date. The household waste composition analysis studies used to produce the baseline estimate were carried out during 2013 to 2015. New estimates of household waste composition analysis, including food waste should be available in early 2023. This makes any current assessment of progress highly uncertain until the various contributing studies are updated.
Ahead of a full analytical assessment of progress towards the FWRAP target as part of the updated FWRAP, our best estimate of progress against the 2013 baseline comes from voluntary reporting submitted to the EU food waste platform as part of the EU Delegated Act to the Waste Directive and common methodology for reporting food waste[14]. The data reported to the EU was from 2018.
The EU reporting differs from the Scottish baseline methodology in several ways. The EU allows for direct and indirect measurement of food waste, includes primary production, but excludes food waste to sewer and home composting from the household estimate. EU estimates are broken down into 5 sectors: primary production (excluded from Scottish baseline); processing and manufacturing (direct mapping to Scottish baseline); retail and other distribution of food (a subsection of other sectors in the Scottish baseline); restaurants and food services (a subsection of other sectors in the Scottish baseline); households (Scottish baseline includes food waste to sewer and home composting).
Processing and manufacturing maps directly on to the Scottish baseline and can be estimated from direct measurement using data reported to SEPA[15]. Retail and other distribution of food and restaurants and food services were estimated from UK level data from WRAP[16] and scaled to the number of businesses in each sector located in Scotland using ONS data[17]. Household waste was estimated by scaling the stratified per capita food waste for the UK[18] to the population of Scotland in 2018[19] and adding an estimate of food waste to sewer and home composting by scaling the UK estimates to the Scottish population in 2018. This is not sufficiently accurate to use this estimate as anything other than an approximate indicator of progress. Updated household data, and updated composition estimates, are required to produce a comparable estimate to the 2013 baseline that factors in changes in behaviour within households.
This data is summarised in Figure 5. Although the two estimates are not directly comparable due to the methodological differences described above, the percentage of waste generated by each sector is broadly similar between both time points. The overall estimate for 2018 was 96% of the 2013 baseline, which is not sufficient progress to achieve the 2025 target.
2018 data was used as the most recent source of data due to the cyber-attack on SEPA, and because COVID-19 significantly disrupted all food waste producing sectors, meaning we lack much of the data we need to assess progress beyond 2018. The most up-to-date data on UK food waste showed a reduction of 4.8% in UK food waste between 2015 and 2018[20]. There is also evidence that the COVID-19 lockdown in March 2020 led to a 43% reduction in household food waste across the UK[21], but this appears to have rebounded as restrictions have eased[22].
The carbon footprint of food waste
The method of generating food waste estimates also makes it difficult to estimate the carbon footprint of the food waste that is comparable to other targets and Scotland's overall carbon footprint.
Scotland's carbon metric[23] reported that in 2018, food waste was 5% of the total waste by tonnage, but 25% of the total carbon footprint of Scotland's waste. Food waste from Scottish households produced 1.887 million tonnes CO2eq, while non-household food waste was responsible for a further 0.762 million tonnes CO2eq[24]. This represents 2.7% and 1.1%, respectively, of Scotland's total carbon footprint[25]. The carbon metric does not measure food waste as a distinct material stream (for similar reasons to the ones outlined above) so the tonnage used to generate the food waste estimate is likely to be an underestimate. Regardless, this demonstrates that food waste has a much higher carbon impact that other waste materials.
There is very strong alignment between food waste prevention and Scotland's net zero ambitions. Upstream prevention eliminates not just waste management emissions, but also the emissions involved in growing, harvesting, processing, and transporting items that ultimately go to waste. There are also significant financial savings opportunities (primarily from avoided purchase) for organisations and individuals. Downstream prevention activity – such as diversion to bioeconomy applications – have smaller carbon benefits, but still avoids disposal emissions and offers additional economic opportunities. This downstream activity will never be fully eliminated as some food waste is an unavoidable by-product (e.g., inedible parts) and cannot typically be prevented upstream.
60% Household Recycling Target
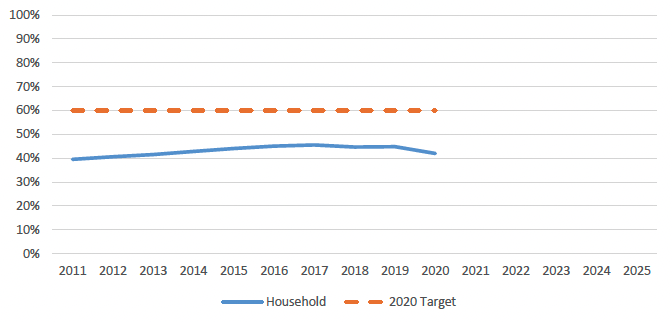
Progress against the target to recycle, compost and reuse 60% of household waste in Scotland by 2020 is summarised in Figure 6. Following significant progress from 2004 to 2014, between 2015 and 2019 the household recycling rate plateaued around 45% and fell back to 42% in 2020 (impacted by COVID-19 restrictions); we have missed our target to recycle 60% of household waste by 2020.
In terms of absolute tonnages recycled since 2011, 2013 was lowest at 1 million tonnes, and 2016 the highest at 1.12 million tonnes. In 2019 1.09 million tonnes of household waste was recycled. More recently, 2020 was an exceptional year due to the COVID-19 pandemic and it is important to view the reduction in recycling rate in 2020 in that context. People spent most of their time at home, transferring significant waste producing activities, such as food consumption, back to the household. There were also significant disruptions to kerbside and household recycling centre services in some areas. The extent to which changes in how we live, and how we work will persist beyond the pandemic period is unknown. It is possible that the household waste stream will increase in importance if some economic activity has permanently shifted from the workplace to the home.
The most significant driver of household recycling performance is how much recyclable waste is thrown away in the non-recyclable kerbside bin. The last time Zero Waste Scotland delivered a comprehensive programme of kerbside waste composition analysis was between 2013 to 2015[26]. The work showed that approximately 670,000 tonnes, or just under 60% of kerbside residual waste, is made up of waste types that could have been recycled with existing kerbside recycling services.
Since completing that study, using 2019 as a comparator year, the overall quantity of kerbside residual waste collected has reduced by approximately 10%[27], reflecting further recycling service roll outs. While the 670,000 tonnes and 60% estimate above will have reduced to some degree, a very large quantity of recyclable wastes continues to be thrown away in the non-recyclable bin. Zero Waste Scotland is currently undertaking a new two-year programme of kerbside waste composition analysis with local authorities and new national estimates should be available in early 2023.
The carbon footprint of household waste
In 2018 household waste comprised approximately 21% of Scotland's total waste by weight, but 55% of the total whole life carbon emissions associated with Scotland's waste[28].
The carbon emissions associated with Scotland's household waste have been steadily falling since 2011[29], reflecting changes in the amount of waste generated and how waste is managed. In 2019 the amount of household waste generated was 7% below that reported in 2011; approximately 185,000 tonnes. The reduction in waste arisings between 2011 and 2019 has led to carbon savings of approximately 1.1 million tonnes (-16%).
In 2019 the embodied carbon impacts from material production (i.e., impacts of producing the material in the first place before they become waste) were the largest contributor (5.78 million tonnes CO2 equivalents) to household waste carbon impacts. Landfilling household wastes remained the second largest carbon contributor (307,600 tonnes CO2 equivalents), followed by incineration (129,700 tonnes CO2 equivalents), which was an increase of nearly 78,800 tonnes when compared to 2018. Recycling reduced Scotland's household waste carbon impacts by 545,100 tonnes CO2 equivalents in 2019.
The scale of emissions associated with producing the material in the first place before they become waste highlights the importance of preventing waste, particularly for carbon-intensive materials such as food waste, textiles, metal, plastic, paper, and card. Those top five most carbon intensive materials accounted for under half (45%) of all household waste in 2019 by weight, but 82% of household waste carbon impacts.
70% Recycling of all wastes
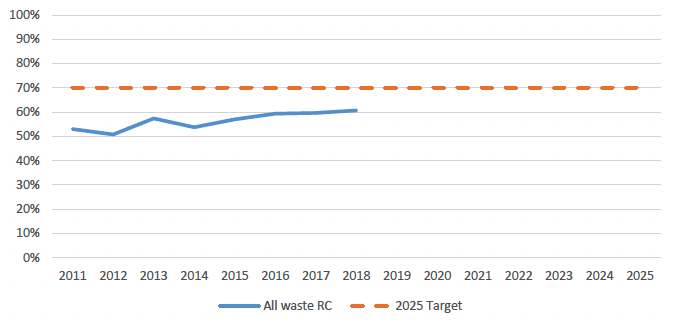
The all-waste recycling target comprises all wastes managed, including waste from households, construction and demolition activities, and commerce and industry. Figure 7 summarises recent trends for the target.
Between 2011 (5.8 million tonnes) and 2018 (7.0 million tonnes) the amount of waste recycled has significantly increased, but also shown marked year-on-year variability, reflecting the large variations in the arisings and subsequent management of soils, sludges and mineral wastes from the construction and demolition sector.
The trend since 2016 has been a plateauing, or reduced rate of increase, in recycling performance, with the recycling rate for 2018 being around 61%. The current trajectory suggests it will be challenging to meet the 70% 2025 target without further interventions. For example, for the 2025 all waste recycling target to be met, there would need to be an annual increase in the recycling rate of 1.3 percentage points, for each year between 2018 and 2025. The historical annual increase between 2011 and 2017 has been approximately 1 percentage point.
Like the waste generation target, the variation in construction and demolition waste generated (principally soils and mineral wastes), and the ability to recycle those wastes, drives much of the variation in the reported recycling rate. This variation seems likely to continue. As with the waste generation target, the largest tonnage wastes do not represent the highest value area to focus on in carbon terms. The long-term impacts of Covid-19 on this target are not yet known.
In addition to household recycling, the mixed waste portion of commercial and industrial arisings represents a significant opportunity to improve both recycling rate and reduce carbon emissions, though there is significant uncertainty regarding the exact composition. There may also be opportunities for construction waste – including options for higher value recycling or reuse for material that is already counted as recycled.
5% Landfill Target
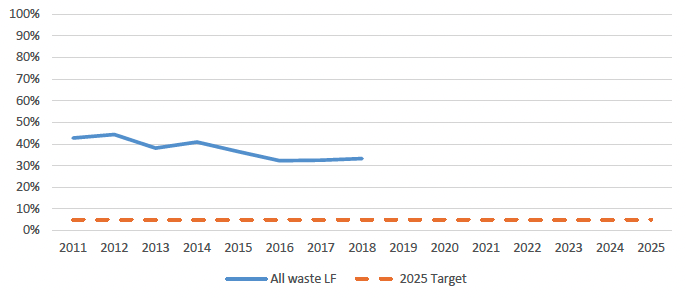
The all-waste landfill rate is the proportion (%) of all waste managed that is landfilled and the target set a maximum of 5% by 2025. Figure 8 summarises the trend in landfill rate since 2011, against the 2025 target.
In 2011 4.7 million tonnes of waste was landfilled, or 42.8% of all waste managed. By 2018 this had reduced to 3.7 million tonnes, or 32.1% of all waste managed. Following a clear decline between 2011 and 2016, the landfill rate has plateaued
at around 32% between 2016 and 2018 (the most recent landfill rate published
by SEPA).
According to more recent data, the absolute quantity of waste landfilled has significantly reduced from 3.7 million tonnes in 2018 to 2.6 million tonnes in 2020.[30] This reflects the expansion of incineration as an alternative to landfill for some wastes[31] and COVID-19 restrictions may also have impacted the 2020 figure. The ban on landfilling Biodegradable Municipal Waste (BMW) will be implemented in 2025. The ban is driving investment in the incineration of combustible wastes. In 2020 691,000 tonnes of biodegradable municipal waste was landfilled, half that reported in 2011.
In 2020 four waste types comprised 94% of all landfill tonnage: soils (834,000 tonnes, 32% of total landfilled); household and similar wastes (736,000 tonnes, 28% of total); sorting residues (689,000 tonnes, 26% of total); and mineral wastes (208,000 tonnes, 8% of total).
Despite the rapid growth in the incineration of waste, the 5% landfill target will be very challenging to meet by 2025. It is not technically or economically feasible to divert all currently landfilled wastes to incineration (e.g., soils and stones, mineral wastes, some sorting residues, and incinerator outputs). Assuming the 2025 waste generation target (15% reduction on 2011) is met, approximately 10.2 million tonnes of waste will require management[32]. Assuming a 5% maximum landfill rate on that amount, this equates to 508,000 tonnes, when soils and mineral wastes landfilled alone comprised over 1 million tonnes in 2020.
Contact
Email: circulareconomy@gov.scot