Tax policy and the budget – a framework for tax: consultation analysis
Results of the consultation we launched on 31 August 2021 on Tax Policy and the Budget – a Framework for Tax. This sought views on our overarching approach to tax policy, through Scotland’s first Framework for Tax, and how we should use its devolved and local tax powers.
5. Annex B – Public Attitudes Data
The Scottish Government has two longstanding tax questions in the Scottish Social Attitudes Survey covering 1) attitudes towards the level of tax and spending, and 2) attitudes towards the redistribution of income. However, the latest data from the survey is from 2019 and the Scottish Government sought to bridge this data gap and gather up-to-date evidence on tax knowledge and attitudes in Scotland.
In October 2020 and October 2021 the Scottish Government included questions in a YouGov omnibus survey to gather data on public attitudes to, and knowledge of, tax. The questions focused on the following areas:
- Attitudes to levels of tax and spending.
- Views on personal tax levels (2021 only).
- Knowledge of the Scottish and UK tax systems.
Key Findings
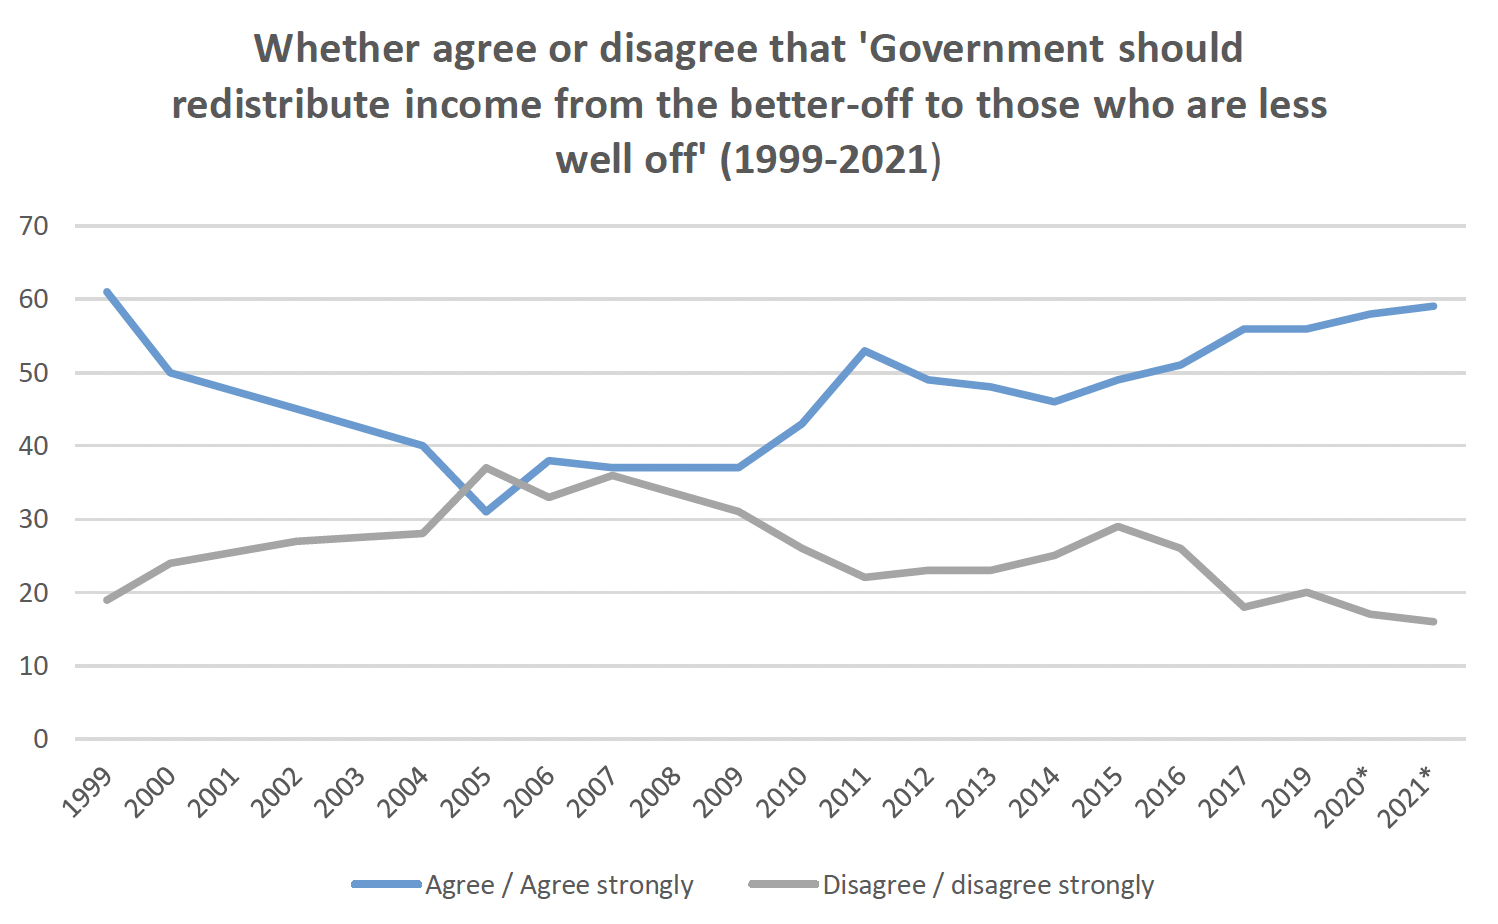
- A majority of people in Scotland (58% in 2020 and 59% in 2021) continue to agree that the government should redistribute income from the better off to the less well.
- In 2021 46% of people in Scotland said they would prefer that tax and spending be increased.
- In 2021 48% of people in Scotland said they would prefer that tax and spending be kept the same.
- Between 2019[1] and 2021 a growing proportion of people felt that tax and spending should be kept the same (37% in 2019 vs. 48% in 2021) rather than increased (55% in 2019 vs. 46% in 2021).
- 40% of people said that they would be prepared to pay more taxes themselves to fund public services, with 21% of people saying that they would accept some cuts to public services rather than paying more taxes themselves.
- Of those that responded saying they would be prepared to pay more in taxes, the most popular options for these were to be paid through income taxes (63%), a green/environmental tax (33%), consumption taxes like VAT (30%), and local taxes (27%).
- A small majority of people (52%) believe that the amount of tax that they and their family pay is about right, 28% believe that it is too high, and only 3% feel that it is too low.
- Public understanding of the tax system, through self-reporting, has decreased over the past year. Respondents indicated a better understanding of the UK tax system (52% said they understood it fairly or very well) in comparison to their understanding of devolved taxes (39% said they understood it fairly or very well). These are decreases from 59% and 44% respectively in the 2020 omnibus survey.
- In relation to how people find out their information about tax, the most common responses were the UK Government website (22%), the Scottish Government website (11%), and mainstream media (10%). However, 26% of people answered that they do not find any information on tax.
Data
| Scottish Social Attitude Survey 2019 Findings | YouGov 2020 Findings | YouGov 2021 Findings | |
|---|---|---|---|
| Agree strongly | 26% | 26% | 26% |
| Agree | 30% | 32% | 33% |
| Total Agree | 56% | 58% | 59% |
| Neither | 24% | 26% | 27% |
| Disagree | 13% | 12% | 11% |
| Disagree strongly | 7% | 5% | 5% |
| Total Disagree | 20% | 17% | 16% |
* 2020 and 2021 – YouGov omnibus survey data (all other data from the Scottish Social Attitudes Survey)
Figure 1 shows how views on the issue have changed over time. Agreement with the statement was at its highest level when the question was first asked in 1999 then steadily declined until 2005, when for the first time the proportion disagreeing (37%) that the government should redistribute income to the less well-off was higher than the proportion agreeing (31%). Views remained stable up to around 2009 but thereafter diverged with an increasing proportion agreeing that government should redistribute income to the less well off, with an increase of 22 percentage points between 2009 and 2021, from 37% to 59%. This has been matched by a roughly equal decline in the numbers disagreeing with the statement.
| Scottish Social Attitudes Survey 2019 Findings | YouGov 2020 Findings | YouGov 2021 Findings | |
|---|---|---|---|
| Reduce taxes and spend less on health, education and social benefits | 4% | 6% | 7% |
| Keep taxes and spending on these services at the same level as now | 37% | 46% | 48% |
| Increase taxes and spend more on health, education and social benefits | 55% | 48% | 46% |

* 2020 and 2021 – YouGov omnibus survey data (all other data from the Scottish Social Attitudes Survey)
Figure 2 shows how attitudes to taxation and spending have changed over the past 22 years. Reducing the level of taxation and spending has consistently been the least popular response option with the proportion selecting this option never higher than 1 in 10. However, the proportion believing that the level of taxation and spending should either be increased or kept the same has fluctuated over time.
| YouGov 2021 Findings | |
|---|---|
| I am prepared to pay more taxes myself in order to fund public services | 40% |
| I am prepared for some cuts to public services rather than pay more taxes myself | 21% |
| Neither | 25% |
| Don't know | 15% |
| YouGov 2021 Findings | |
|---|---|
| Income taxes | 63% |
| Green/environmental taxes | 33% |
| Consumption taxes (e.g. VAT) | 30% |
| Local taxes (e.g. Council Tax) | 27% |
| Other taxes* | 3% |
| Don't know | 8% |
* Popular responses to other taxes included; wealth taxes, land and/or landlord/property taxes, business taxes, and health taxes.
| YouGov 2021 Findings | |
|---|---|
| Too high | 28% |
| About right | 52% |
| Too low | 3% |
| Don't know | 17% |
| Scotland | UK | |||
|---|---|---|---|---|
| 2020 | 2021 | 2020 | 2021 | |
| Understand them very well | 7% | 7% | 9% | 10% |
| Understand them fairly well | 37% | 32% | 50% | 42% |
| Total Understand | 44% | 39% | 59% | 52% |
| Do not understand them that well | 33% | 35% | 26% | 31% |
| Do not understand them at all | 17% | 18% | 10% | 10% |
| Total Do Not Understand | 50% | 53% | 36% | 41% |
| Don't know | 6% | 8% | 5% | 7% |
| Omnibus Survey 2021 Findings | |
|---|---|
| UK Government website | 22% |
| Scottish Government websites | 11% |
| Mainstream media (newspapers, TV and radio) | 10% |
| Friends and family | 7% |
| Independent websites | 6% |
| My employer | 5% |
| Independent tax professional organisations | 3% |
| Social media | 2% |
| Other | 2% |
| Don't know | 6% |
| Not applicable – I don't find information on tax | 26% |
Survey Methodology and Caveats
Whilst caution has to be taken when comparing results from different surveys, most methodologies tend to take a representative sample of the Scottish population to ensure a consistent and robust sample of respondents is maintained. Questions 1 and 2 follow the same wording in both the 2019 Scottish Social Attitudes Survey and the 2020 YouGov omnibus survey, with questions 6 and 7 following the same wording from the 2020 YouGov omnibus survey. This means that comparing the results from 2021's omnibus survey should be relatively robust.
The YouGov fieldwork was undertaken between:
- 9 - 13 October 2020, with the survey carried out online. The total sample size was 1,042. The figures have been weighted and are representative of all adults in Scotland (aged 18+).
- 4 - 8 October 2021, with the survey carried out online. The total sample size was 1,051. The figures have been weighted and are representative of all adults in Scotland (aged 18+).