Publication - Research and analysis
Take-up rates of Scottish benefits: November 2023
This publication contains our latest estimates of take-up of Scottish benefits delivered by Social Security Scotland. An 'Easy Read' version of this publication is available in the Supporting Documents section.
Scottish Child Payment: Local Authority Take-Up Rate Estimates
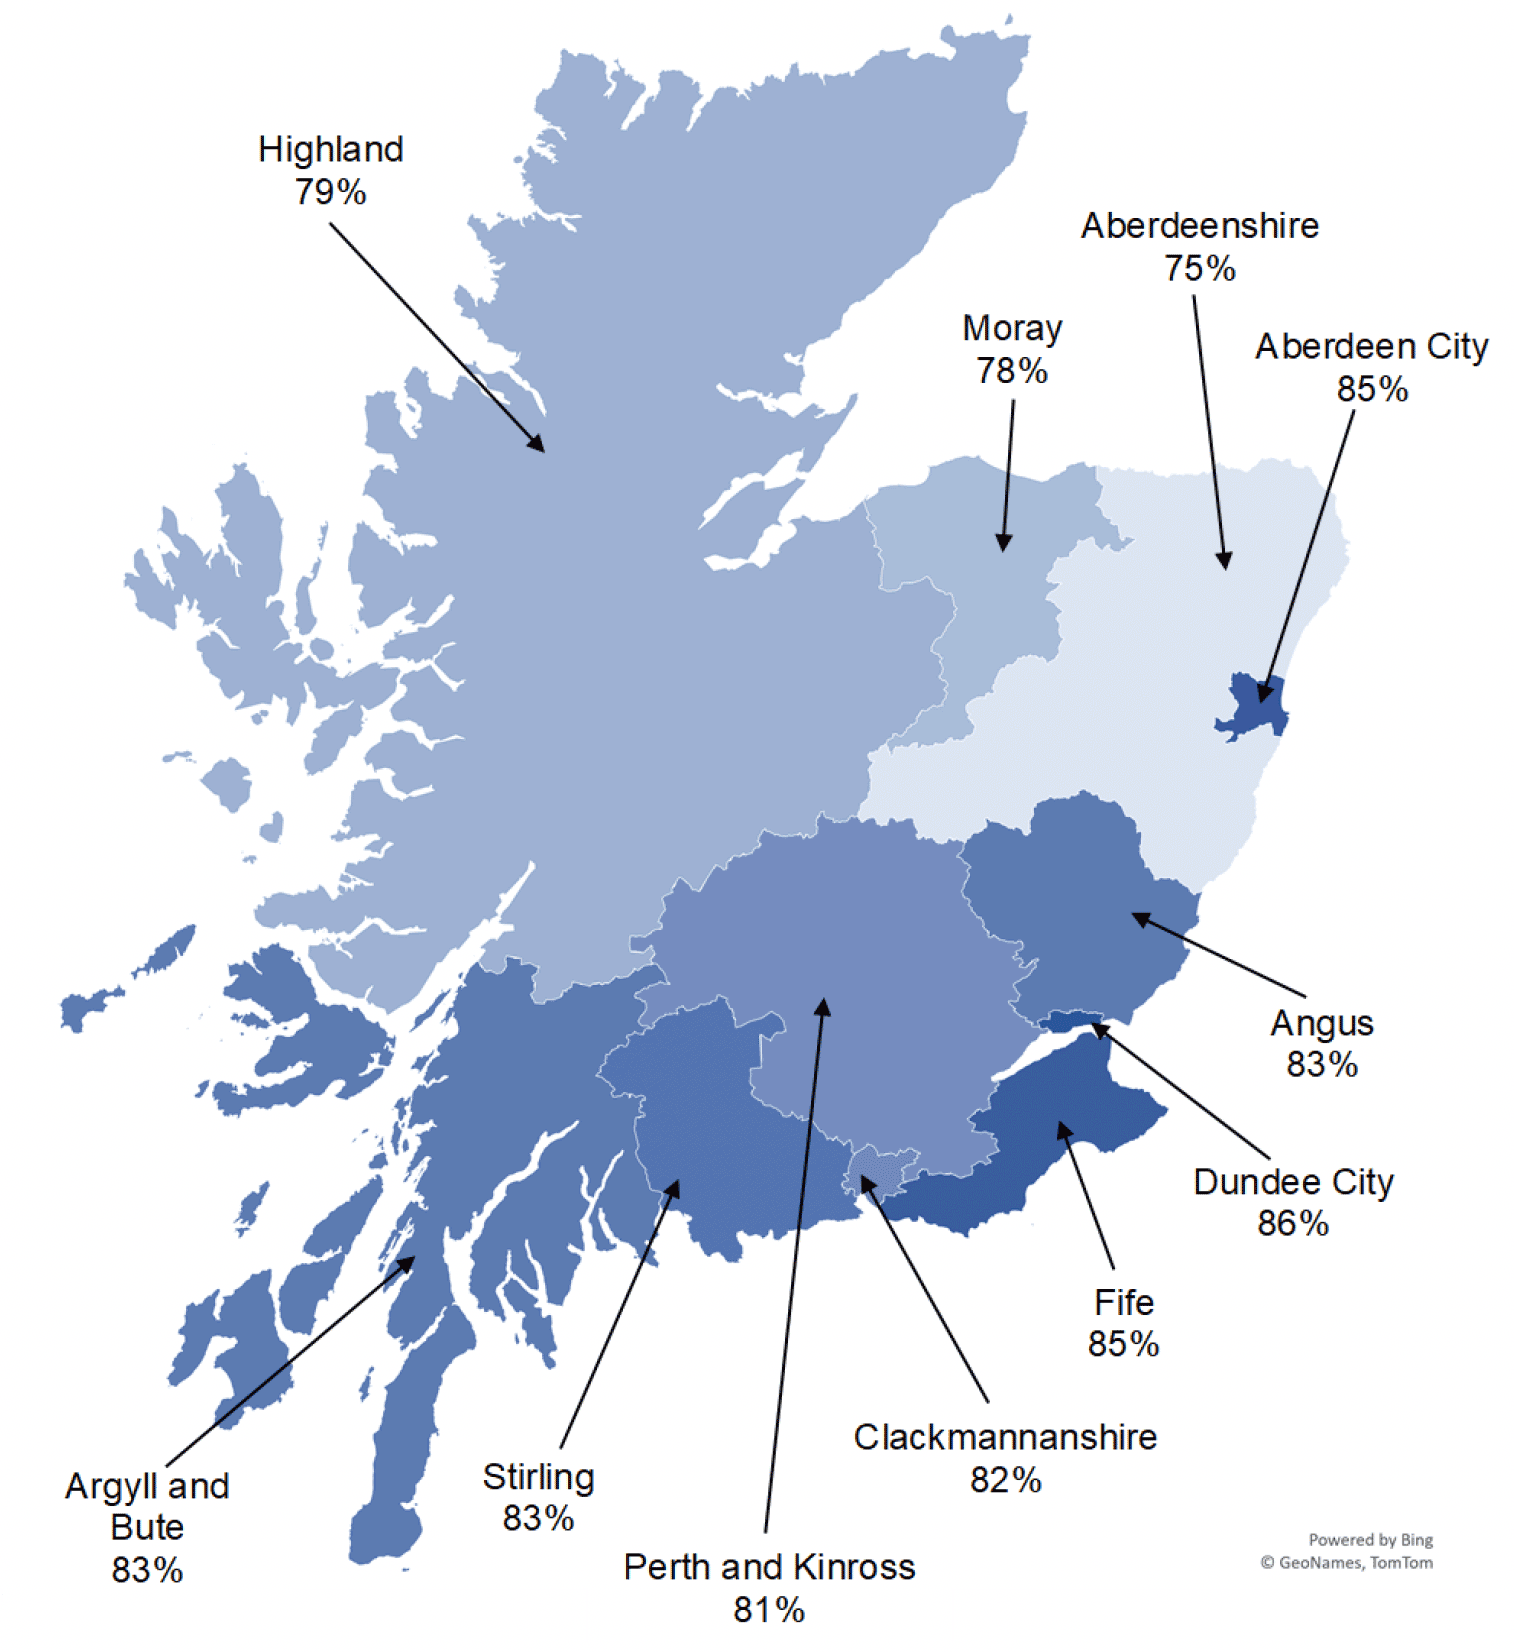
The following maps and table (Table 3) show estimated take-up rates for Scottish Child Payment (all children under 16) across local authorities in Scotland as a snapshot for March 2023:
Scotland
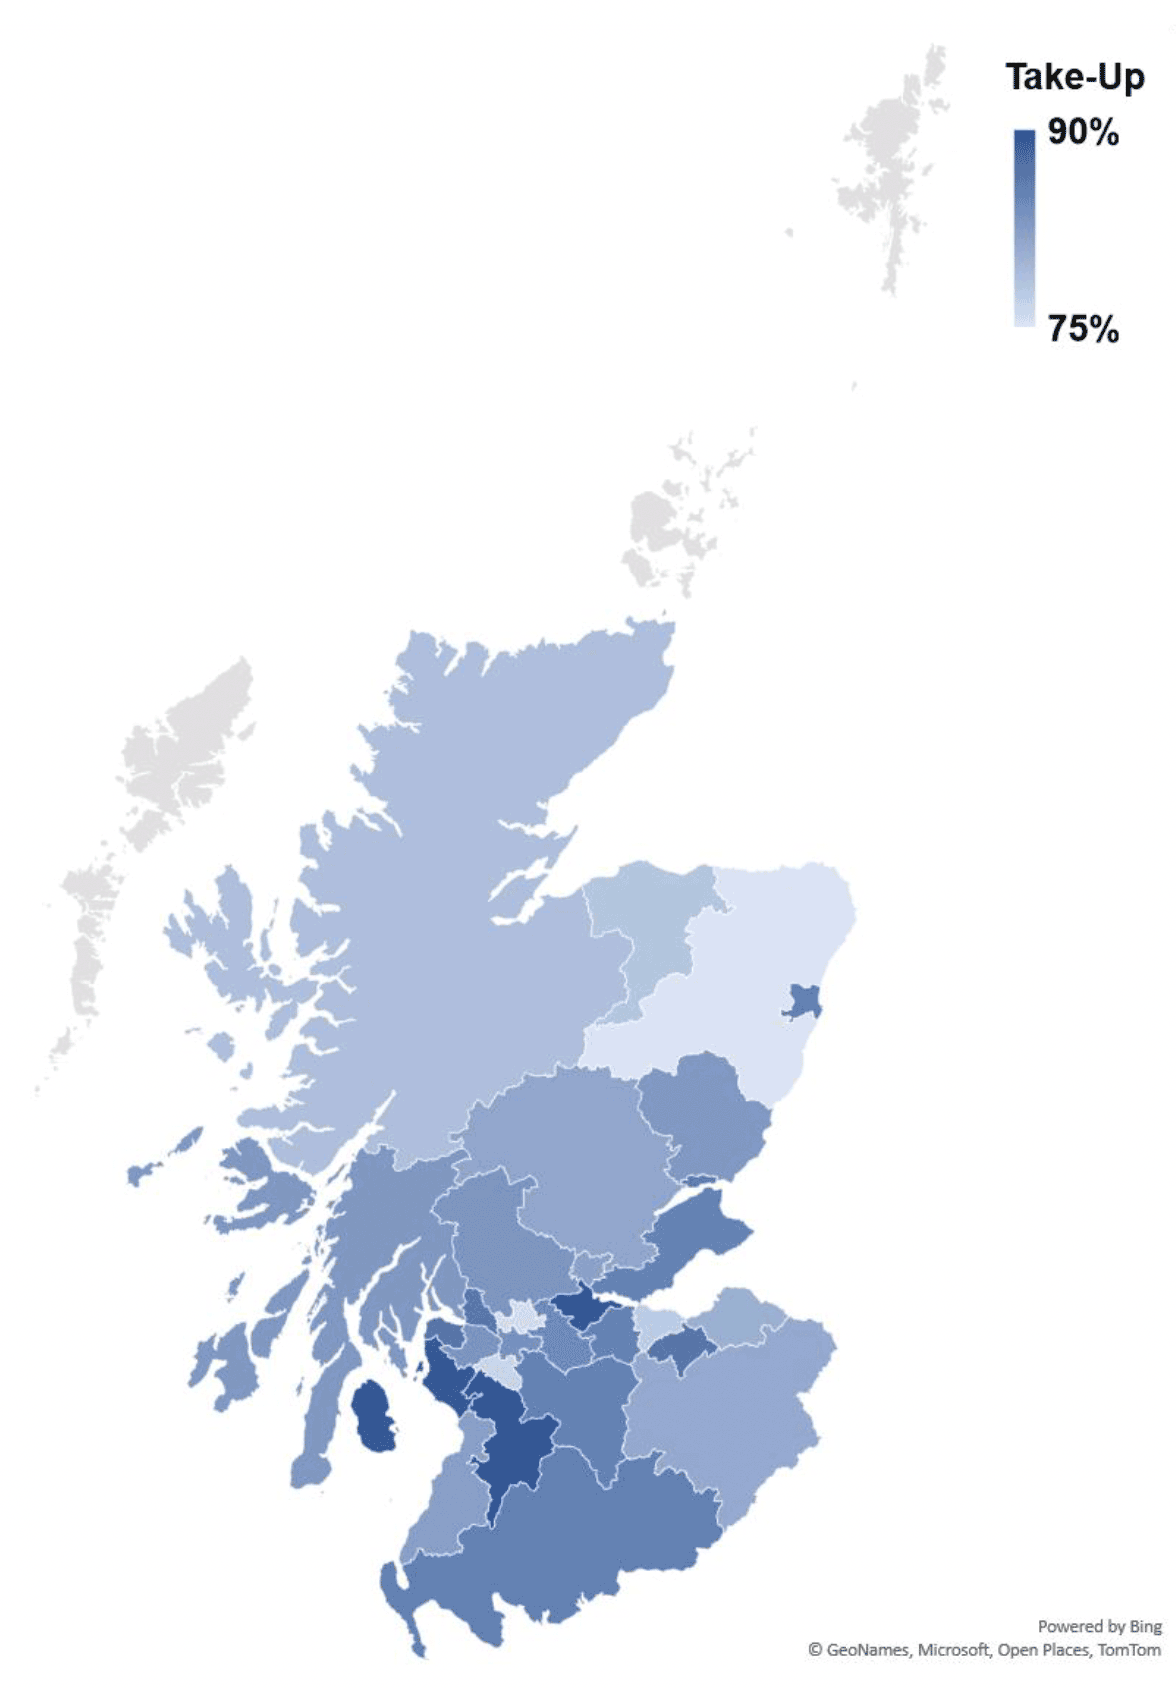
Map 1
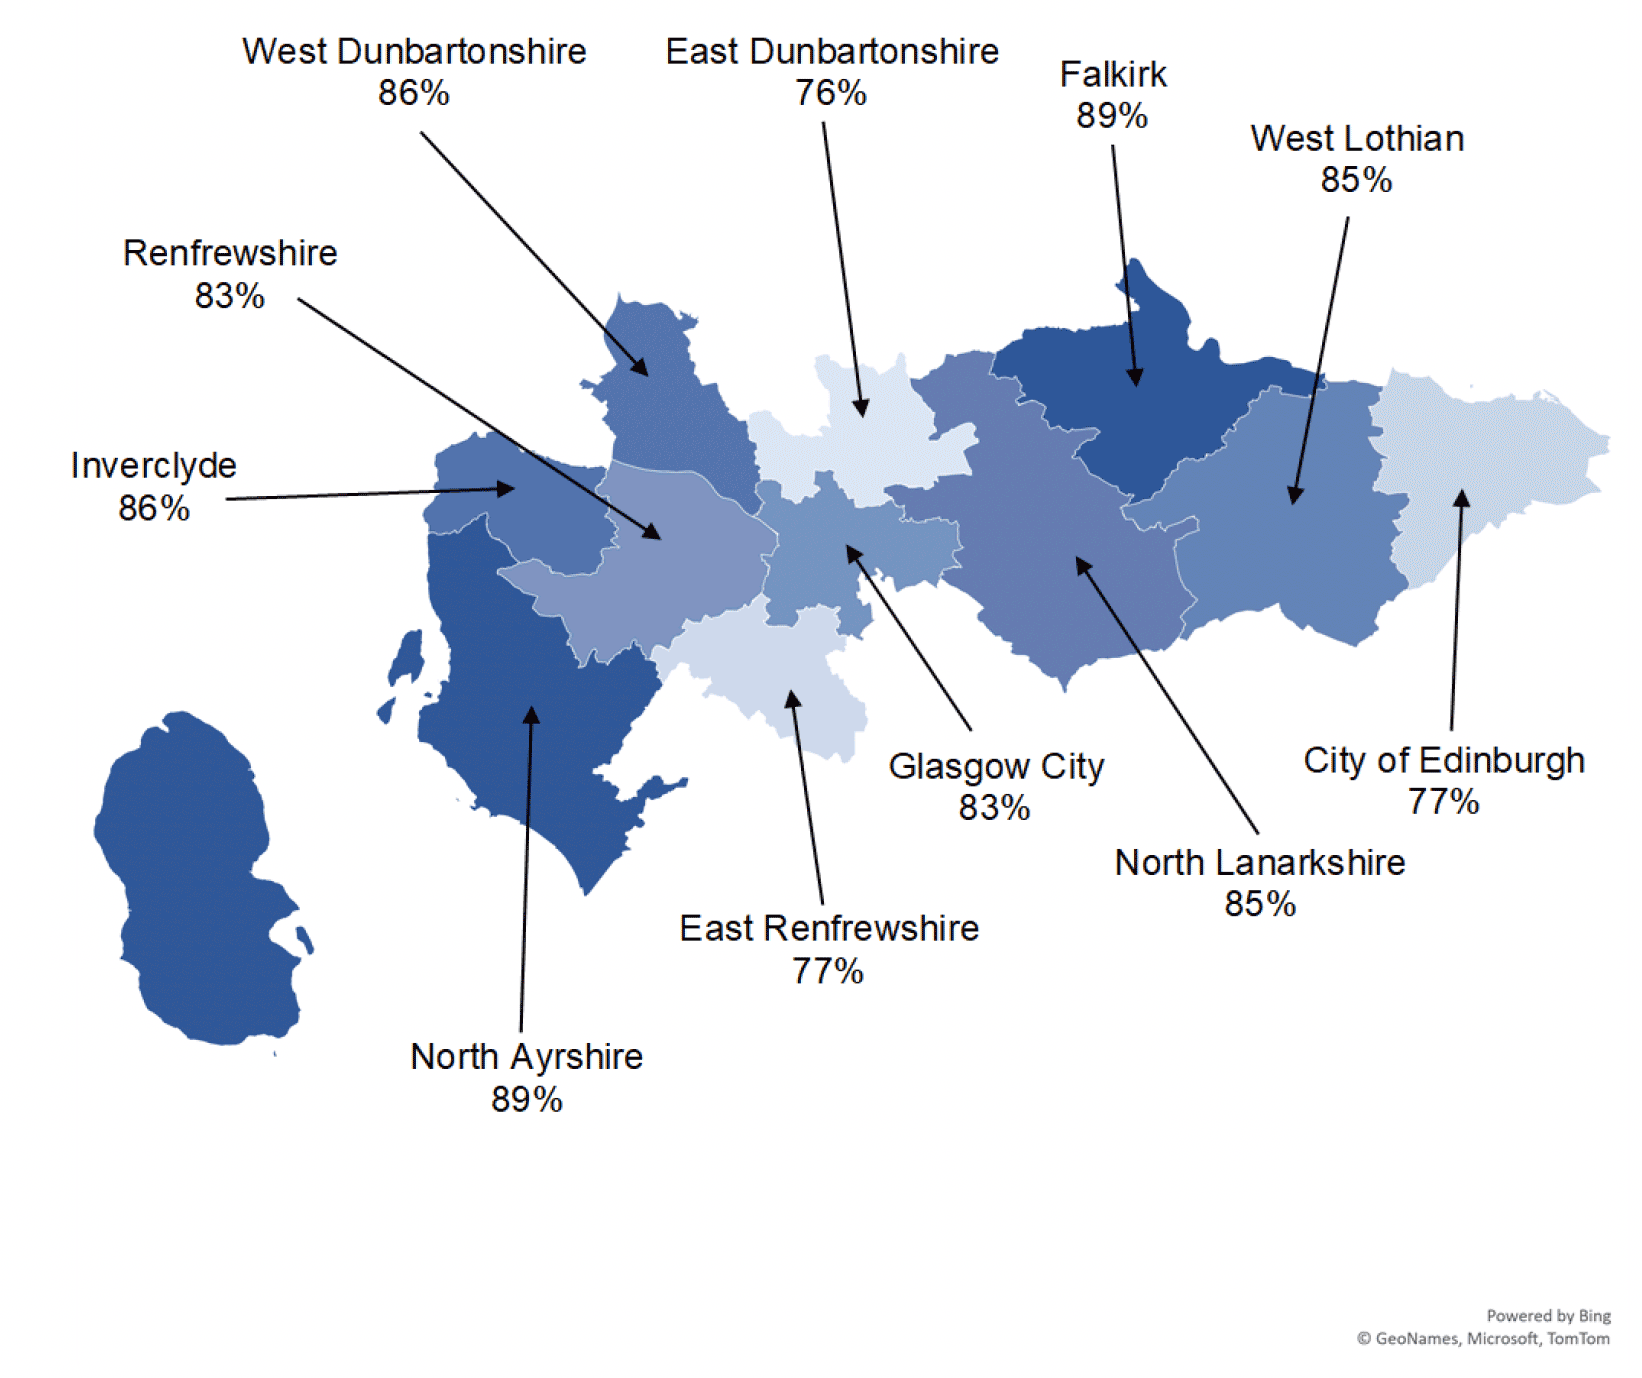
Map 2
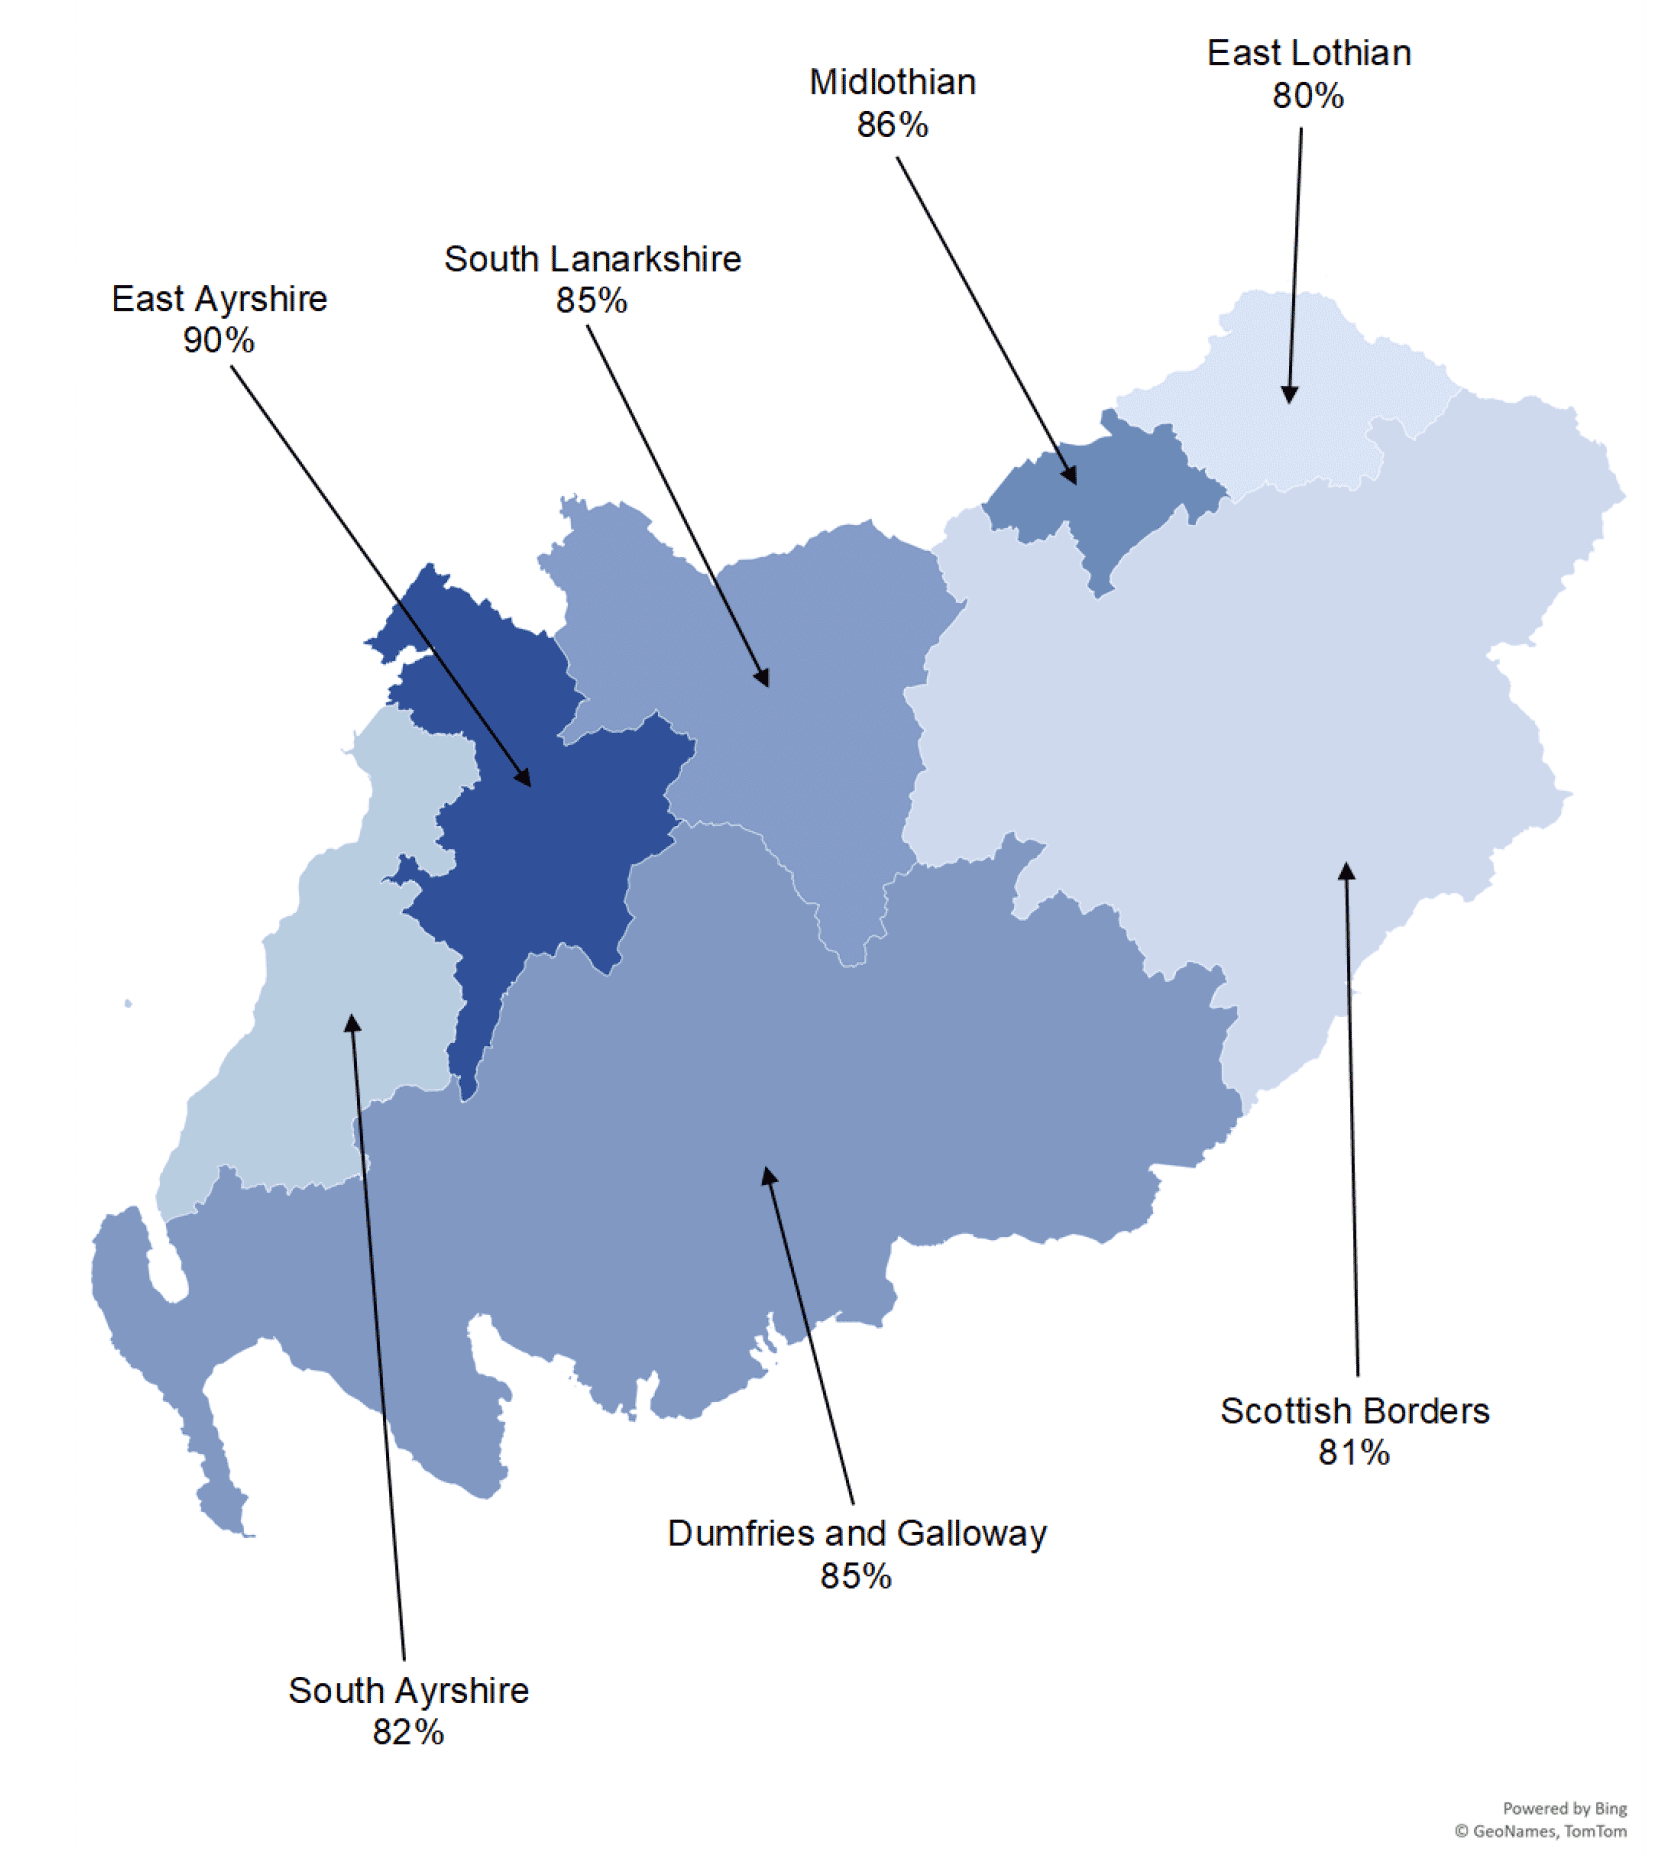
Map 3
| Local Authority | Estimated Take-Up Rate for March 2023 |
|---|---|
| Aberdeen City | 85% |
| Aberdeenshire | 75% |
| Angus | 83% |
| Argyll and Bute | 83% |
| Clackmannanshire | 82% |
| Dumfries and Galloway | 85% |
| Dundee City | 86% |
| East Ayrshire | 90% |
| East Dunbartonshire | 76% |
| East Lothian | 80% |
| East Renfrewshire | 77% |
| Edinburgh, City of | 77% |
| Falkirk | 89% |
| Fife | 85% |
| Glasgow City | 83% |
| Highland | 79% |
| Inverclyde | 86% |
| Midlothian | 86% |
| Moray | 78% |
| North Ayrshire | 89% |
| North Lanarkshire | 84% |
| Perth and Kinross | 81% |
| Renfrewshire | 83% |
| Scottish Borders | 81% |
| South Ayrshire | 82% |
| South Lanarkshire | 85% |
| Stirling | 83% |
| West Dunbartonshire | 86% |
| West Lothian | 85% |
Estimates for Orkney Islands, Shetland Islands and Na h-Eileanan Siar have not been included because the number of recipients is below 1000 children, deemed to be below the minimum threshold required for confidence in estimates.
Contact
Email: ceu@gov.scot