Survey nonresponse research: appendices
Appendices to the Understanding Survey Nonresponse Behaviours main report, providing detailed information on each element of the research, including the literature review, analysis of nonresponse data, and qualitative research with interviewers, survey stakeholders, and the general public.
Appendix B: Analysis of nonresponse data from Scottish Government general population surveys
Summary of key findings
- Headline response rates across the three surveys appeared to be relatively stable from around 1999 to 2011 (though we do not know if the underlying first issue response rate was changing but hidden by the increased use of reissues).
- The headline response rate for all three surveys declined between 2012 and 2019. The scale of this decline was partially masked by increased used of reissues, particularly on the SHS and SCJS.
- There was a more sizeable drop in the headline response rate between 2019 and 2022. However, the scale of the drop in first issue response on SHS and SCJS in particular was considerably lower than that suggested by the headline figures, because of the intentional decreased use of reissues post-Covid. This decision was taken on the basis of previous research that suggested that the benefits of reissues are uncertain in terms of impact on data quality and nonresponse bias.[4]
- The decline in the response rate to all three surveys over time has almost entirely been driven by an increase in the proportion of people who refuse to take part. The rate of non-contact and other nonresponse has been broadly stable over the last 20 years.
- Analysis of area and individual factors suggests that hard-to-reach groups have, to a degree, become harder to reach over time. However, the picture is complex.
- Those in more deprived areas became increasingly less likely to respond in the period 2012 to 2019, but this trend did not continue post-Covid when, if anything, the gap between the highest and lowest responding SIMD quintiles narrowed slightly.
- There is no clear pattern of change in response rates by rurality, with those in large urban and other areas consistently less likely to respond.
- The age gap in terms of response does seem to have worsened over time, with an increase in underrepresentation of the 25-34 group and overrepresentation of the 75+ group most noteworthy.
- In terms of ethnicity, those identifying as “White: Other British” have been overrepresented, but this has reduced over time. From 2012 to 2019, those from minority ethnic groups (excluding white minority backgrounds) became more underrepresented, while those from “Other: White” backgrounds were less underrepresented. These patterns reversed between 2019 and 2022.
- Broadly, the surveys became more representative in terms of the educational attainment of respondents between 2012 and 2019. However, the gap widened between 2019 and 2022.
- In terms of tenure, ‘other renters’, which includes private renters, became increasingly underrepresented between 2017 and 2022.
Introduction and background
A key element of this study is to extend understanding of how patterns of response have changed over time and the impact that this might have on the measures that the three major cross-sectional general public Scottish Government surveys collect. This appendix summarises patterns of response on these surveys in the two decades before the pandemic, with a particular focus on the period 2012-2019, and on the immediate post-Covid waves. It covers:
- A summary of the definitions of response in the surveys, the key drivers of response, and our approach to the analysis.
- Patterns of response over time and trends in the three different types of nonresponse: refusals, non-contacts, and other nonresponse.
- Whether reductions in response rates have been consistent across areas/groups, or whether groups who were hard-to-survey have become even more difficult to survey, relative to other groups.
The analysis focuses primarily on the headline measure of response. This is defined slightly differently in each of the three different studies:
- For the Scottish Household Survey (SHS) this is defined as completing the household (first) part of the interview, by a householder or their spouse.
- For the Scottish Crime and Justice Survey (SCJS), the interview is done by an adult selected at random from all adults in the household.
- For the Scottish Health Survey, the headline response rate is household response, with at least one adult aged 16 or over responding.
Other drivers of response
A main aim of this research is to explore the impact of changing societal factors (social environment, individual and household characteristics) on response – how easy it is to contact potential respondents and to persuade them to take part in research. As well as these societal factors, response patterns will also be driven by a number of other factors that are susceptible to change over time:
- Design factors. Except for waves affected by the COVID-19 pandemic, the design of the three surveys has been relatively consistent across time. Key changes have included:
- In 2012, the Scottish House Condition Survey became part of the SHS and the questionnaire increased from 45 to 60 minutes long;
- From 2016, the SCJS moved to an annual design from a biennial one;
- In 2018, the sample size for SHeS increased by 30% and the Office for National Statistics (ONS) assisted with the fieldwork from then until the pandemic.
- In addition, advance materials, questionnaire coverage, and underlying sampling assumptions all change over time and these changes may influence patterns of response.
- Fieldwork effort. As far as we are aware, the main protocols for the number and pattern of visits have been consistent over time across all three surveys: namely 6+ visits with one at an evening and one at a weekend. However, as we discuss further, the level of reissuing has changed significantly over time. Data is available for at least some waves of the SHS and SHeS from 2012 onwards to enable analysis of response rate at first issue as well as final response rates. This enables us to understand patterns in response rates independent of any change in reissuing.
- Interviewer quality and capacity. We do not have data to assess whether and how interviewer quality and capacity has changed over time. In the aftermath of the pandemic, there were some issues with interviewer capacity in Scotland. This meant that not all addresses on all three surveys were fully worked[5]. Interviewer quality is also likely to be correlated to retention rates, with more experienced interviewers tending to be more successful than newer interviewers. The period after the COVID-19 pandemic saw a significant influx of new interviewers, with a sizeable proportion deciding not to return after the pandemic. It might therefore be expected that interviewer quality changed most rapidly during this period.
In 2012, the introduction of the harmonised core and both the SHS and SCJS moving to a fully unclustered sampling approach;
Data sources
To enable the analysis presented in this appendix, the Scottish Government supplied three sources of data for 2012 onwards for each survey wave, where available:
- Outcome data at address level. There were some differences in the details held for each wave, including whether outcomes for each issue were reported, or if only a final outcome was recorded in the available data. Response rates included in technical reports have been calculated in slightly different ways across the surveys over the different waves. We recalculated the overall response rates[6] using a standardised approach (Lynn et al, 2001).
- Sample details. We used datazone[7] of address to link in two area-based measures, area deprivation[8] and the UrbanRural 6-fold classification[9] to the outcome data provided.
- Scottish Survey Core Questions (SSCQ) data. The SSCQ are a set of key questions covering the main demographic factors. These were harmonised across the three surveys in 2012.
Additionally, we collated information from technical reports where possible. This was partly used to check the analysis of the outcome data but also to compare longer-term trends in the headline response rates and to collate information on aspects of response other than the overall headline response rate.
Overall response rate trends over time
Figure B.1 shows the headline response rate trends for the three major surveys plus the Scottish House Condition Survey (this became a component of the SHS in 2012). With the exception of the 1996 Scottish Crime Survey[10], the response rate from around the start of the major surveys to 2012 was relatively stable:
- Between 1999 and 2011, the biennial SHS response rate varied from a minimum of 65.3% (in 1999/2000) to a maximum of 68.6% (in 2005/2006)[11].
- Between 1996 and 2011, the SHCS response rate ranged from 67% (in 2005) to 70% (in 2003)[12].
- Between 2000/2001 and 2012/2013, the response rate for the SCJS (and its predecessor the Scottish Crime Survey) changed from 69.7% to 67.7%.
- The response rate in the 2003 SHeS was 67%. Between 2008 and 2010, the response rate ranged from 61% to 64%.
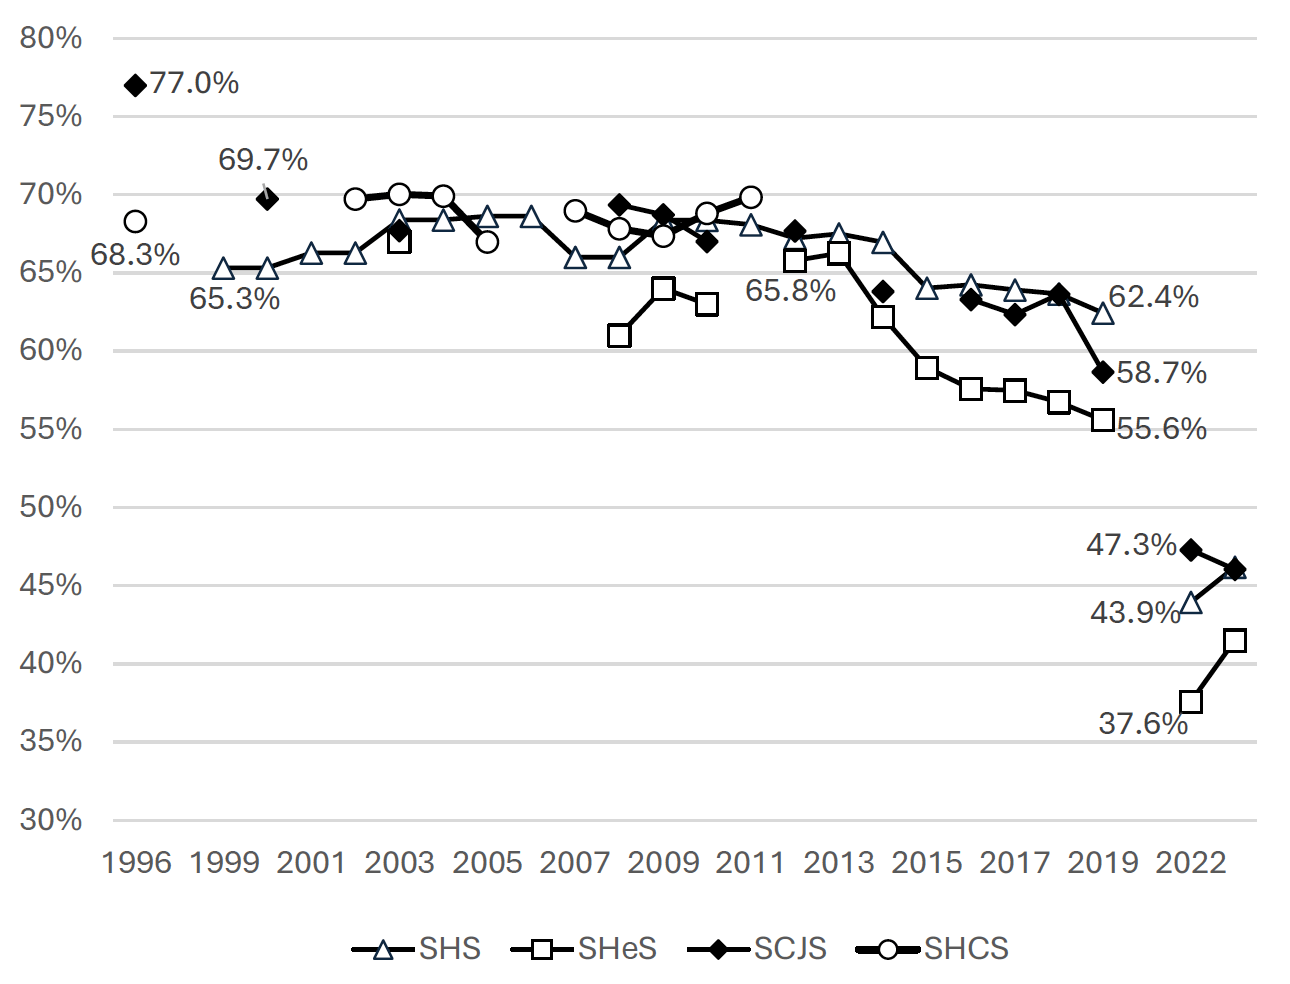
Between 2012 and 2019, there was a steady decline in the headline response rate across all three surveys, although the gradient of that decline varied between surveys:
- SHS: From 67.2% in 2012 to 62.4% in 2019, a drop of 4.8pp.
- SCJS. From 67.7% in 2012 to 58.7% in 2019, a drop of 9.0pp.
- SHeS. From 65.8% in 2012 to 55.6% in 2019, a drop 10.2pp.
While it is difficult to disentangle wider societal factors from other factors, the most marked change in response rates over this 7-year period was around 2013-2016. It is worth noting that this coincided with the Scottish Independence Referendum of 2014 and the Brexit Referendum of 2016.
After the COVID-19 pandemic, there was a large drop in the headline response rates in 2022, with a small increase in the response rate in 2023 for two of the three surveys.
- SHS: 43.9% in 2022, a drop of 18.5pp compared with pre-pandemic, and 46.2% in 2023, an increase of 2.2% on the previous year.
- SHeS: 37.3% in 2022, a drop of 18.0pp from 2019, and 41.5% in 2023, an increase of 3.9% on the previous year.
- SCJS. 47.3% in 2022, a drop of 11.4pp from 2019, and 46% in 2023, a further drop of 1.2% on the previous year.
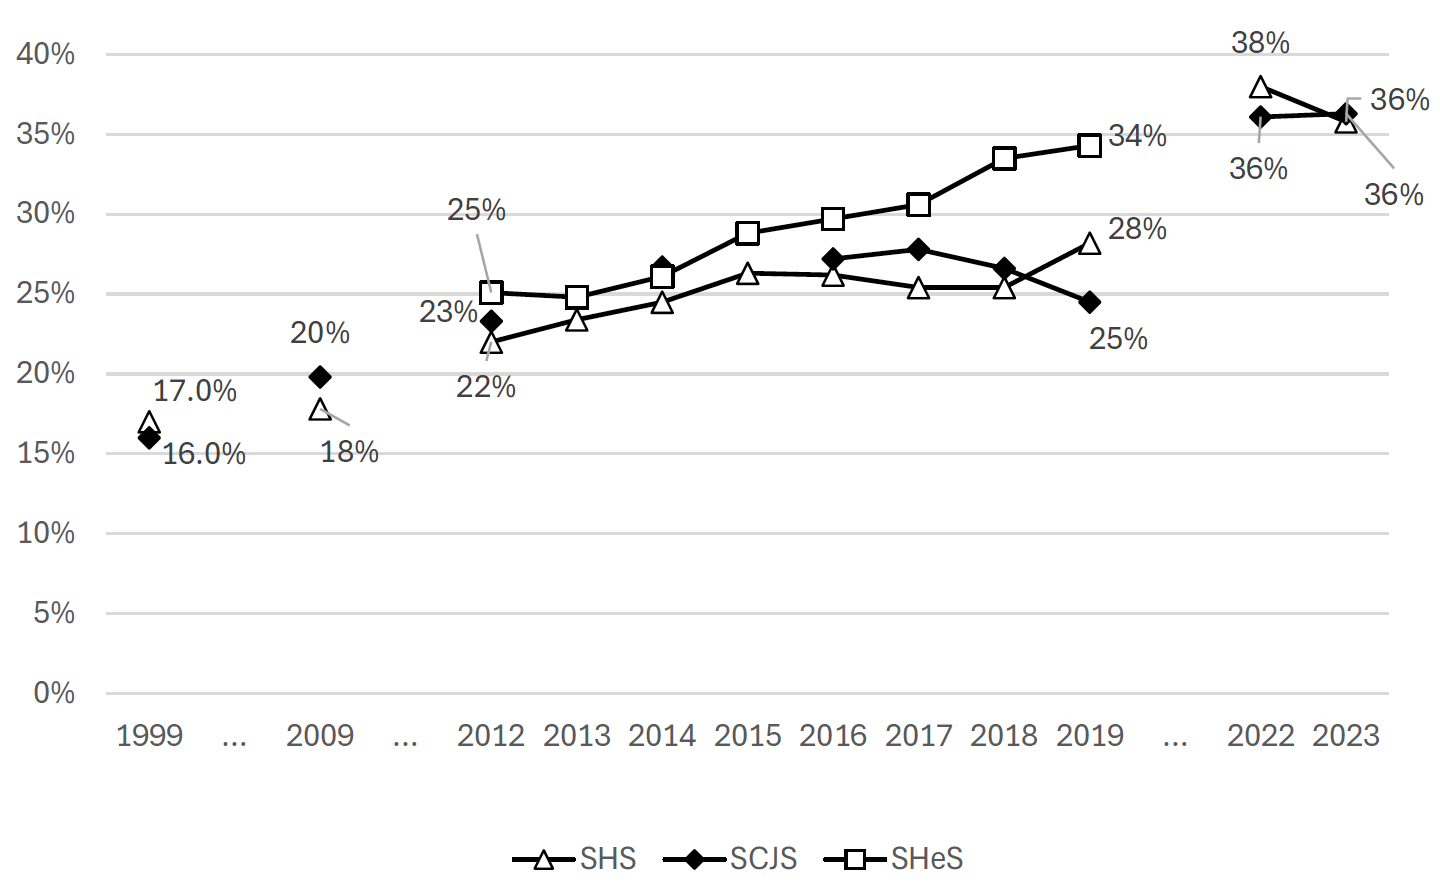
These trends in overall response rates over time across the three surveys partially reflect changes in fieldwork effort, especially in relation to the use of reissues to meet survey targets. In particular, the difference in the gradient of the decline in response rate between SHS and SHeS from 2012-2019 can partly be explained by the relatively higher level of reissuing on SHS over this period; the difference in first-issue response rates between the two was more modest. Meanwhile, the lower response rates since 2019 on SCJS and SHS in part reflects a decision to considerably scale back the use of reissues post-Covid[14] for both[15]. Only 6.2% of SHS addresses were reissued in 2022, compared with 40.5% of all SHS addresses being reissued in 2019. The final response rate therefore fell more sharply over this period than did the first issue response (although both did decline). This is illustrated in Table B.1 and B2, below.
| 2012 | 2013 | 2014 | 2015 | 2016 | 2017 | 2018 | 2019 | 2022 | 2023 | |
|---|---|---|---|---|---|---|---|---|---|---|
| SHS RR Final | 67.2% | 67.5% | 67.0% | 64.0% | 64.2% | 63.9% | 63.6% | 62.4% | 43.9% | 46.2% |
| SHS RR 1st Issue | 58.0% | 55.2% | 55.9% | 50.2% | 52.1% | 51.4% | 52.4% | 51.0% | 42.5% | 44.6% |
| Difference | 9.2% | 12.3% | 11.0% | 13.8% | 12.1% | 12.5% | 11.3% | 11.4% | 1.5% | 1.6% |
| SHeS RR Final | 65.8% | NA | NA | 58.9% | 57.6% | 57.5% | 56.7% | 55.6% | NA | NA |
| SHeS RR 1st Issue | 58.8% | NA | NA | 53.5% | 53.8% | 48.7% | 50.6% | 48.9% | NA | NA |
| Difference | 7.0% | NA | NA | 5.4% | 3.8% | 8.8% | 6.1% | 6.7% | NA | NA |
| SCJS RR Final | NA | X | NA | X | NA | NA | 63.6% | NA | 47.3% | NA |
| SCJS RR Ist Issue | NA | X | NA | X | NA | NA | 55.6% | NA | 46.1% | NA |
| Difference | NA | X | NA | X | NA | NA | 8.0% | NA | 1.2% | NA |
| SCJS | SHeS | SHS | |
|---|---|---|---|
| 2012 | 22.6% | 27.0% | 33.6% |
| 2013 | X | NA | 37.8% |
| 2014 | 30.1% | NA | 39.2% |
| 2015 | X | 24.4% | 43.2% |
| 2016 | 34.4% | 22.8% | 40.7% |
| 2017 | 34.6% | 33.8% | 41.5% |
| 2018 | 31.5% | 28.4% | 38.4% |
| 2019 | X | 27.8% | 40.5% |
| 2022 | 4.4% | NA | 6.2% |
| 2023 | NA | NA | 6.8% |
We have no data prior to 2012 on the extent of reissuing. However, it is likely that the relative maintenance of the headline response rates over the decade up to 2012 may also have been due in part to increased reissuing to hit survey targets.
Changing reasons for nonresponse: refusal, non-contact and other nonresponse.
In this section, we turn to look at trends over time in three different types of nonresponse: refusals, non-contacts and other nonresponse.
Refusals
The main reason for the decline in response rates over time across all three surveys is because of an increase in refusals. Figure B.2 shows the trend in the refusal rate over time for the three surveys. While the rate of increases in refusal varied over time and between the three surveys, overall between 2012 and 2023, refusals had risen from 22-25% to 36-40%.
Trends in refusals are not impacted by changes in reissues, since reissuing does not have a large impact on the overall refusal rate. This is because, as well as converting previous refusals into successful interviews, other nonresponse outcomes such as non-contacts end up being converted to refusals. Patterns of refusal at first issue (not shown) show similar patterns to patterns of refusal at final issue over time.
One type of refusals is refusals direct to the office. This is when people proactively get in touch to opt-out in response to the advance letter normally before an interviewer visits. Trends in this metric are likely to be independent of any changes to the interviewer panel but are potentially sensitive to design of the advance materials.
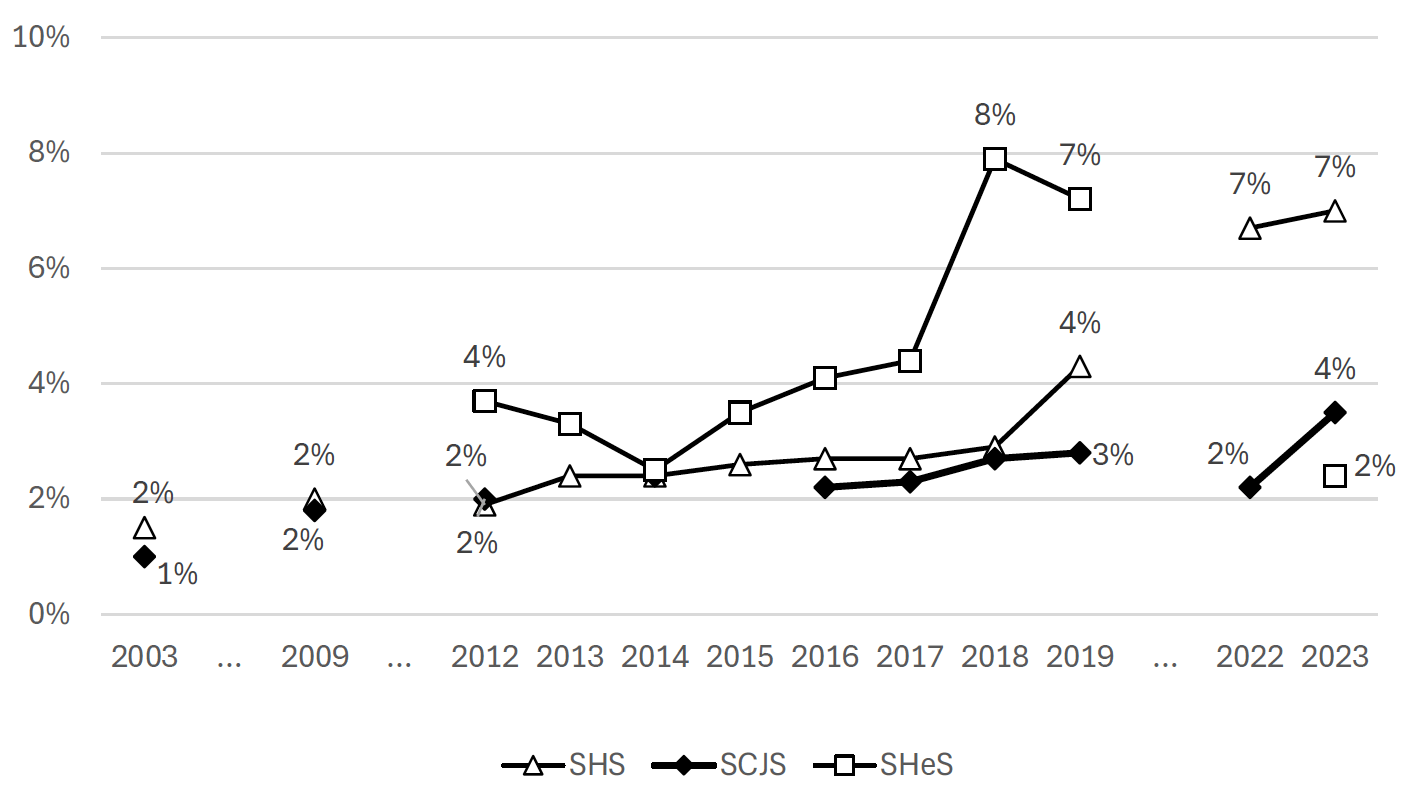
Both SHS and SHeS saw a rise in refusals direct to the office from 2012 to 2019 (from 1.9% to 4.3% and from 3.7% to 7.2%). The change for the SCJS is less pronounced (from 2.0% to 2.8%).
SHeS experienced a particularly marked rise between 2017 and 2018. This coincided with ONS undertaking a proportion of the SHeS fieldwork and therefore possible changes to procedures for recording office refusals. Importantly, there was also a small but significant change in the wording of the advance letter, with the phrase “or don’t want to take part” added before the freephone number. The text that was added to the letter in 2018 is highlight in Figure B.4 below.
Figure B.4: Extract from the SHeS advance letter 2018
Further info Answers to some questions you may have are on the back of this letter. You can also look at the enclosed leaflet or visit www.scottishhealthsurvey.org. If you would like to talk to someone about the study or don’t want to take part, please phone free on 0800 298 5313.
The pattern of office refusals post-Covid is less consistent across the surveys and is broadly driven by changes to advance materials. Office refusals for SHeS fell from 7.2% to 2.4% between 2019 and 2023. This is likely to be a result of a change in the SHeS advance letter, with the phrase “or don’t want to take part” taken out in 2022.
In contrast, the refusal rate increased for the SHS from 4.3% to 7.0% over the same period. In 2022, there was change to the design of the advance materials that is likely to have led to this increase. The section in the advance letter on ‘how to contact’ was amended to explicitly mention opting out, as seen in Figure B.5. The same section in the previous version of the letter was titled ‘How do I contact you?’ gave telephone numbers and email addresses for Ipsos and the Scottish Government, and did not explicitly mention opting-out.
For the SCJS, office refusals were relatively stable of the period 2019 to 2023, 2.8% and 3.5% respectively
Figure B.5: Extract from the SHS advance letter 2019
How do I arrange an interview, opt-out, or find out more information? To opt-out, arrange an interview, or see frequently asked questions, visit ipsos.uk/shs and enter code [CODE] or use the QR code on the front of this letter. Ipsos can be contact by email at shs@ipsos.com or through our participant portal. The Scottish Government team can be contact at shs@gov.scot. If you are a BLS user, you can contact the survey team via conactSCOTLAND-BSL [web address]
Non-contact
Figure B.6 shows non-contact trends over time. In summary, there is a gradual decrease in non-contact between 1999 to 2012, no major change in non-contact between 2012 and 2019 (except for the 2019/2020 wave of the SCJS that was affected by the start of the COVID-19 pandemic), and an increase in non-contact between 2019 and 2022.
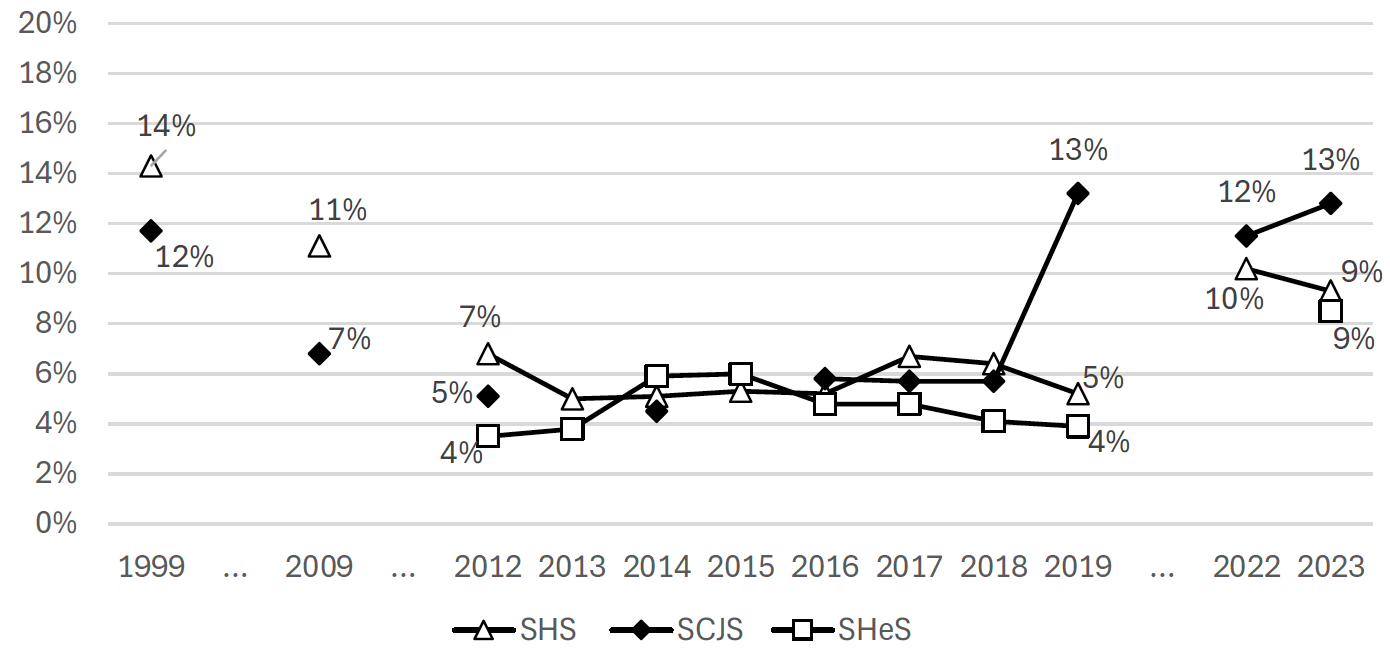
As non-contacts are one of the key outcomes at first issue that are reissued, non-contact rates will be closely influenced by the level of reissuing[17]. As would be expected, reissues reduce the number of non-contacts, increasing the proportion of households where an interviewer manages to make contact with a householder.
We have data on non-contact at first issue for selected waves between 2012 and 2023. This data suggests that the non-contact rate at first issue has been stable over this period, including in the period after the pandemic when the overall non-contact rate increased. (Table B.3).
| 2012 | 2013 | 2014 | 2015 | 2016 | 2017 | 2018 | 2019 | 2022 | 2023 | |
|---|---|---|---|---|---|---|---|---|---|---|
| SCJS | NA | X | NA | X | NA | NA | 10.3% | NA | 11.1% | NA |
| SHeS | 7.0% | NA | NA | 9.2% | 6.6% | 9.5% | 7.1% | 7.4% | NA | NA |
| SHS | 11.7% | 11.1% | 10.7% | 13.2% | 11.7% | 13.2% | 11.0% | 10.0% | 10.6% | 9.4% |
This again suggests that during the decade before 2012, the use of reissuing might have been increasing and that the headline response rate may have been maintained in part by more interviews being achieved from reissued addresses.
Other nonresponse
Other nonresponse covers a wide range of different categories. These include being ill at home or in hospital, physically or mentally unable to take part, language barriers, lost data and data deletion requests.
As shown in Figure B.7, the level of other nonresponse was generally stable up to 2019, though slightly higher in SHeS than in the other two studies:
- SHS, 3.5% +/- 1pp in all waves pre-Covid.
- SCJS, 3.8% +/- 1.2pp in all waves pre-Covid
- SHeS, 6.2% +/- 1.1pp in the period 2012-2019
Between, 2019 and 2023, there was an increase in other nonresponse across all three surveys; for SHS, a small increase from 2.5% to 3.5%; for SCJS, an increase from 3.6% to 4.8%: and for SHeS, a more sizeable increase from 5.5% to 8.2%.
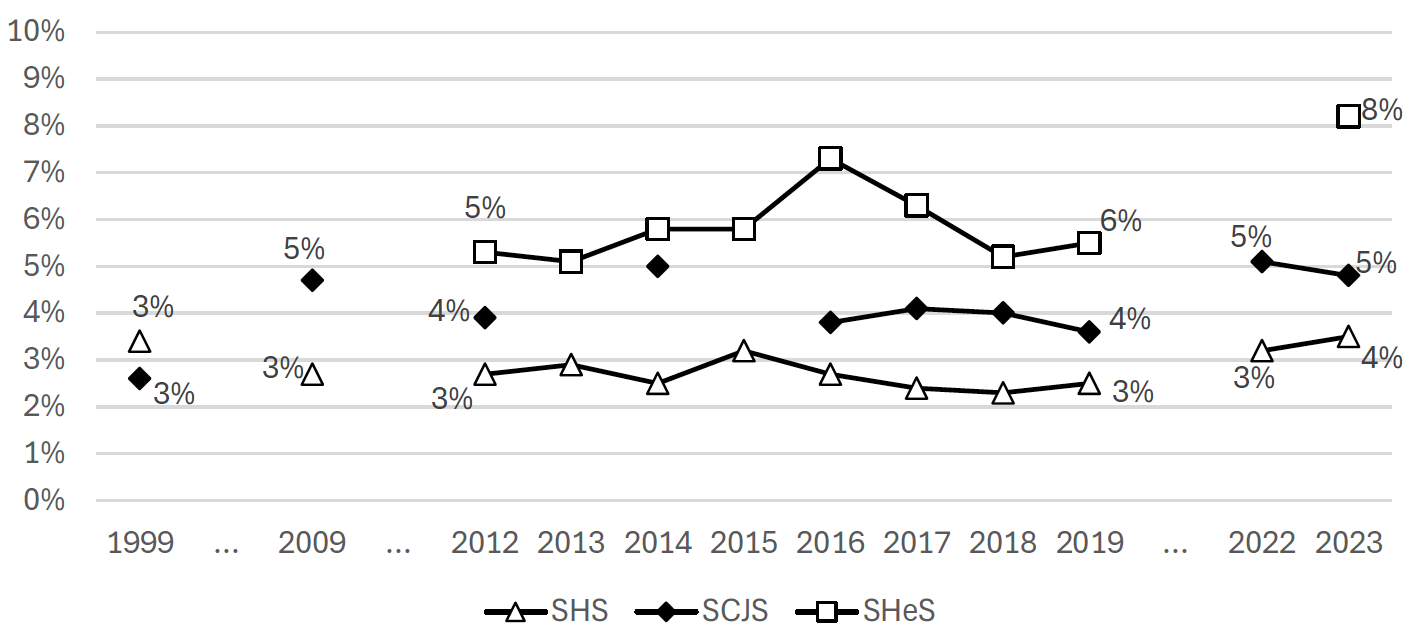
The increase in the SHeS figures between 2019 and 2023 was because of increases across a range of different categories[19] rather than being driven by increases in one or two types of nonresponse in particular.
Are harder-to-reach groups getting harder to reach?
Traditionally, response rates have been used as a key proxy of survey quality. However, as discussed in our previous report for the Scottish Government (Ormston et al, 2024), response rates are not generally a good measure of survey error or bias. Analysing the impact of falling response rates on nonresponse bias is not straightforward as there is generally no information on people who do not take part. While previous research has tended to agree on the demographics of those who respond less frequently (as discussed in the previous appendix), it is less clear if those who have traditionally been hard-to-reach are becoming harder to reach. If this is the case, the fall in the response rate has greater potential to increase non-response bias.
We examined this in two ways:
- By examining whether changes in response rates over time has been consistent across different types of area, in relation to deprivation and rurality. We based this analysis on first issue response rates as these are not affected by reissuing that may have been driven by sub-national targets[20].
- By comparing unweighted estimates from the Scottish Survey Core Question (SSCQ) data to census estimates to assess if some groups were becoming less represented over time for four person/household level factors. The Scottish Surveys Core Questions dataset gathers survey responses from identical questions in the SCJS, SHeS and the SHS into one output. We examine age, ethnicity, attainment, and tenure.
Response over time by area deprivation (SIMD)
The greater the variability in response rate by area, the more potential there is for estimates to be impacted by nonresponse bias. Figure B.8 shows the average first issue response rates for the SHS and SHeS between 2012 and 2019 by SIMD quintile. There is only one SCJS wave in this time period that includes first issue outcomes, so the SCJS is not included in this analysis. Overall, response is lowest in the most deprived quintile (SIMD Q1) and the second most deprived quintile (SIMD Q2), and highest in the middle quintile (Q3) and quintile 4. There is some variation between SHS and SHeS, with a flatter distribution in SHeS than in the SHS[21].
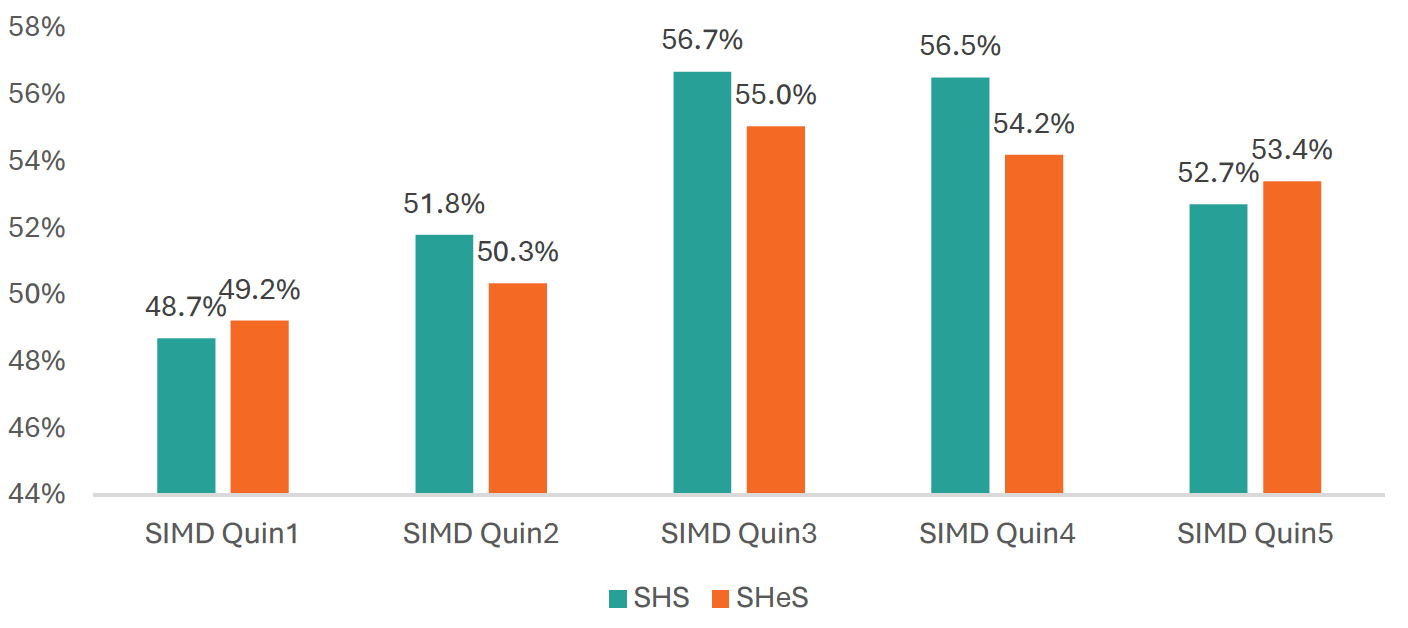
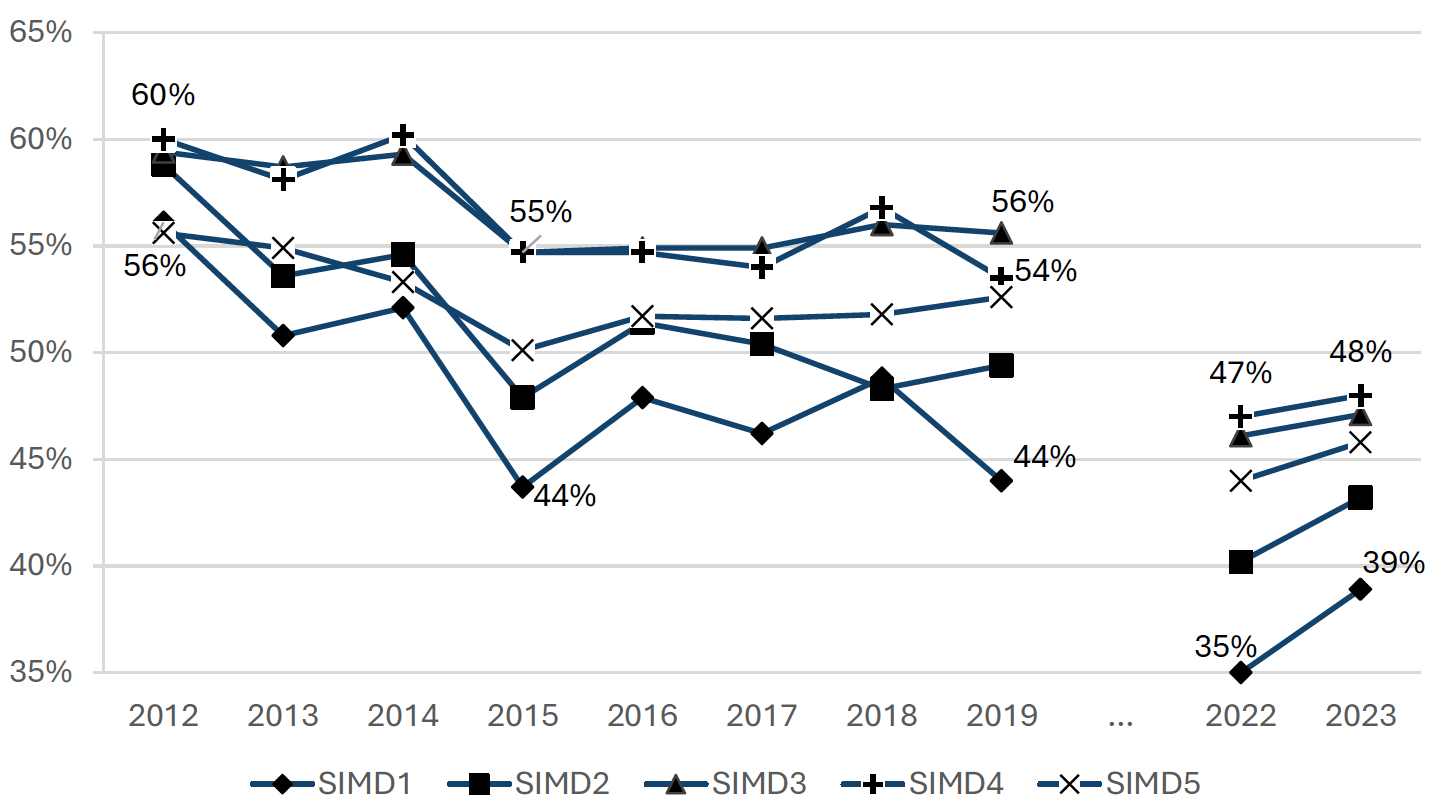
Figure B.9 shows the first issue response rate in the SHS over time[22]. From 2012 to 2019, the first issue response rate decreased the most in the two most deprived quintiles: -12.1pp in SIMD 1 and -9.4pp in SIMD 2 compared to -7.0pp overall. The means that the variation in first issue response rates by SIMD increased over this time period, with the range between highest and lowest rates increasing from 4.4pp in 2012, to 11.6pp in 2019.
Post-Covid, the decrease in the first issue response rate in the SHS was relatively uniform across SIMD quintiles, with all quintiles falling a similar amount[23]. Between 2022 and 2023, the gap between the best and worst rates narrowed from 12.1pp to 9.2pp, as the first issue response rate in the most deprived quintile recovered more than in the other quintiles.
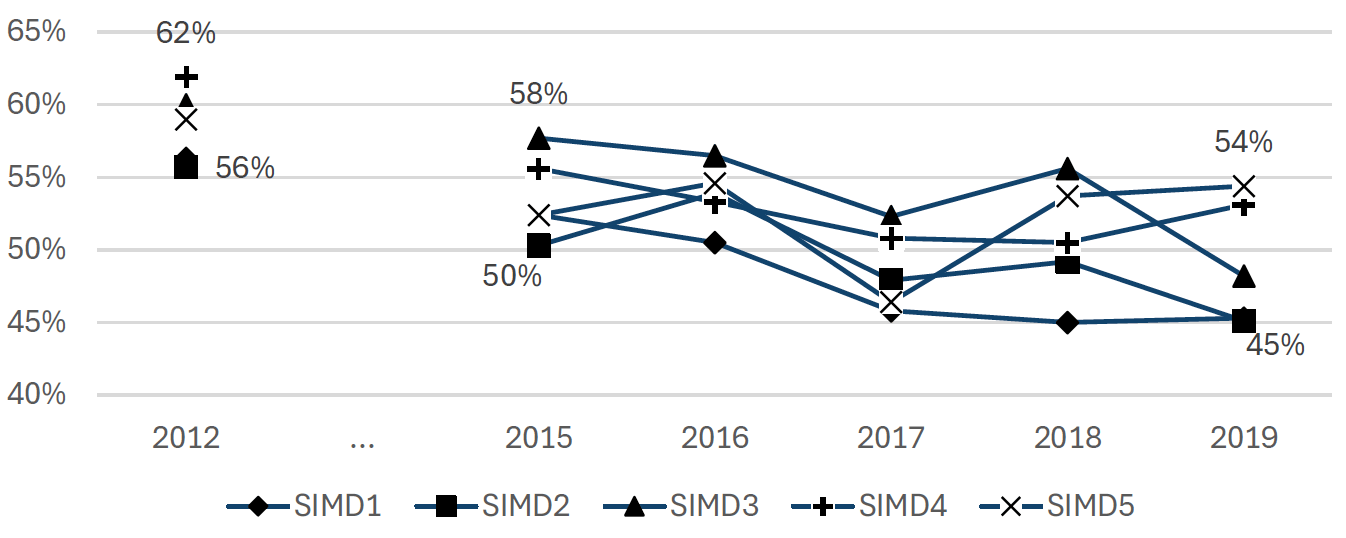
The equivalent analysis for SHeS 2012 to 2019 is shown below, Figure B.10. (Note data for 2022 onwards was not available). The pattern is similar to SHS, with response rates decreasing more over this period in the most deprived areas, increasing the gap between the highest and lowest first issue response rates from 6.2% in 2012 to 9.3% in 2019.
Response over time by rurality
The change in pattern of first issue nonresponse by rurality over time is less clearcut. Figure B.11 shows that, on the SHS, overall response is lowest in the large urban and other urban areas and highest in remote small towns and remote rural areas. Between 2012 and 2019, response rates were maintained in remote rural areas more than large urban and other urban areas. This meant the ‘gap’ in response by rurality rose from 19.2pp in 2012 to 24.6pp in 2019. However, in 2023, the response rate improved more in urban than in rural areas, reducing the gap between highest and lowest to 18.9pp, very similar to 2012.
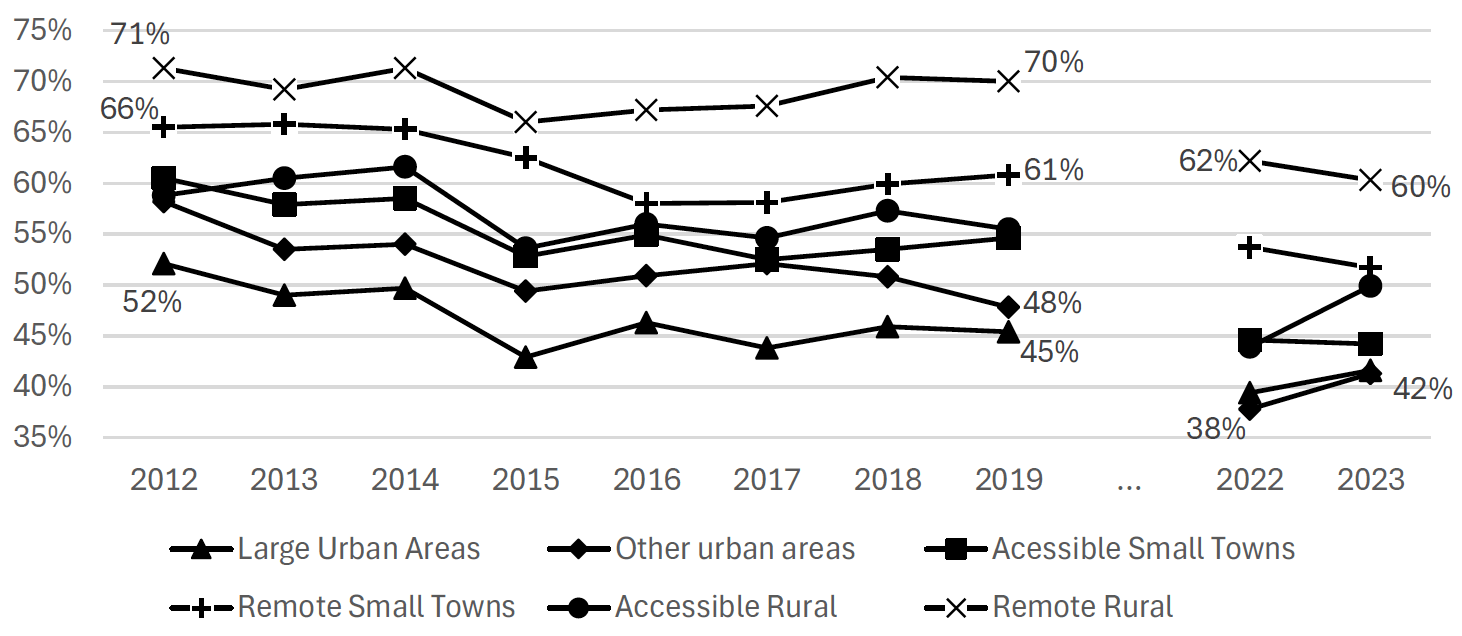
Similarly, there is no clear change in patterns of first issue nonresponse over time in the SHeS or SCJS.
Response over time by individual and household characteristics
The rest of this section uses a different approach to look at changes over time comparing unweighted estimates from the Scottish Survey Core Question (SSCQ) data (which combines demographic data from all three surveys into one dataset) to census-based estimates. For the census-based estimates, we use the 2011 and 2022 Scottish censuses, calculating estimates for intermediate years assuming that change over time is linear. It should be noted that the target population for the census is slightly different from the major surveys, in that it also includes people not living in private homes (e.g. those in student accommodation, sheltered housing etc.). However, assuming that there is no major change in the difference in coverage over time, this should not impact trends.
The design of the three surveys tends to be disproportionate with sub-area targets increased in smaller areas. Ideally, we would examine the SSCQ data without calibration weighting but with design weights. Using the unweighted data means that we would expect the achieved sample to be slightly more rural and slightly less deprived than a completely proportionate design would be. Unfortunately, as there is no separate design weight, this is not possible. However, given that the sampling design for the studies have been broadly consistent since 2012, this should not impact analysis of trends.
The SSCQ survey data cannot be linked to the outcome data, meaning it is not possible to restrict analysis to first issue response rates.[24] However, it does enable analysis of the profile of all respondents across the surveys. We looked at four factors in turn: age, ethnicity, highest educational qualification, and tenure.
Age
Figure B.12 shows the unweighted age distribution in the 2022 SSCQ data compared to census data. Overall, the youngest adults are heavily underrepresented and older adults quite heavily overrepresented.
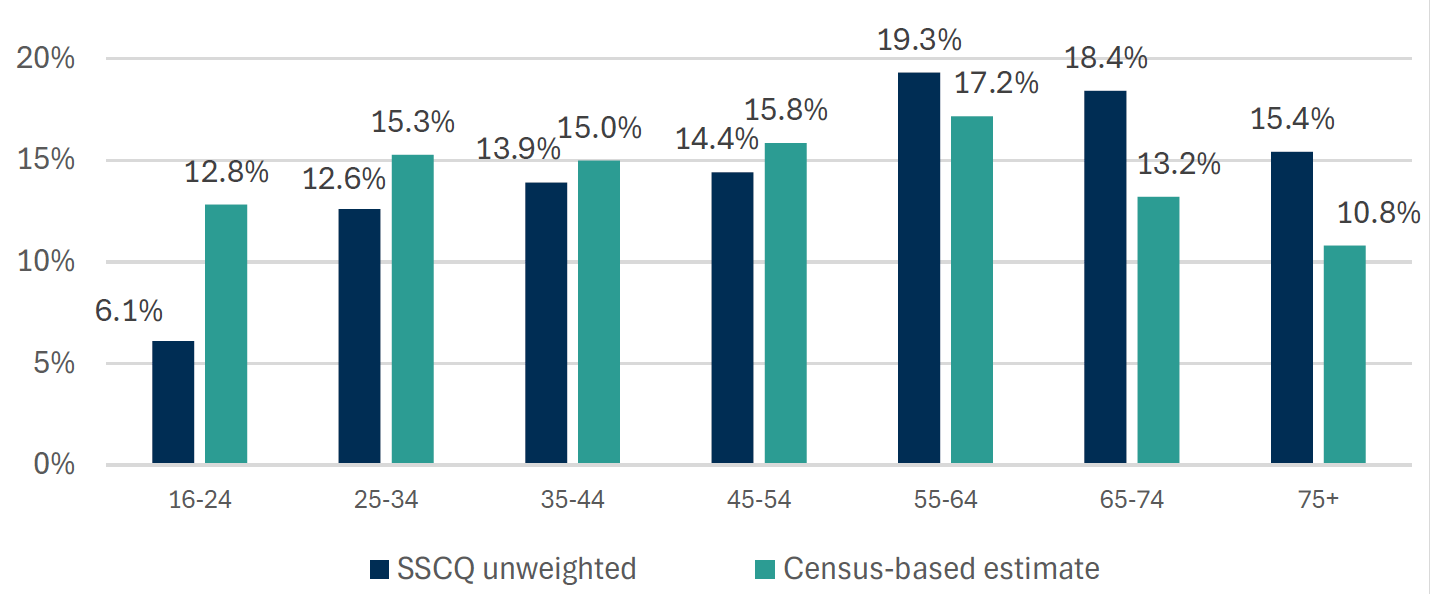
Figure B.13 shows trends over time in the ratio of SSCQ estimates to census-based estimates. A value of 1 means that the proportion in the data is the same as in the census. Over 1 and the group is over-represented, under 1 and the group is under-represented. Greater deviation from a ratio of 1 implies poorer representativity of the achieved sample, more need for corrective weighting, and a higher potential for bias.
This shows that, between 2012 and 2022, younger age groups have become significantly more underrepresented, with those in the older age groups 65-74 and 75+ becoming more overrepresented. There is no clear difference between the pre-pandemic period and the post-pandemic period with a broadly similar trend throughout.[25]
While these changes are significant, they equate to relatively small absolute changes. For example, the difference between census estimate and survey estimate for 16-24 years was 6.7pp in 2022 compared to 6.4pp in 2012. Indeed, the vertical separation between the lines in Figure 3.12 is more striking than any trend within the lines: young people have always been considerably underrepresented.
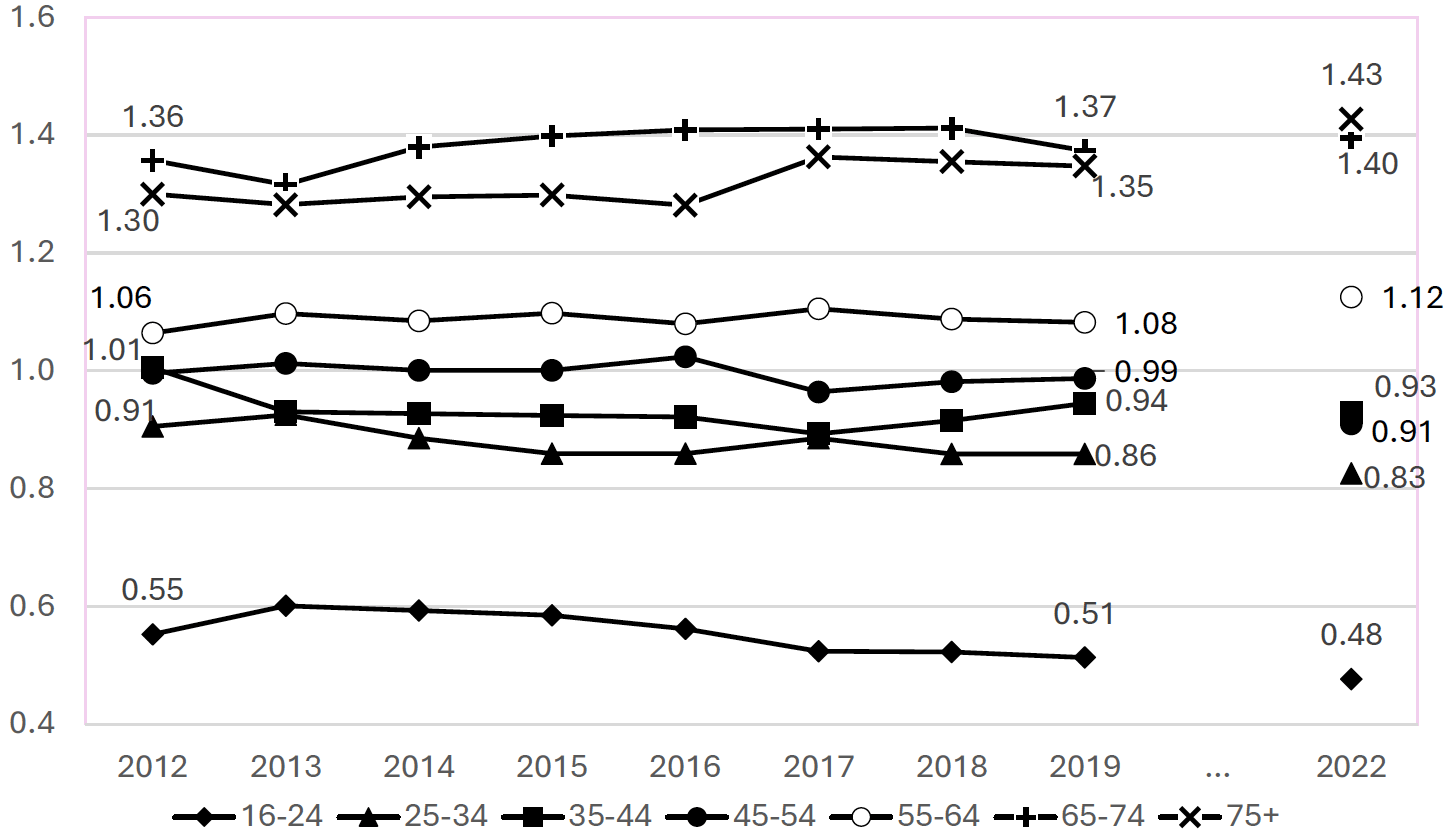
While there is some variation between the three surveys for the pattern of individual age groups, they all show a broadly similar pattern of large differences between age groups in relation to representation, with young age groups becoming slightly more underrepresented and older groups becoming more overrepresented over time.
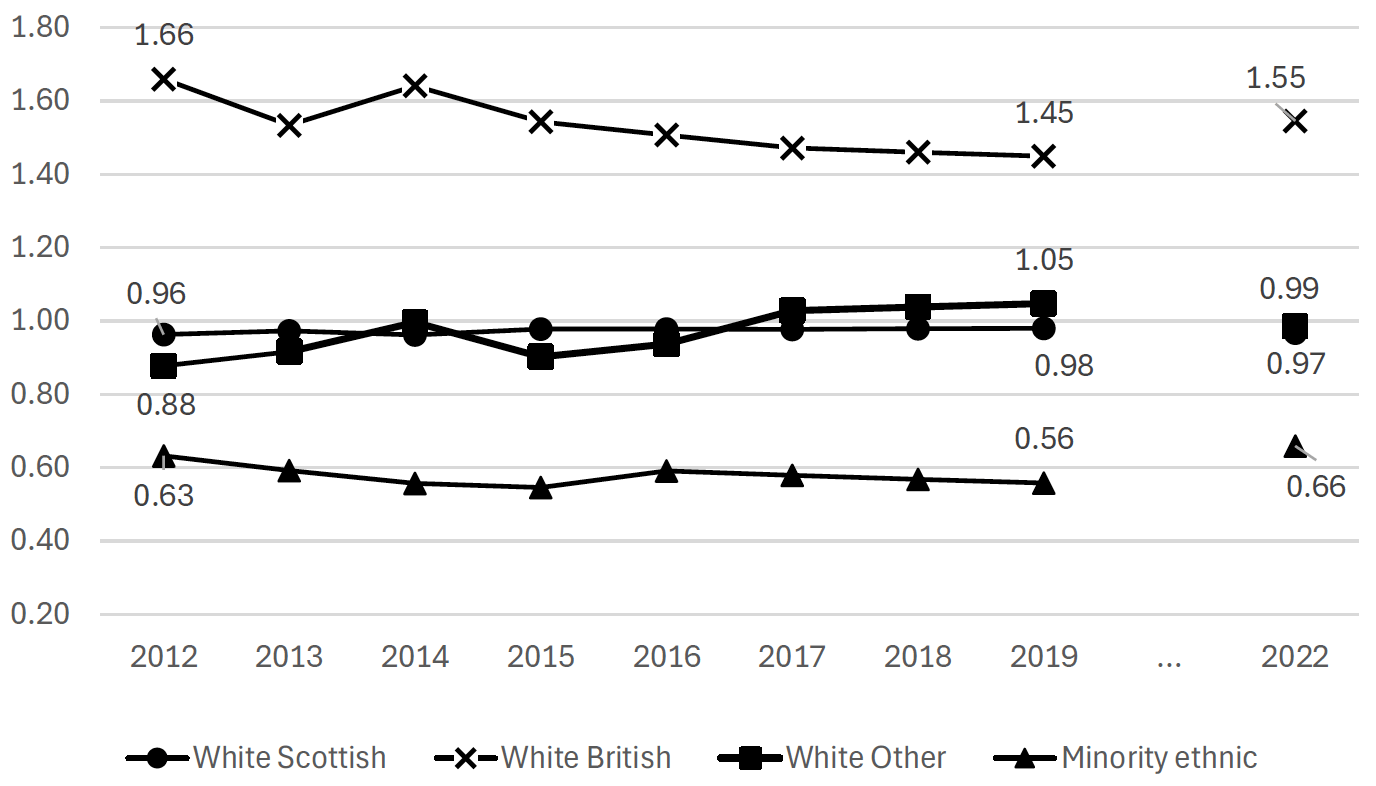
Ethnicity
Figure B.14 shows the unweighted age distribution in the 2022 SSCQ data compared to census data. Overall, the minority ethnic adults are underrepresented. Additionally, White Scottish are underrepresented and White British are overrepresented.
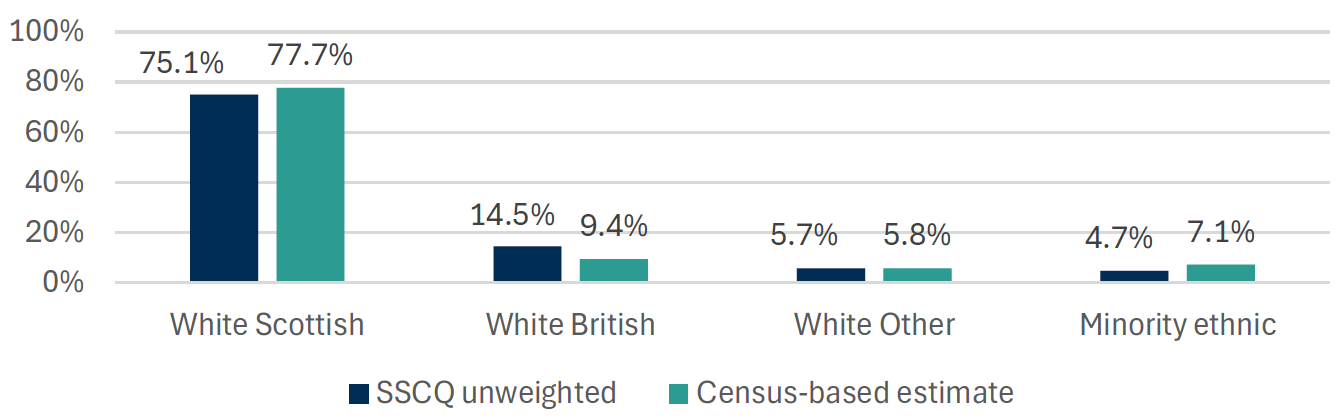
Figure B.15 shows trends over time in the ratio of SSCQ estimates to census-based estimates, in relation to ethnicity. Generally, the pattern is relatively stable:
- While those identifying as “White: Other British” have been overrepresented throughout, the degree of overrepresentation reduced between 2012 and 2019, but increased between 2019 and 2022.
- In contrast, those from minority ethnic groups (excluding white minority backgrounds) became more underrepresented between 2012 and 2019 but representation improved between 2019 and 2022.
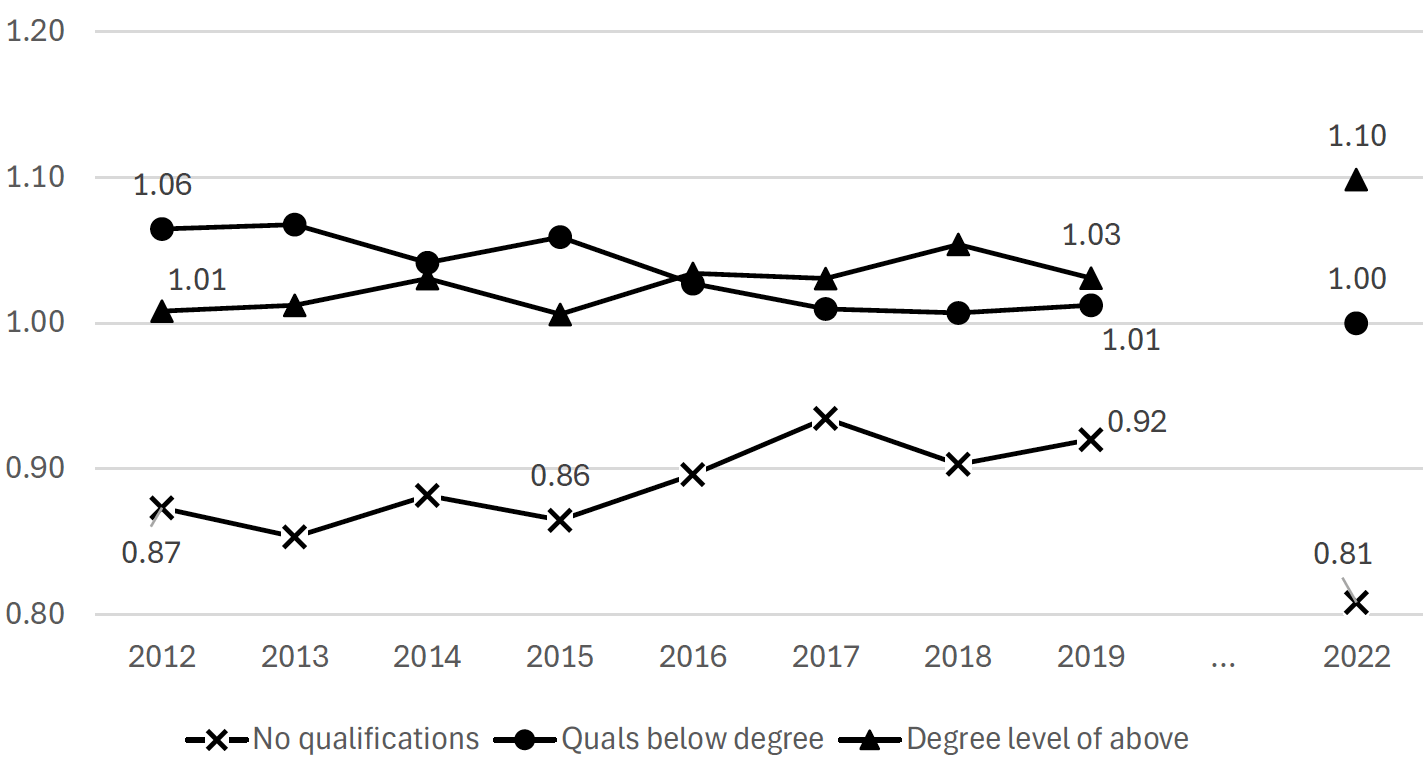
Educational attainment
Figure B.16: Unweighted SSCQ estimates of attainment compared to census. 2022 (N = 19,319)
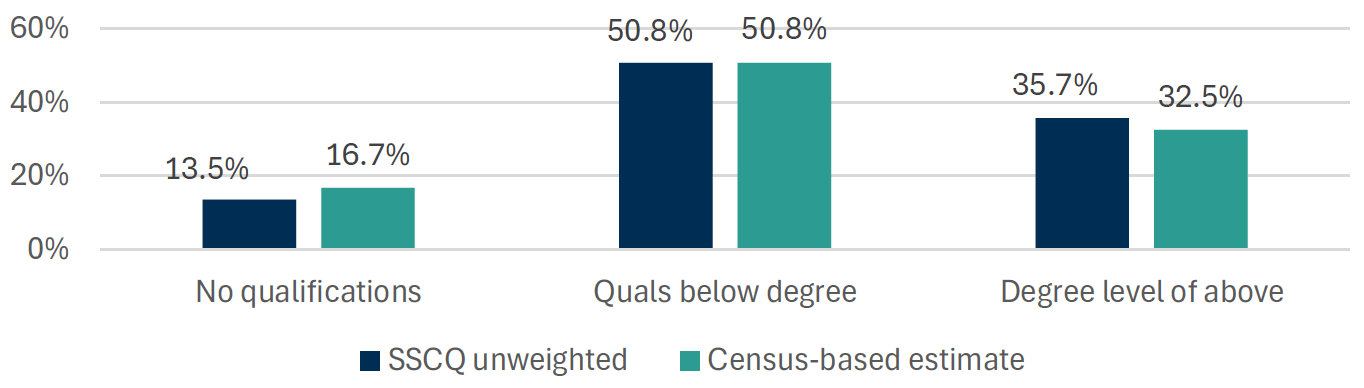
Between 2012 and 2019, those with no qualifications became gradually better represented in the survey data. However, between 2019 and 2023 this pattern reversed and this group became less proportionally represented in the unweighted data. At the same time, there was a sizeable increase in overrepresentation of graduates from 2019 to 2023, across all three surveys.
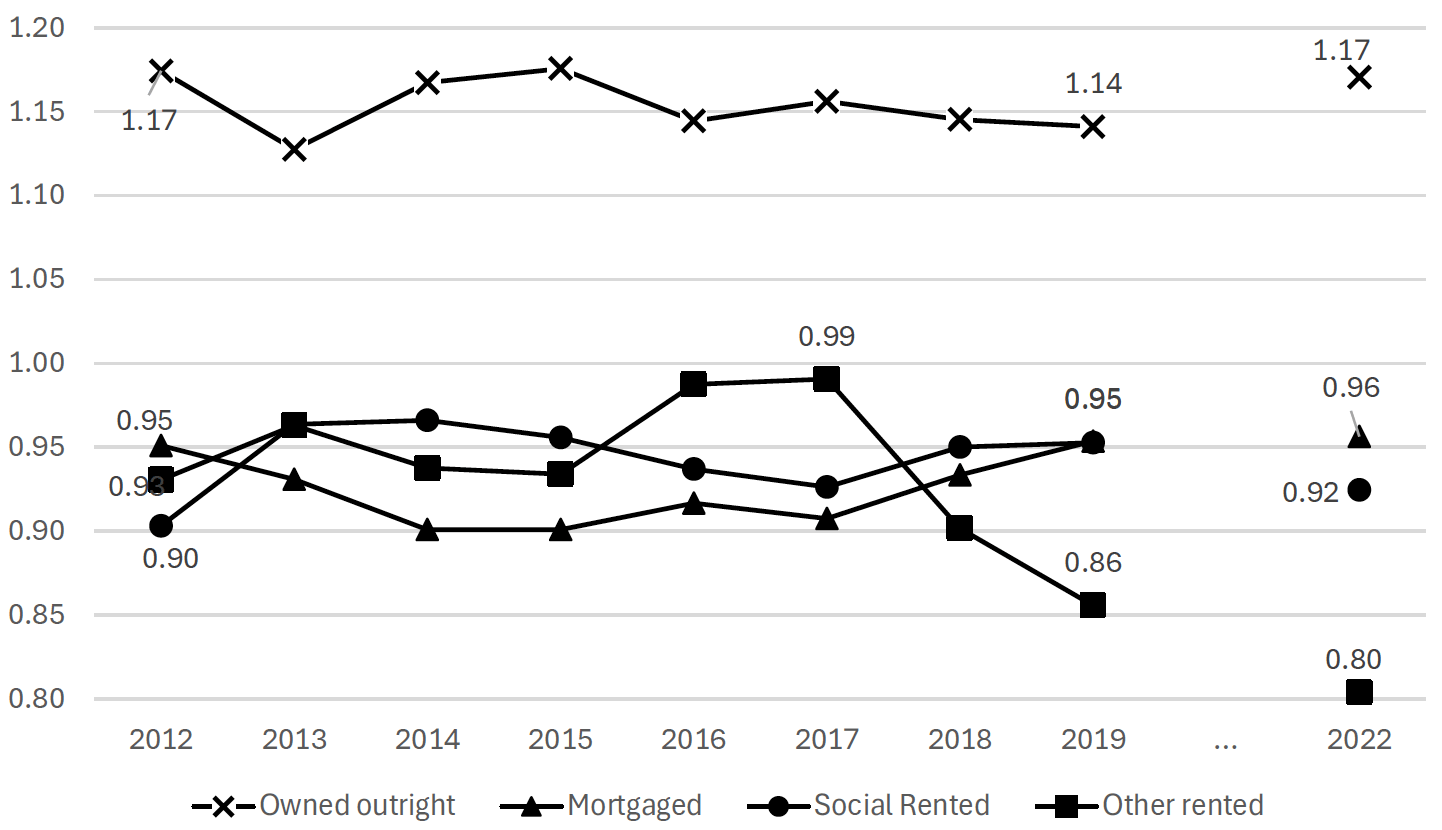
Tenure
Figure B.18 compares the tenure distribution in the unweighted SSCQ data in 2022 to the census.
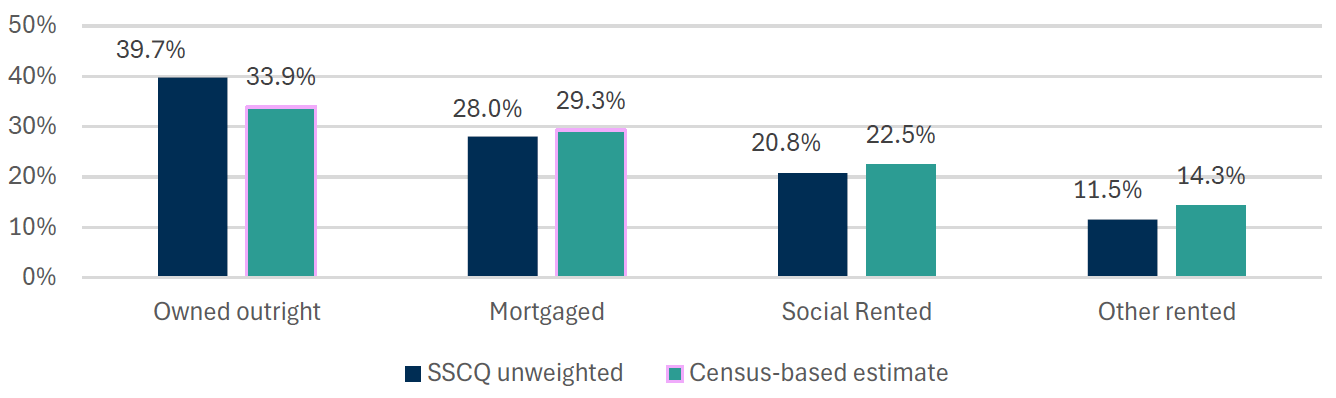
The representation ratios for outright owners, those with a mortgage, and social renters are relatively stable over time. In contrast, “other renters”, a group that includes private renters, became better represented between 2012 and 2017, but this pattern reversed in the period 2017 to 2022, when they became more underrepresented.
Supplementary table
| First issue outcome | Reissued |
|---|---|
| Non-contact | 96% |
| Refused | 85% |
| Other nonresponse | 48% |
| Unknown eligibility | 86% |
| Invalid | 53% |
| Total | 43% |
Contact
Email: surveystrategy@gov.scot