Sport and Physical Activity: State of the Nation
This report summarises physical activity levels in Scotland using data from the Scottish Health Survey (SHeS) and the Scottish Household Survey (SHS).
Adults
The Chief Medical Officers’ (CMO) guidelines for physical activity apply to adults aged 19 to 64 years. However, both the Scottish Health Survey (SHeS) and Scottish Household Survey (SHS) define adults as those aged 16+. The data presented in this chapter therefore includes individuals aged 16 to 64 for indicators from SHeS relating to adherence to MVPA and muscle-strengthening guidelines, low activity and sedentary time.
Individuals aged 16 to 59 are classed as adults for indicators relating to sport participation and recreational walking from the SHS.
Inequality analysis is presented for all adults aged 16+, including older adults.
Summary
- Adults’ reported adherence to MVPA guidelines, muscle-strengthening recommendations and levels of very low activity have all remained relatively stable between 2014 and 2024. However, the amount of time adults report spending sedentary has increased over the same period. Those aged 35-44 are the least sedentary and those aged 16-24 are the most.
- The proportion participating in sport has decreased compared to the last few years and is back to similar levels observed in 2014 and 2016. Participation in walking has also decreased compared to 2019 but, more generally, has seen a steady increase overall since 2014.
- Over the past decade, younger adults (16–24) are more likely than older adults (55-64) to have reported meeting MVPA and muscle-strengthening guidelines and participation in sport. There was no difference in recreational walking. However, they also reported spending more time being sedentary. Sport participation among the youngest age group has dropped a little.
- Males generally reported higher activity than females. For the youngest age group (16-24) male adherence to MVPA guidelines has decreased whilst those of females of the same age has increased such that there was no inequality gap by sex in 2024 for this age group.
- Disabled adults (with life-limiting conditions) compared to non-disabled adults, and those from the most deprived areas compared to least, are less likely to have reported meeting activity guidelines, participation in sport or recreational walking and more likely to have reported being inactive, and to have reported spending more time sedentary than non-disabled adults.
- The gap in reported rates of recreational walking by area deprivation has widened over time due to rising rates in the least deprived areas and stable rates in the most deprived.
- Reported sport participation among disabled adults has increased over the past 10 years. The gap between disabled and non-disabled adults has narrowed, though this is partly due to a decline in reported sport participation among non-disabled adults.
- Reported rates of recreational walking have also increased among disabled adults over time. However, the inequality gap remains largely unchanged as reported rates of walking have also risen among non-disabled adults.
- Ethnic minority groups and White: Scottish adults reported being less likely to participate in sport and recreational walking compared to White: Other British and White: Other groups. However, these categories are limited as they encompass a broad range of ethnic groups and should therefore be interpreted with caution.
Activity intensity/frequency
The CMO guidelines for adults recommend that each week, adults should accumulate at least 150 minutes (2 1/2 hours) of moderate intensity activity (such as brisk walking or cycling); or 75 minutes of vigorous intensity activity (such as running); or even shorter durations of very vigorous intensity activity (such as sprinting or stair climbing); or an equivalent combination of moderate, vigorous and very vigorous intensity activity.
- In 2024, 62% of adults reported meeting this recommendation. Between 2014-2024 this trend has been relatively stable (ranging between 62% to 69%).
Low levels of activity are defined as less than 30 minutes of moderate activity or less than 15 minutes of vigorous activity or an equivalent combination of these in the past week.
- In 2024, 24% of adults reported having very low levels of physical activity. This level has remained relatively stable (ranging between 20% to 24% since 2014[11]).
Sport and walking participation
The CMO Guideline for adults recommends that, for good physical and mental health, adults should aim to be physically active every day. Any activity is better than none, and more is better still. Measures of sport participation and recreational walking are used to indicate frequent engagement in a variety of activities. The latest data available for these indicators is from 2023.
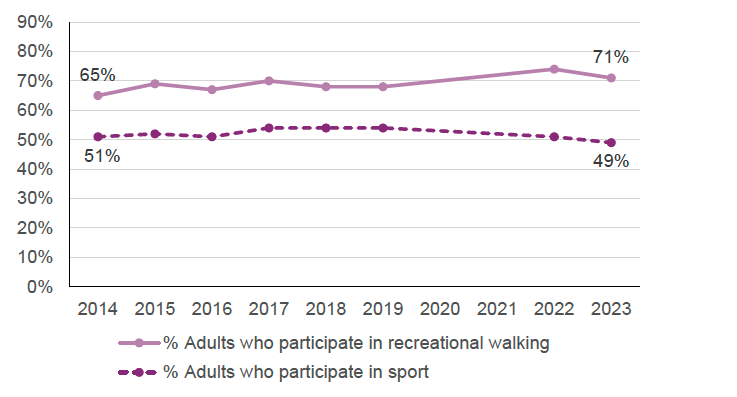
- In 2023, 49% of adults reported participating in sport. This is a decrease compared to the last few years and is back to similar levels observed in 2014 and 2016.
- In 2023, 71% of adults reported they were walking for recreational purposes. This is a decrease compared to 2019, however, more generally there has been a steady increase from 64% in 2014.
Figure 7 summarises the proportions of adults who participated in sport or walking at least 30 minutes for recreational purposes.
Muscle strength
The CMO Guideline for adults recommends that adults should do activities to develop or maintain strength in the major muscle groups. These could include heavy gardening, carrying heavy shopping, or resistance exercise[13]. Muscle-strengthening activities should be done at least two days a week, but any strengthening activity is better than none.
- In 2024, 30% of adults reported meeting the muscle-strengthening recommendation. This has remained relatively stable since 2014 (ranging between 28% and 30%[14]).
Sedentary time
The CMO Guideline for adults recommends that adults should aim to minimise the amount of time spent being sedentary, and when physically possible should break up long periods of inactivity with at least light physical activity.
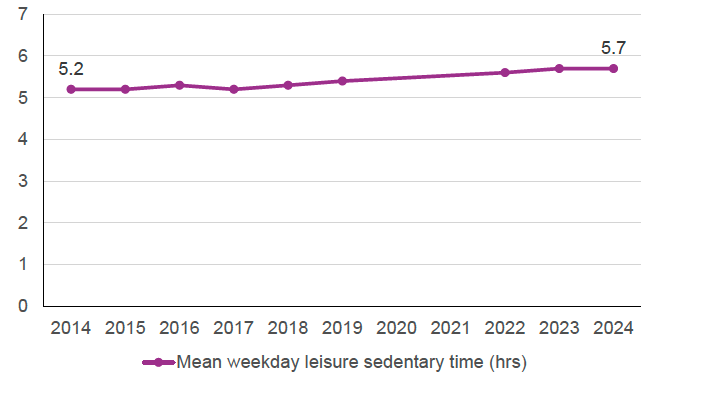
- In 2024, adults reported spending an average of 5.7 hours being sedentary during weekday leisure time. This has increased from 5.2 hours in 2014.
Figure 8 summarises the average amount of time adults reported spending being sedentary from 2014-2024.
Inequalities
Age and sex
- A higher proportion of males reported meeting MVPA guidelines than females (66% compared to 58% in 2024).
- This sex gap has increased over time amongst those aged 55-64 from a two percentage point difference in 2014 (60% males and 58% females) to an eight percentage point difference in 2024 (67% males and 59% females).
- Since 2014, reported meeting of MVPA guidelines among males in the youngest age categories (16-24) has decreased from 79% to 71% in 2024. In contrast, there has been an increase in reported adherence among females in the same age group from 64% in 2014 to 71% in 2024 such that there was no sex gap in this age group in 2024.
- Reported meeting of the MVPA guidelines for females aged 25-34 has decreased from 76% in 2014 to 66% in 2024.
- Those aged 16-34 years reported taking part in sports less than they have done previously, with 64% in 2023, the latest and lowest point in the time series compared to 70% at the highest point in 2017.
- Amongst the working age population (16-64), those aged 35-44 have consistently been the least sedentary and those age 16-24 have been the most. In 2024, the youngest adults reported spending on average 6 hours being sedentary during weekday leisure time compared to 4.5 hours for 35-44 year olds.
Table 4 summarises indicators for meeting MVPA guidelines, very low activity status, sedentary time and muscle-strengthening for adults by sex and age group from SHeS. The ‘Younger’ cohort refers to adults aged 16-24 and the ‘Older’ cohort refers to adults aged 55-64. Table 5 summarises the adult sport participation and recreational walking from SHS. The ‘Younger’ group in this table comprises those aged 16-34 and the ‘Older’ group those aged 35-59. Table 6 summarises adults average reported time spent sedentary by age group.
| Indicator | Younger | Older | Male | Female |
|---|---|---|---|---|
| Adults who meet MVPA recommendations (%) | 71 | 67 | 66 | 58 |
| Adults with very low activity levels (%) | 18 | 23 | 21 | 26 |
| Adults who meet muscle-strengthening recommendations (%) | 45 | 25 | 31 | 29 |
| Adult’s mean weekday leisure sedentary time (hrs) | 6.2 | 5.8 | 5.8 | 5.7 |
| Indicator | Younger | Older | Male | Female |
|---|---|---|---|---|
| Adults who participate in sport (%) | 64 | 53 | 54 | 45 |
| Adults who participate in recreational walking (%) | 77 | 76 | 72 | 71 |
| Age | 2014 | 2015 | 2016 | 2017 | 2018 | 2019 | 2020 | 2021 | 2022 | 2023 | 2024 |
|---|---|---|---|---|---|---|---|---|---|---|---|
| 16-24 | 5.3 | 5.6 | 5.9 | 5.4 | 6.1 | 5.7 | * | * | 6.3 | 6.2 | 6 |
| 25-34 | 4.4 | 4.4 | 4.4 | 4.4 | 4.5 | 4.8 | * | * | 5.1 | 5.1 | 5.3 |
| 35-44 | 4.1 | 4 | 4.2 | 4.2 | 3.9 | 4.4 | * | * | 4.5 | 4.7 | 4.5 |
| 45-54 | 4.7 | 4.5 | 4.6 | 4.5 | 4.8 | 4.7 | * | * | 4.9 | 4.8 | 4.9 |
| 55-64 | 5.4 | 5.5 | 5.3 | 5.4 | 5.3 | 5.5 | * | * | 5.5 | 5.8 | 5.6 |
| All | 5.2 | 5.2 | 5.3 | 5.2 | 5.3 | 5.4 | * | * | 5.6 | 5.7 | 5.7 |
Deprivation
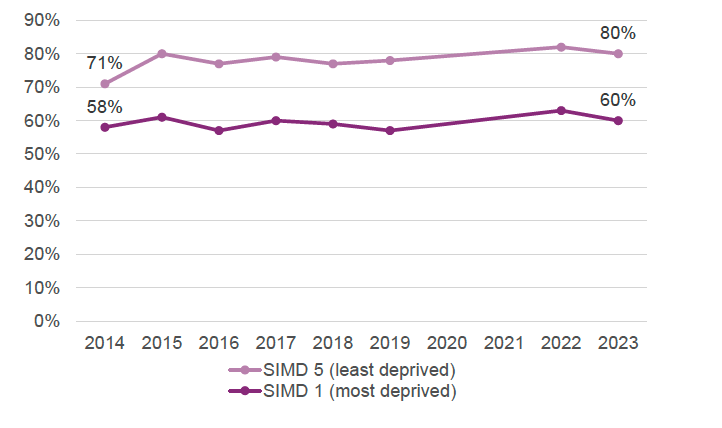
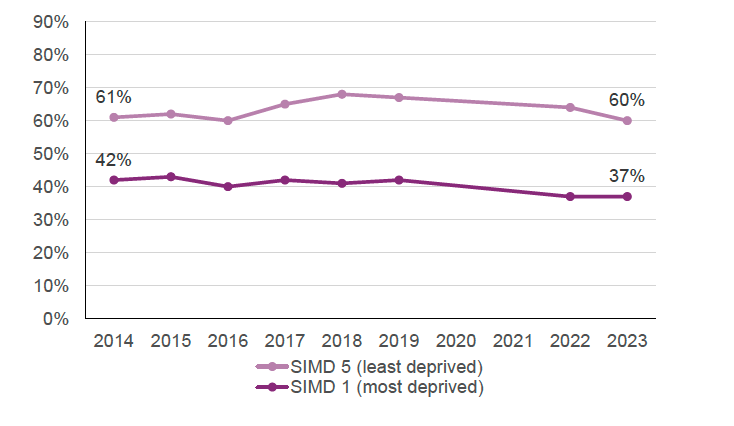
Data on deprivation is for all adults aged 16+. Deprivation is measured using SIMD. Table 7 summarises the differences between adults living in the most deprived and least deprived areas for physical activity levels, muscle-strengthening and sedentary time in 2024. Table 8 summarises sport participation and recreational walking for adults living in the most deprived and least deprived areas in 2023. Figures 9 and 10 show the trend in proportions of adults who regularly participated in recreational walking and sport respectively by highest and lowest SIMD level from 2014 to 2023.
- Adults living in the most deprived areas (SIMD 1) compared to those living in the least deprived areas (SIMD 5) reported lower rates of meeting MVPA (50% compared to 73%), meeting muscle-strengthening recommendations (18% compared to 42%), reported participation in sports (37% compared to 60%) and participation in recreational walking (59% compared to 80%).
- Adults living in the most deprived areas (SIMD 1) compared to those living in the least deprived areas (SIMD 5) have higher rates of very low activity (33% compared to 14%) and have higher mean hours spent sedentary in weekday leisure time (6.5 compared to 5.3).
- The gap in reported rates of recreational walking between the most and least deprived has increased since 2014 due to the reported rates increasing (from 71% in 2014 to 80% in 2024) for the least deprived (SIMD 5) and remaining stable (in the range 57%-63% over the time series) for the most deprived (SIMD 1).
| Indicator | SIMD 1 (most) | SIMD 5 (least) |
|---|---|---|
| Adults who meet MVPA recommendations (%) | 50 | 73 |
| Adults with very low activity levels (%) | 33 | 14 |
| Adults who meet muscle-strengthening recommendations (%) | 18 | 42 |
| Adult’s mean weekday leisure sedentary time (hrs) | 6.5 | 5.3 |
| Indicator | SIMD 1 (most) | SIMD 5 (least) |
|---|---|---|
| Adults who participate in sport (%) | 37 | 60 |
| Adults who participate in recreational walking (%) | 60 | 80 |
Disability
Data on disability is for all adults aged 16+. Disability is defined as the presence of a long-term life-limiting illness (LLI).
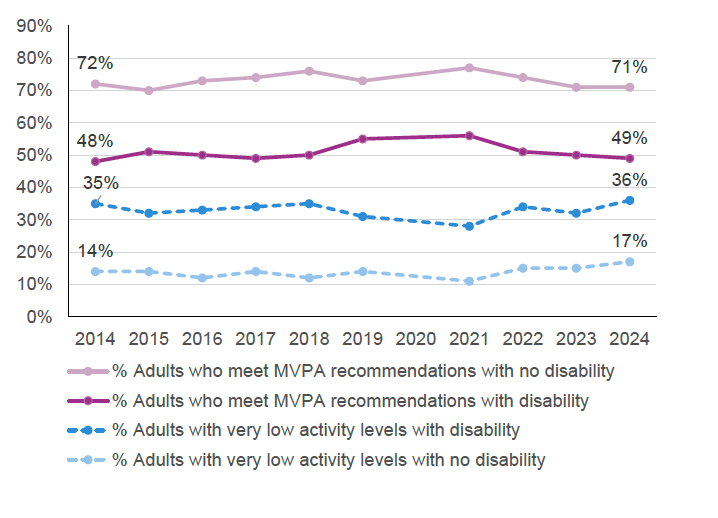
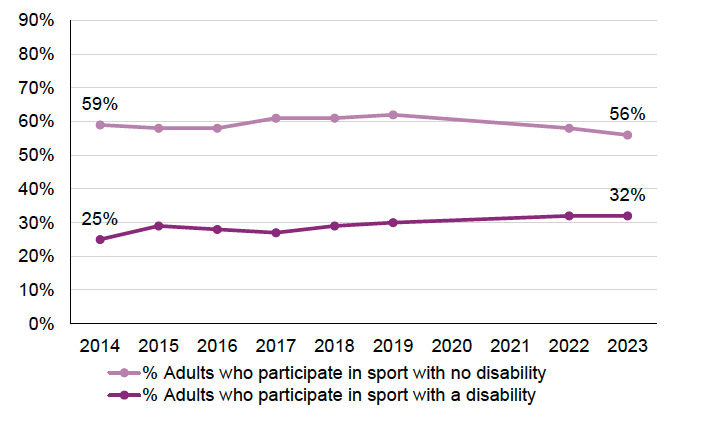
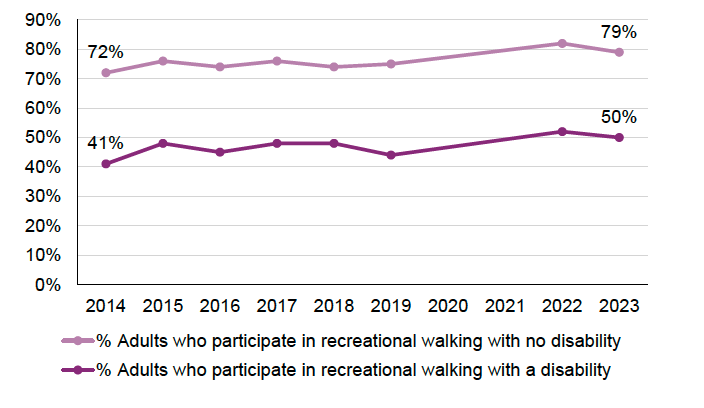
Table 9 shows the difference in physical activity indicators from SHeS where an adult has a disability or not. Table 10 summarises sport and recreational walking participation by disability. Figures 11, 12 and 13 present the trends for the different indicators.
- Disabled adults compared to non-disabled adults are less likely to have reported meeting MVPA guidelines in 2024 (49% compared to 71%), meeting muscle-strengthening recommendations (21% compared to 35%), participation in sport (32% compared to 56%) and walking recreationally (50% compared to 79%), and are more likely to have reported very low activity levels (36% compared to 17%) and longer average sedentary time (6.5 hours compared to 5.2).
- Reported sport participation among disabled adults has increased over the past 10 years, rising from 25% in 2014 to 32% in 2023. The gap between disabled and non-disabled adults has narrowed from 34 percentage points in 2017 to 24 percentage points in 2023. However, this is in part due to a decline in reported sport participation among non-disabled adults.
- Reported rates of recreational walking have also increased among disabled adults over time, from 41% in 2014 to 50% in 2023. However, the inequality gap remains largely unchanged at 29 percentage points in 2023 compared to 31 percentage points in 2014 as reported rates of walking have also risen among non-disabled adults.
| Indicator | Disability | No disability |
|---|---|---|
| Adults who meet MVPA recommendations (%) | 49 | 71 |
| Adults with very low activity levels (%) | 36 | 17 |
| Adults who meet muscle-strengthening recommendations (%) | 21 | 35 |
| Adults mean weekday leisure sedentary time (hrs) | 6.5 | 5.2 |
| Indicator | Disability | No disability |
|---|---|---|
| Adults who participate in sport (%) | 32 | 56 |
| Adults who participate in recreational walking (%) | 50 | 79 |
Contact
Email: socialresearch@gov.scot