Social Care Services, Scotland, 2015
Latest national figures for Social Care services provided or purchased by Local Authorities in Scotland.
4. Working Age Adults - Clients aged 18 to 64
This section of the report provides more detail on the 49,250 Social Care clients aged 18 to 64 in the survey.
4.1 Home Care for adults aged 18 to 64
There were 10,940 Home Care clients aged 18-64 in 2015. Figure 21 shows that the rate of Home Care clients aged 18 to 64 per 1,000 population increased from March 2013 to March 2015, following a decrease between 2009 and 2013.
Figure 21: Home Care clients per 1,000 population aged 18-64, 2006 to 2015

Source: Scottish Government Social Care Survey 2013-2015, Home Care Census 2006-2012
Population data: National Records for Scotland mid-year population estimates up to 2014 (latest available)
The number of people aged 18 to 64 receiving Home Care has increased slightly in each of the last two years, following decreases in the preceding three years (Figure 22). The number of Home Care hours provided to 18-64 year olds has increased in each of the last two years.
Figure 22: Home Care clients aged 18-64 and hours provided, 2010 to 2015

Source: Scottish Government Social Care Survey 2013-2015, Home Care Census 2010-2012
Around half (47%) of Home Care clients aged 18 to 64 received less than 10 hours of care per week (Figure 23), compared to 65% for older people (see Figure 16, Section 3). 13% of clients aged 18 to 64 received more than 50 hours of care per week compared with only 1% of clients aged 65+.
Figure 23: Distribution of Home Care hours, clients aged 18 to 64, 2015

Based on 10,940 home care clients aged 18-64.
Source: Scottish Government Social Care Survey 2015
Younger adults (aged 18-64) are less likely to use Local Authority run services: only 25% of clients aged 18 to 64 received their care solely from Local Authorities (Table 4), compared with 53% for clients aged 65+ (Table 2). Only 12% of Home Care hours for clients aged 18 to 64 were provided solely by Local Authorities in 2015, compared with 44% for those aged 65 and over.
There is also a greater discrepancy between the mean and median numbers of hours for clients aged 18 to 64 than was seen for clients aged 65+ (Table 2). This is due to the distribution of home care hours seen in Figure 23 and in particular the 13% of clients who receive 50 or more hours of care each week.
Table 4: Home Care by Service Provider for clients aged 18 to 64, 2015
| Service Provider | Number of clients* | Client hours | Average (mean) hours per week | Average (median) hours per week | ||
|---|---|---|---|---|---|---|
| Local Authority only | 2,720 | 25% | 29,800 | 12% | 11 | 6 |
| Private sector only | 4,330 | 40% | 87,000 | 36% | 20 | 10 |
| Voluntary sector only | 3,070 | 28% | 106,600 | 44% | 35 | 18 |
| LA plus private | 460 | 4% | 11,100 | 5% | 24 | 16 |
| LA plus voluntary | 110 | 1% | 2,900 | 1% | 25 | 17 |
| All other combinations | 150 | 1% | 5,400 | 2% | 35 | 27 |
| Total | 10,940 | 100% | 242,700 | 100% | 22 | 11 |
Source: Scottish Government Social Care Survey 2015
Figure 24 shows people aged 18-64 who receive a home care service by the principal reason they are receiving care (their 'client group'). The main reasons that people in this age group require home care is because they have a physical disability (35% of clients) or a learning disability (32% of clients). An additional 4% of clients aged 18-64 have both a Learning and Physical disability.
Figure 24: Home Care Clients aged 18 to 64, by client group, 2015

10,940 home care clients aged 18-64
Source: Scottish Government Social Care Survey 2015
Figure 25 shows that of the Home Care clients aged 18 to 64 for whom living arrangements are known, 47% live alone. This is lower than the 62% of clients aged 65+ who live alone (Figure 18).
Figure 25: Living arrangement of clients* aged 18 to 64 receiving Home Care services, 2015

*Based on 7,220 clients for whom Living Arrangements were known. Living arrangements information was unavailable for 3,720 clients.
Source: Scottish Government Social Care Survey 2015
4.2 Community Alarm / Telecare Services for clients aged 18 to 64
There were 16,040 people aged 18-64 in receipt of a Community Alarm and/or Telecare service in the year 2014-15. As explained in Section 3 of this report, in 2015 Local Authorities were asked to provide data on all clients receiving Community Alarms/Telecare at any point during the financial year; previously they only recorded those receiving the service during the March census week. (Figure 26).
Figure 26: Clients aged 18 to 64 receiving Community Alarm and/or another Telecare service, 2011 to 2014-15*
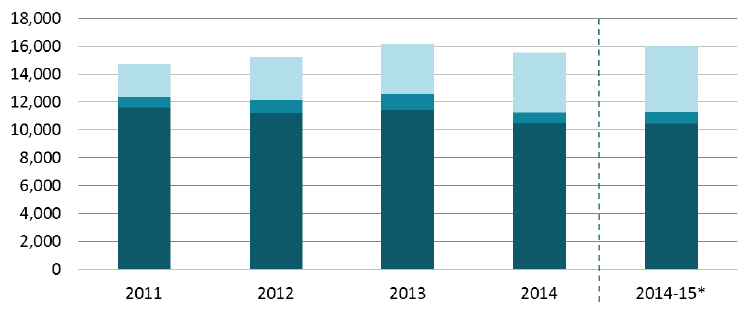
* From 2015 Local Authorities were asked to record all clients receiving Community Alarms/Telecare at any time during the financial year. Previously only clients receiving these services during the March census week were recorded.
Source: Scottish Government Social Care Survey 2013-2015, Home Care Census 2010-2012
4.4 Direct Payments for clients aged 18 to 64
In 2014-15, an estimated 3,320 people aged 18 to 64 received Direct Payments to purchase the care services they need. The total amount spent by Local Authorities on Direct Payments for this age group in 2014-15 was £59 million. As with the 65+ age group, this saw the continuation of the trend of increasing numbers of people receiving Direct Payments, which has been the case each year since 2009-10 (Figure 27).
Figure 27: People aged 18 to 64 who received Direct Payments, 2009-10 to 2014-15*

*Direct Payments totals include an estimate for East Renfrewshire council - see 5.5 (background notes).
Source: Scottish Government Social Care Survey 2013-2015, Self-Directed Support/Direct Payments Survey 2010-2012
Table 5 shows the breakdown of clients aged 18 to 64 receiving Direct Payments to purchase the care services they need. Physical Disabilities and Learning Disabilities are the primary reason for clients in this age group receiving Direct Payments.
Table 5: Direct Payments for clients aged 18 to 64, by client group, 2014-15
| Client Group | Number of clients** | Expenditure (£ millions) |
Mean1 value of direct payments |
Median2 value of direct payments |
|---|---|---|---|---|
| Physical disability | 1,150 | £20.4 | £18,000 | £11,000 |
| Learning disability**** | 1,090 | £20.2 | £19,000 | £11,000 |
| Mental Health | 230 | £2.2 | £9,000 | £5,000 |
| Frail older people | 40 | £0.6 | £16,000 | £9,000 |
| Dementia*** | 20 | £0.2 | £11,000 | £8,000 |
| Other | 190 | £2.2 | £12,000 | £7,000 |
| Not known | 450 | £7.9 | £18,000 | £13,000 |
| All* | 3,320 | £59.1 | £17,000 | £10,000 |
* The figures presented for "All" clients aged 65+ receiving Direct Payments have been adjusted to account for missing data from East Renfrewshire, so are slightly higher than the sum of individual client groups
** Some clients receive more than one direct payment
*** Dementia is known to be under recorded by Local Authorities in their social care information systems.
**** "Learning Disability" includes clients with both a Learning Disability and Physical Disability.
1 The Mean denotes the "average" value of direct payments, i.e. the sum of all payments divided by the number of payments (rounded to nearest £1,000)
2 The Median denotes the "middle" value of direct payments, i.e. the value at which half of the payments are less and half are more (rounded to nearest £1,000)
Source: Scottish Government Social Care Survey 2015
Contact
Email: Steven Gillespie