Social Care Eligibility Criteria And Waiting Times, Scotland, 2020-21
This publication presents the latest information on new clients meeting eligibility criteria for social care support, and the waiting times between first contact, completion of a community care assessment and delivery of a new personal care service.
2. New clients
2.1 New clients receiving a community care assessment
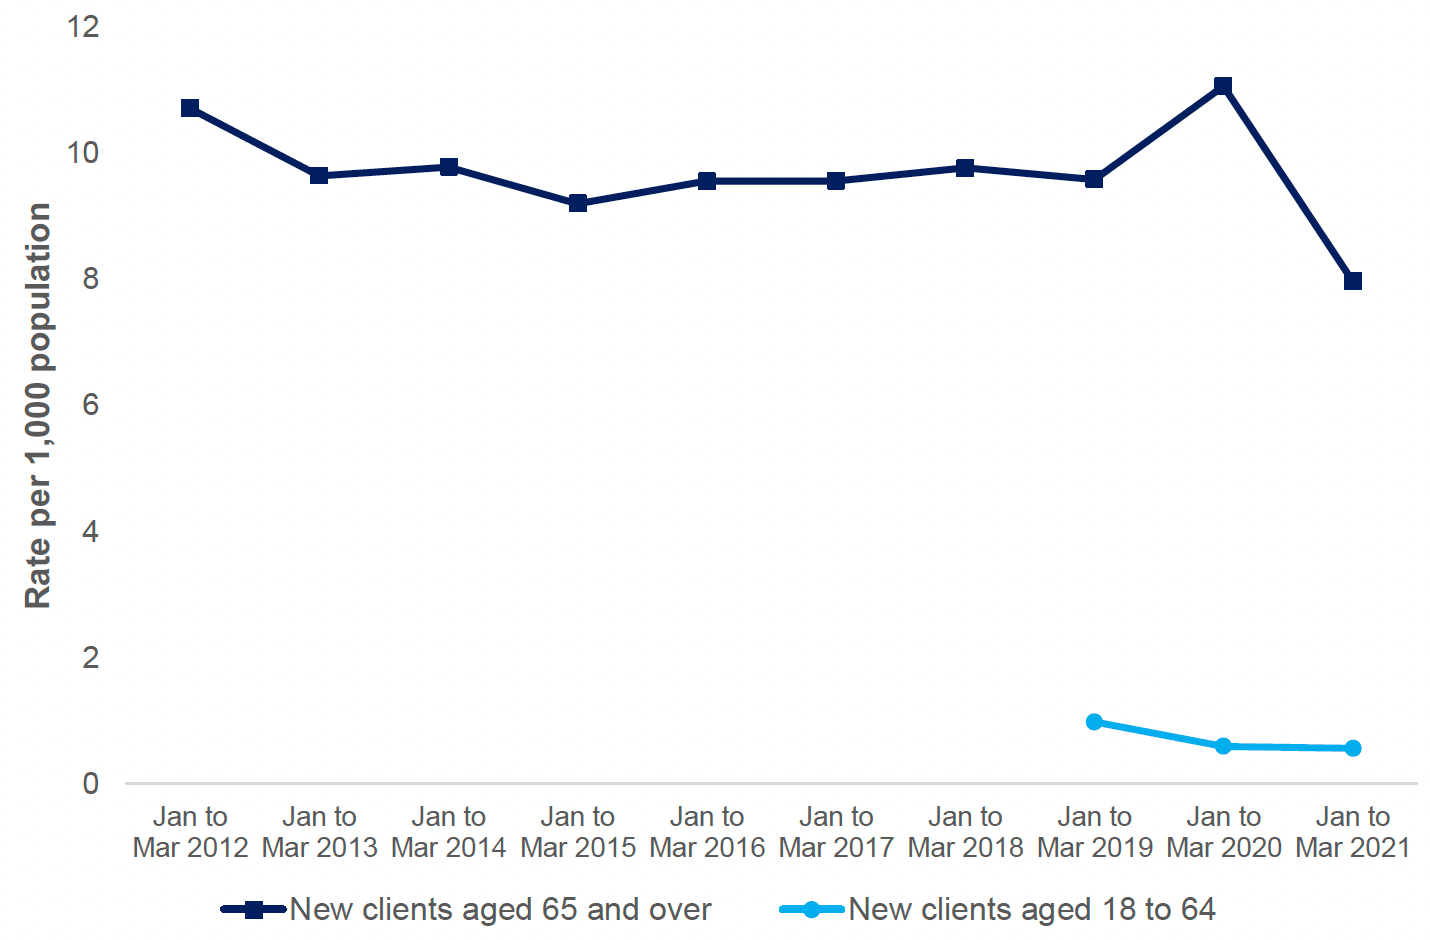
Sixteen local authorities provided eligibility criteria data on new clients aged 65 and over, recorded as being new to social work services and who received a community care assessment in the quarter, every year from 2012 to 2021.
As shown in Figure 1, the rate for new clients aged 65 and over remained stable, between 9 and 10 per 1,000 population from 2013 to 2019. In 2020, there was a rise to 11.1 new older clients per 1,000 population, and then a decline to 8.0 in 2021.
From 2019 onwards, the Scottish Government Quarterly Monitoring Return also collected data on younger adults (aged 18 to 64), reflecting the extension of free personal care to all adults.
Nineteen local authorities submitted eligibility criteria and assessment data every year (2019 to 2021) for younger adults (aged 18 to 64). The rate per 1,000 population for younger adults was considerably lower than for older people, at less than 1 per 1,000 population. The rate remained relatively stable over the three years.
See accompanying dataset for additional data by local authority.
Source: Scottish Government Quarterly Monitoring Return
Notes:
1. For clients aged 65 and over, 16 local authorities responded every year between 2012 and 2021, and for clients aged 18 to 64, 19 local authorities responded. Please see data completeness in the accompanying dataset for which local authorities are included.
2. Population rate is based on populations from LAs returning data (NRS mid-year population estimates up to 2020).
The data indicates a decline in community care assessments for new clients from 2020 to 2021. This follows increases in expenditure on adult social care (LFR 03), by Integration Joint Boards and Local Authorities, and no national tightening of the eligibility criteria for an assessment.
A range of factors may have affected these trends, including: an increasingly ageing population, resources becoming more focused on those in greatest need, geography, poverty, health inequalities and local government decision making.
Some reduction in numbers may also reflect substitution of formal services with asset based approaches (e.g. community alarms, telecare and modifications to a client's home) and increased use of self-directed support options.
2.2 New personal care clients
This data includes clients with a relevant personal care service start date in the reporting period. Personal care services include:
- personal care at home (including intermediate care e.g. rapid response, crisis care but, for the purposes of this measure, excludes telecare, equipment and adaptations and nursing services provided by the NHS),
- personal and nursing care in a care home,
- Direct Payments / Self Directed Support provided for personal care needs.
Unlike the new clients receiving a community care assessment above (Section 2.1: New clients receiving an assessment), these clients don't need to be new to Social Care services and may already have another service, such as telecare or meals service.
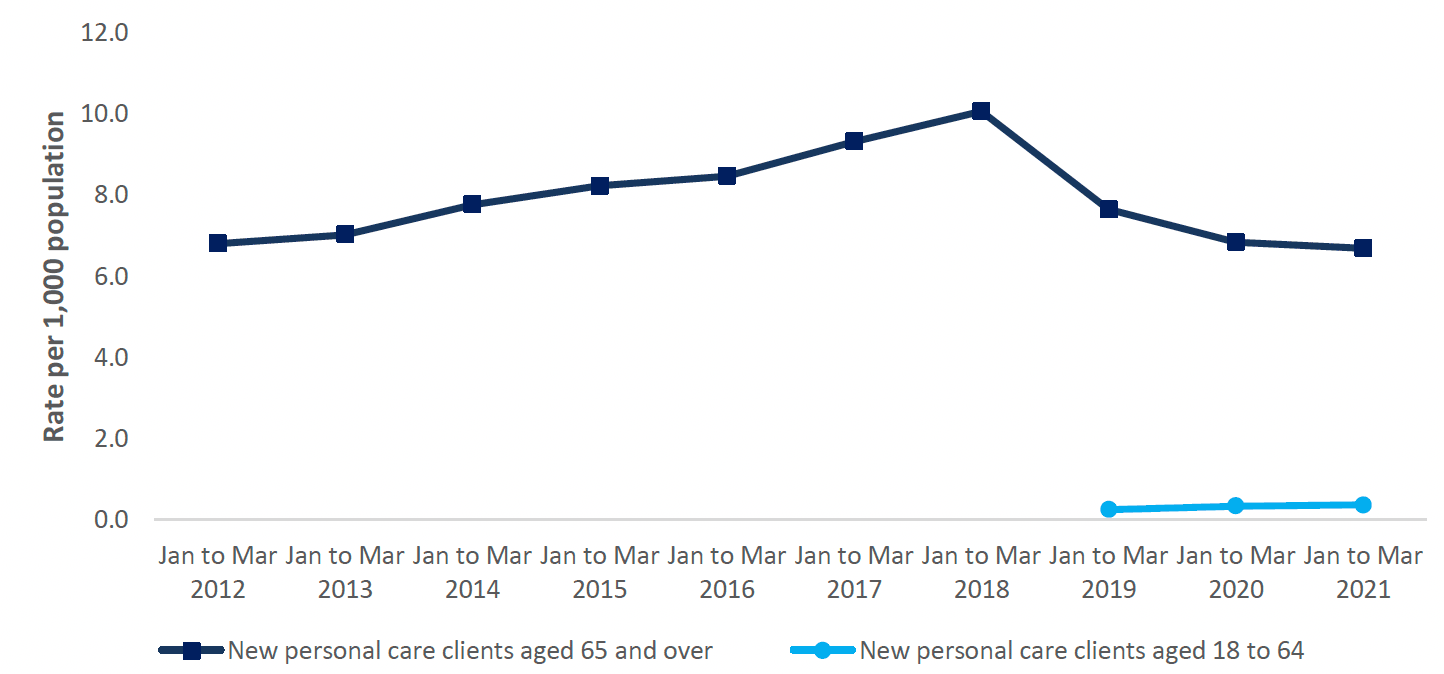
As shown in Figure 2, for the 15 local authorities which submitted data each year on older clients (aged 65 and over), the rate increased from 6.8 per 1,000 population in 2012 to a peak of 10.1 in 2018, before falling back to 6.7 in 2021.
For the 20 local authorities which submitted data on younger clients each year, the rate per 1,000 population was considerably lower than for older people, at less than 1 per 1,000 population, but remained stable from 2019 to 2021.
See accompanying dataset for additional data by local authority.
Source: Scottish Government Quarterly Monitoring Return
Notes:
1. For clients aged 65 and over, 15 local authorities responded every year between 2012 and 2021, and for clients aged 18 to 64, 20 local authorities responded. Please see data completeness in the accompanying dataset for which local authorities are included.
2. Scotland population rate is based on populations from LA's returning data (NRS mid-year population estimates up to 2020).
Contact
Email: SWStat@gov.scot