SME Access To Finance Survey: 2019
This report sets out the findings of the SME Access to Finance Survey 2019.
7. Supply of finance
Summary
- All supply measures showed a significant improvement in the success of SMEs in obtaining finance compared with prior years, indicating credit conditions for SMEs had vastly improved at the time of the survey. Indeed, success rates were higher than pre-financial crisis 2007, suggesting that businesses were more credit-worthy or that lenders' balance sheets had improved.
- The majority of SMEs (87 per cent) who applied for finance were successful in obtaining all the finance they needed. The proportion of SMEs turned down in at least one of their applications, at six per cent, was a quarter of what it was at its peak in 2010. Just two per cent were turned down in each and every application.
- The majority of applications (89 per cent) made by SMEs were successful. The proportion of applications for finance that were rejected, at four per cent, was less than a fifth of what it was in 2010.
- Eight in ten SMEs (79 per cent) received all the finance they sought over the three years prior to the survey and almost all (97 per cent) received all they sought over the 12 months prior to the survey, indicating credit conditions improved further over the year prior to the survey. The proportion that received none of the finance they sought over the 12 months prior, at less than one per cent, had fallen from over half in 2010.
- Somewhat surprisingly, medium-sized and lower-risk businesses were more likely to have experienced rejection. However, lower-risk firms were more likely to receive the full amount of finance sought and medium-sized firms were more likely than average to receive at least some of the finance they sought.
- Rural SMEs were more likely than average to receive the full amount of finance sought, likely driven by the prevalence of the agriculture sector in rural areas, which saw the highest success rates of all the sectors.
- The proportion of SMEs reporting an increase in the cost of credit over the year prior to the survey had halved since 2012 and perceptions of ease of access to finance had improved across all finance types relative to 2012.
While chapter five considered SMEs' demand for finance, this chapter considers the supply side, in terms of the extent to which SMEs were able or unable to obtain the finance they sought both over the three years prior to the survey and, to provide a more recent snapshot, over the 12 months prior to the survey. It examines supply based on four measures, each of which provides different insights as outlined below:
(1) Percentage of firms turned down outright in at least one application for finance over the three years prior the survey: this is the percentage of firms who applied for any type of finance in the three years prior to the survey and were turned down outright in at least one of their applications (base: total number of firms who applied for any kind of finance over the three years prior to the survey).[76]
(2) Percentage of applications that were turned down outright over the three years prior to the survey: this is the percentage of individual applications made by firms in the three years prior to the survey that were turned down outright (base: total number of applications for all facilities made over the three years prior to the survey). This measure takes into account each application made by all firms and the overall percentage of these that were turned down.
(3) Percentage of firms that obtained none of the finance sought over the three years prior to the survey: this measure looks at the overall outcome for all firms that applied for finance over the three years prior to the survey by asking firms, taking into account all their applications for finance in the three years prior to the survey, what percentage of the overall amount they obtained (base: total number of firms who applied for any kind of finance over the three years prior to the survey).
(4) Percentage of firms that obtained none of the finance sought over the 12 months prior to the survey: this measure looks at the overall outcome for all firms that applied for finance over the 12 months prior to the survey by asking whether they obtained all, some, or none of the total amount sought. (base: total number of firms who applied for any kind of finance over the 12 months prior to the survey). This measure provides a more recent snapshot of supply than the other measures.
The results are presented for SMEs as a whole and, where sample sizes permit, for the following sub-groups:[77] size band; risk rating; sector; location (urban/rural); and business type (exporter; high growth firms; and new starts).[78]
This chapter also presents findings on the stage of the application process that SMEs were turned down or offered less finance to gain an understanding of any differences in reporting between the supply measures considered in this report and the approvals rates reported by financial providers. It also considers SMEs' perceptions of how the cost of credit and ease of access to finance had changed over the year prior to the survey.
7.1 Percentage of firms turned down outright in at least one application over the three years prior to the survey[79]
7.1.1 All SMEs
The majority of SMEs (87 per cent) who applied for finance were successful in obtaining all the finance they needed. The proportion of SMEs turned down outright in at least one of their applications, at six per cent, was a quarter of what it was at its peak in 2010, indicating that credit conditions had improved significantly for SMEs. Just two per cent were turned down in each and every application.
It is important to view the percentage of firms who were turned down outright in at least one of their applications in the context of the proportions who were offered exactly what they wanted and offered less than they wanted.
87 per cent of SMEs who applied for finance in the last three years were offered exactly what they wanted for each and every application for finance they made. 13 per cent were offered less or turned down outright in at least one of their applications.
Of that 13 per cent, 10 per cent were offered less in at least one of their applications and 6 per cent were turned down outright in at least one of their applications.[80]
As illustrated in figure 13, the percentage of SMEs turned down outright in at least one of their applications for finance in 2019 was considerably lower than in prior years - lower, even, than before the financial crisis in 2007 - and was four times lower than the peak in 2010.
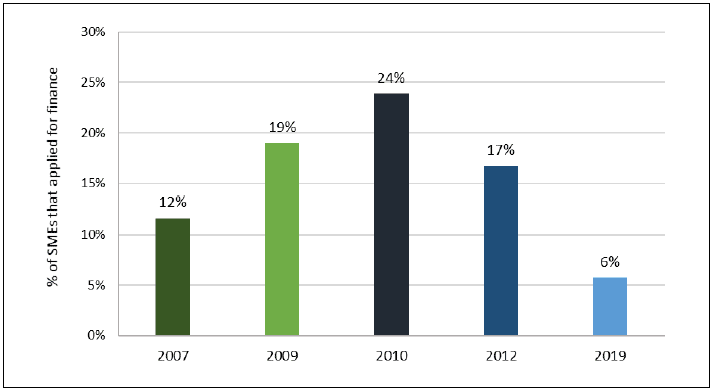
Base: SMEs who applied for finance in the three years prior to the survey. 2007 n=250; 2009 n=631; 2010 n=486; 2012 n= 631; 2019 n=567
Of the 6 per cent of SMEs that were turned down in at least one of their applications for finance, just 2 per cent were turned down for each and every application for finance they made, receiving none of the finance they sought. As illustrated in figure 14, this proportion was considerably lower than in all previous years.
Base: SMEs who applied for finance in the three years prior to the survey. 2007 n=250; 2009 n=631; 2010 n=486; 2012 n= 631; 2019 n=567
Figure 15 illustrates the results by finance type, showing the percentage of SMEs who applied for finance in the past three years that were: turned down outright; offered less than they wanted; and offered exactly what they wanted.
SMEs were less likely to receive all the finance they sought for unsecured loans
The proportion of firms that were turned down outright was broadly similar across the finance types.[81] However, the proportion of firms that were offered less than what they wanted was higher than average for unsecured loans (28 per cent) and lower than average for lease/HP and credit cards (both 3 per cent).
The proportion of firms stating that they were offered exactly what they wanted was broadly similar across most finance types, with the exception of unsecured loans. Just over half (57 per cent) of the business applying for unsecured loans said they were offered exactly what they wanted compared to around nine in ten firms for all other finance types. This makes sense given it is a riskier type of finance for the lender.
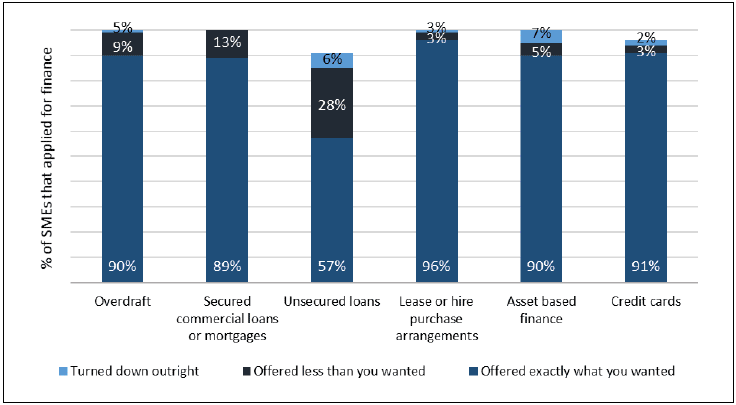
Base: SMEs who applied for finance type in the three years prior to the survey (overdraft n=286; secured loans/mortgages n=56; unsecured loans n=54; lease/HP n=223; asset based n=58; credit cards n=129 (not shown: crowd funding n=2; equity n=9)
7.1.2 Size band
Somewhat surprisingly, medium-sized businesses were more likely to have experienced rejection.
Considering findings by business size band, somewhat surprisingly, medium-sized firms were more likely than average to have experienced at least one instance of rejection at 20 per cent. Medium-sized firms were more likely to apply for finance and to make multiple applications so it may be that within they were therefore more likely to have "marginal" applications rejected.
The proportions of micro and small businesses that were turned down in at least one application were broadly in line with the results for SMEs as a whole, likely due in part to the small sample sizes involved.
7.1.3 Risk rating
Lower risk rated businesses were also more likely to have experienced rejection
Considering findings by the business' risk rating, again somewhat surprisingly, firms with a risk rating of 'minimum' (the lowest risk rating) were more likely than average to have experienced at least one instance of rejection at 14 per cent. As with the findings for medium-sized firms, this seems counter-intuitive. However, as shown in section 7.3.3, the lowest risk rated firms were more likely than average to receive all the finance they sought.
The proportions of businesses with low, average and above average risk ratings that were turned down in at least one application were broadly in line with that for SMEs as a whole, likely due in part to the small sample sizes involved.
It is not possible to provide results by sector, firm type or location for this measure given the low sample sizes involved.
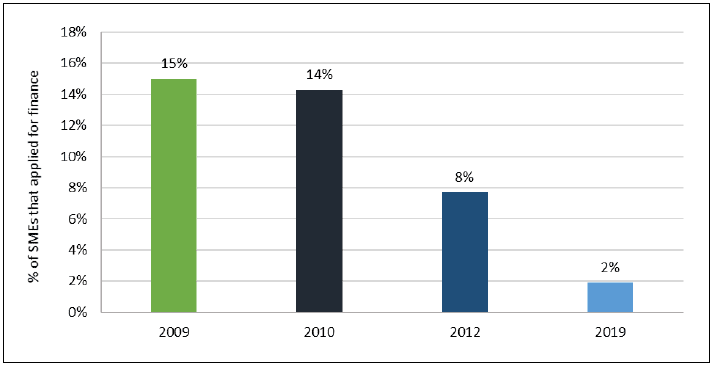
7.2 Percentage of applications that were rejected outright in the three years prior to the survey[83]
7.2.1 All SMEs
The majority of applications for finance (89 per cent) made by SMEs were successful. The proportion of applications for finance that were rejected outright, at four per cent, was less than a fifth of what it was in 2010, again indicating that credit conditions have improved significantly.
In 2019, 89 per cent of applications made for finance in the three years prior to the survey were successful. In eight per cent of applications, SMEs were offered less than the amount of finance they sought and just four per cent of applications were rejected outright. The proportion of applications rejected outright in 2019 was considerably lower than in all previous years and five times lower than at its peak in 2010 (Figure 16).
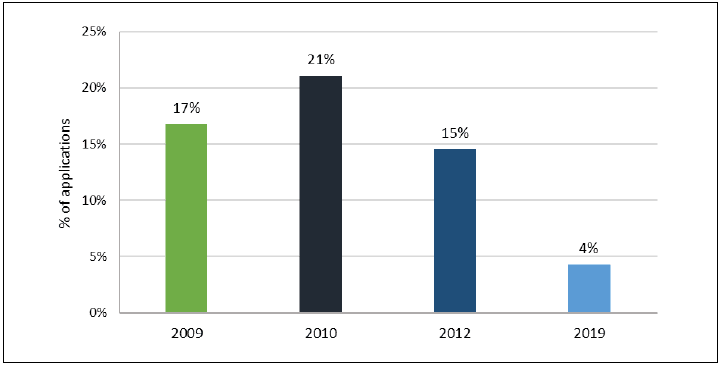
Base: Number of applications for finance over the three years prior to the survey: 2009 n=1290; 2010 n= 904; 2012 n=1268 2019 n=1048
7.2.2 Size band
Medium-sized businesses were more likely to have had an application turned down
In line with the findings for the percentage of firms that were turned down, the application rejection rate for applications made by medium-sized firms was higher than average, at 19 per cent. Again, this seems counter-intuitive.
The proportions of applications made by micro and small businesses that were turned down were broadly in line with the results for SMEs as a whole.
7.2.3 Risk rating
Lower risk rated businesses were more likely to have had an application turned down
In line with the findings for the percentage of firms that were turned down, the application rejection rate for applications made by firms with a risk rating of 'minimum' (the lowest risk rating) was higher than average at 8 per cent. Again, this seems counter-intuitive.
The proportions of applications made by businesses with low, average and above average risk ratings that were turned down were broadly in line with that for SMEs as a whole.
7.2.4 Sector
The manufacturing sector had a higher than average rate of application rejections which had not improved significantly relative to 2010
In 2019, the application rejection rate was higher than average for firms in the manufacturing sector (12 per cent) and lower than average for the construction sector (0 per cent). All other sectors were broadly in line with the average for all firms (Figure 17).
Relative to 2012, the construction, business activities and other services sectors all saw a considerable improvement in the application rejection rate.[84] Relative to 2010, all sectors, with the exception of manufacturing,[85] saw a significant improvement in the application rejection rate.
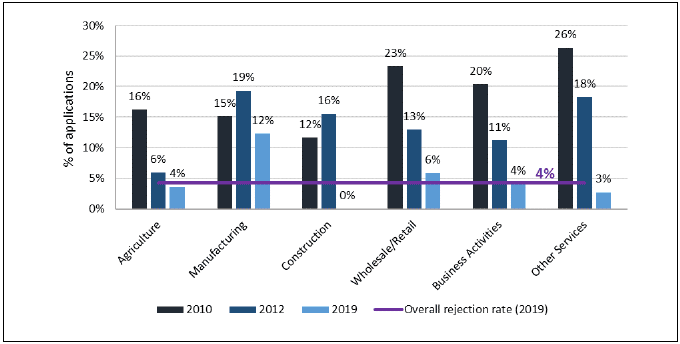
Base: Number of applications for finance made in last three years. 2019: Agriculture n=94; manufacturing n=71; construction n=145; wholesale/retail n=111; business services n=250; other services[86] n=373. 2012: Agriculture n=105; manufacturing n=170; construction n=154; wholesale/retail n=286; business services n=232; other services n=231. 2010: Agriculture n=92; manufacturing n=171; construction n=120; wholesale/retail n=127; business services n=133; other services n=261
7.2.5 Business type
Exporters and new starts saw an improvement in application rejection rates relative to 2010.
In 2019, the application rejection rate for high growth, exporter and new start firms were all broadly in line with the figure for firms as a whole. While the rejection rates for high growth (6 per cent) and new start (7 per cent) firms appear to be higher, the difference with the figure for all firms (4 per cent) is not statistically significant due to the small sample sizes involved (Figure 18).
Relative to 2012, only exporters saw a statistically significant improvement in the application rejection rate.[87] Relative to 2010, both exporters and new starts saw a statistically significant improvement in the application rejection rate.
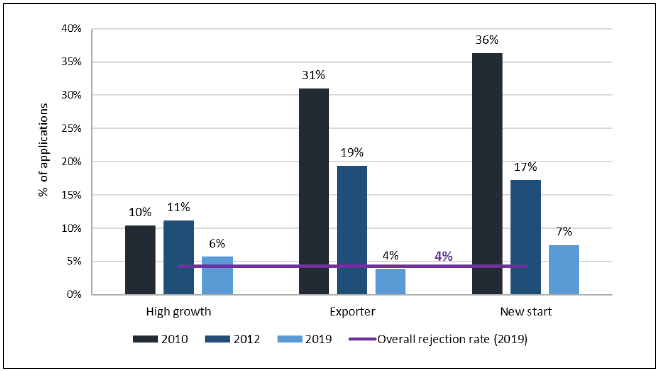
Base: Number of applications for finance made in last three years. 2019: high growth n=80; exporter n=285; new start n=58. 2012: high growth n=73; exporter n=279; new start n=132. 2010: high growth n=96; exporter n=186; new start n=73.
It is not possible to provide results by location for this measure.
7.3 Percentage of firms that obtained none of the finance sought over the three years prior to the survey
7.3.1 All SMEs
Eight in ten SMEs received all the finance they sought over the three years prior to the survey. The proportion that received none of the finance they sought, at one in ten, was a quarter of what it was at its peak in 2009, again indicating a significant improvement in credit conditions.
Considering all the finance they applied for overall in the three years prior to the survey, firms were asked what proportion of the overall amount they obtained on a scale of 0 per cent (none was granted) to 100 per cent (all was granted) (Figure 19).
In 2019, 79 per cent of SMEs who applied for finance in the three years prior to the survey said they received all they sought, higher than the pre-crisis proportion in 2007 (69 per cent). 10 per cent of SMEs who applied for finance stated that they received none (0 per cent) of the finance they sought, considerably lower than the proportion in prior years.[88] 11 per cent said they received some of the finance sought. Of that 11 per cent, 3 per cent said they received 76-99 per cent of the total amount sought, 3 per cent received 51-75 per cent, 2 per cent received 26-50 per cent, 1 per cent received 10-25 per cent and 1 per cent received less than ten per cent.[89]
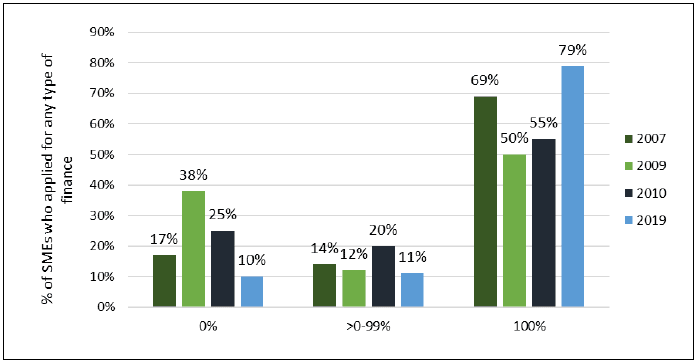
Base: SMEs who applied for finance in the three years prior to the survey. 2007 n=250; 2009 n=631; 2010: n=486, 2019 n=567
7.3.2 Size band
Medium-sized firms were more likely to receive finance while small firms were less likely to receive 100 per cent of the finance sought
Figure 20 illustrates the findings by firm size band. Despite being more likely to have experienced rejection (see sections 7.1.2 and 7.2.2), medium-sized firms were more likely than average to receive at least some finance (more than 0 but less than 100 per cent) of the finance sought. Small firms were less likely than average to receive all of the finance they sought.
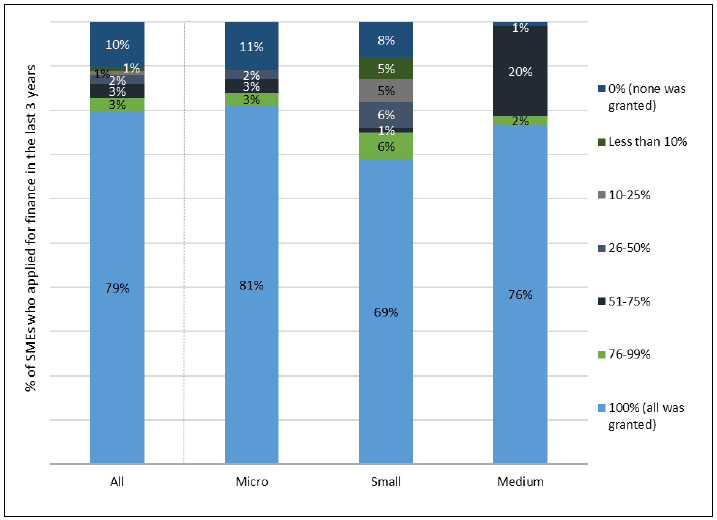
Base: SMEs who applied for finance in the three years prior to the survey. All n=567; micro n=231; small n=252; medium n=84
7.3.3 Risk rating
Lower risk firms were more likely to receive all the finance they sought
Firms with lower risk ratings were more likely to receive all the finance they sought, despite being more likely to have experienced rejection (see sections 7.1.3 and 7.2.3). Firms with a minimum risk rating (the lowest risk rating) were more likely than average to receive all the finance they sought (93 per cent compared to the all firm average of 79 per cent) and less likely to receive none (2 per cent compared to the all firm average of 10 per cent). Firms with an 'average' risk rating were less likely than average to receive all of the finance they sought (69 per cent compared to the all firm average of 79 per cent). The findings for firms with an above average risk rating are not reliable given the low sample size and therefore not shown in figure 21.[90]
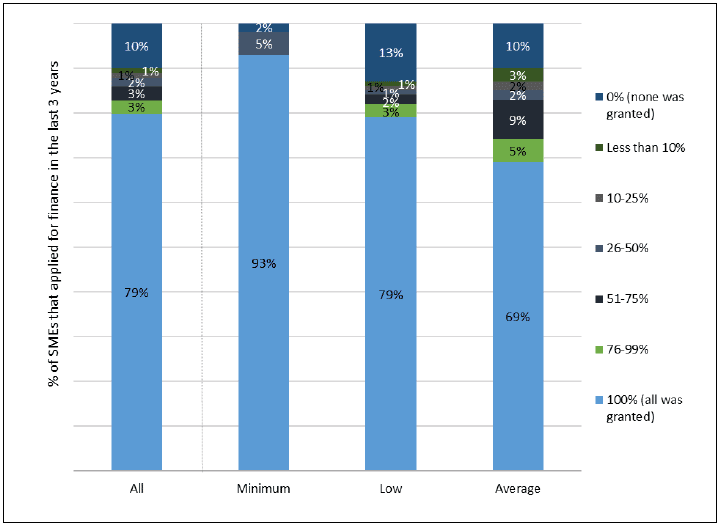
Base: SMEs who applied for finance in the three years prior to the survey. All n=567; minimum n=110 low n=285; average n=114[91]
7.3.4 Sector
The agriculture sector was the most successful in obtaining the full amount of finance sought whilst the construction sector was the least successful
Firms in the agriculture sector were more likely than average to receive the full amount of the finance they sought and less likely to receive nothing (Figure 22). In contrast, firms in the construction sector were significantly more likely than average to receive nothing and less likely than average to receive the full amount of finance they sought.
For all other sectors, the proportion of firms receiving 0% and 100% of the finance sought was broadly in line with the average. This is in part due to the small sample sizes for some sectors which mean that apparent differences between a sector and the average for all SMEs are not statistically significant.
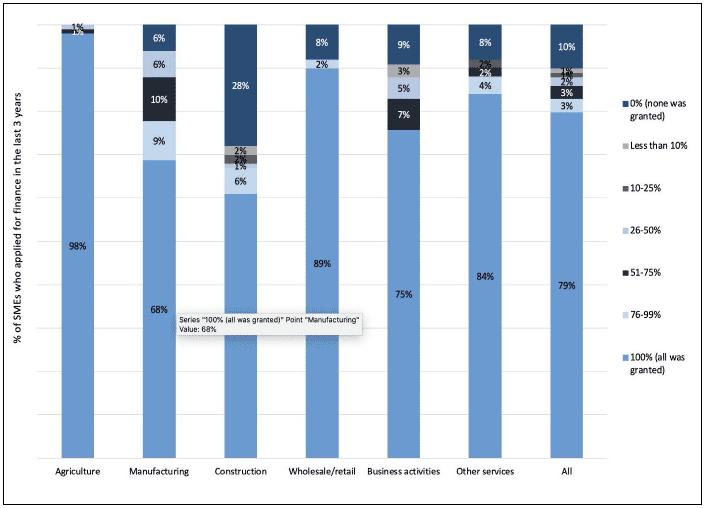
Base: SMEs who applied for finance in the three years prior to the survey. All n=567; agriculture n=46 ; manufacturing n=33 ; construction n=85; wholesale/retail n=66; business activities n=129; other services n=207.
7.3.5 Business type
Exporters were less likely than SMEs as a whole to receive none of the finance they sought
In 2019, exporters were less likely than SMEs as a whole to receive none of the finance they sought.[92] It is not possible to provide reliable results of high growth firms or new starts due to the small sample sizes involved.
7.3.6 Urban/rural location
Rural SMEs were more likely than average to receive the full amount of finance sought, likely driven by the prevalence of the agriculture sector in rural areas, which saw the highest success rates of all the sectors.
Rural SMEs were more likely than average to receive 100 per cent of the finance they sought, at 90 per cent (Figure 23). Just one per cent of rural firms received none of the finance they sought. This reflects the sectoral results where agriculture firms, prevalent in rural areas, saw the highest success rates. The results for urban firms were not statistically significantly different to the all firm average.
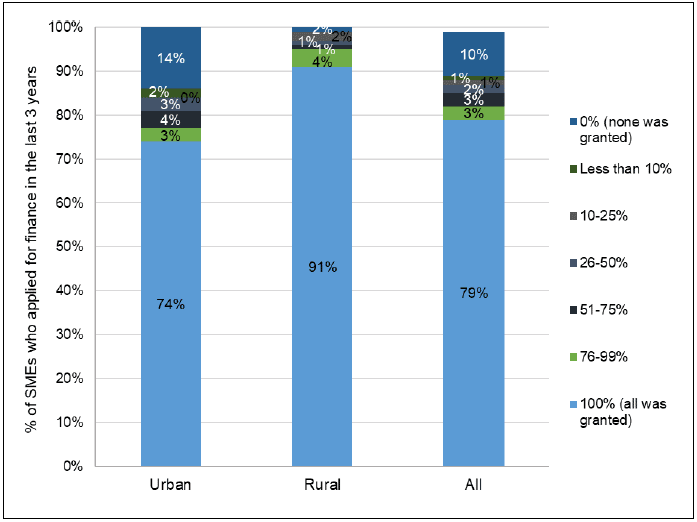
Base: SMEs who applied for finance in the three years prior to the survey. All n=567; urban n=373; rural n=194
7.4 Percentage of firms that obtained none of the finance sought over the 12 months prior to the survey[93]
The three measures of supply considered so far all considered the finance sought by SMEs over the three years prior to the survey. To provide a more recent snapshot of supply conditions, SMEs who had sought new finance over the 12 months prior to the survey were asked whether they obtained all, some or none of the finance they sought over this period.
7.4.1 All SMEs
Almost all (97 per cent) SMEs secured all the finance they sought over the 12 months prior to the survey. The proportion that received none of the finance they sought, at less than one per cent, had fallen from over half in 2010.
97 per cent of SMEs who sought new finance in the last 12 months secured all the finance they sought.[94] The proportion of SMEs that were successful in obtaining all of the finance sought had more than doubled from the proportion in 2010 (41 per cent) (Figure 24). Only two per cent of SMEs seeking new finance secured just some of the finance they sought. Less than one per cent secured none of the finance sought over the 12 months prior to the survey, down from over half of all firms in 2010, again indicating that credit conditions had improved considerably for SMEs over this period.
The proportion of SMEs securing the full amount sought over the 12 months prior to the survey (97 per cent) was higher than that over the three years prior to the survey (79 per cent), suggesting credit conditions improved further over 2019.
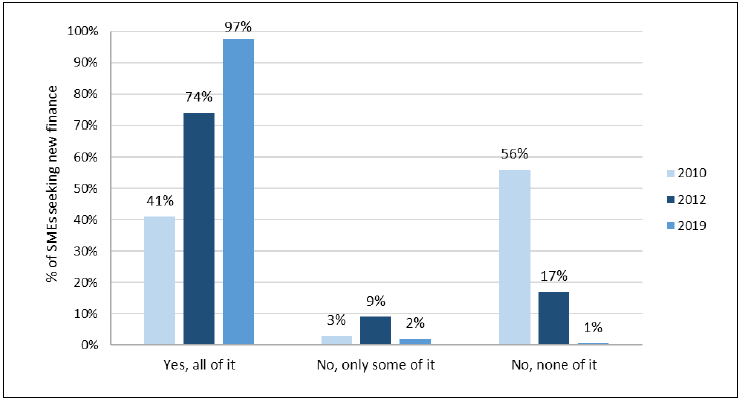
Base: SMEs seeking new finance, 2010 n=103; 2012 n= 168; 2019 n=212
7.5 Stage of rejection in the application process
The measures of supply considered in the previous sections provide a different insight to approval rates reported by financial providers, which tend to be based on formal applications made and therefore do not consider those SMEs who are turned down before this stage. This short section examines the stage of the application process that SMEs that were turned down/offered less to determine the likely extent of any differences in reporting. It is important to note the small sample sizes involved in this question due to the small numbers of firms that were turned down/offered less in 2019.
Nearly half of SMEs who were turned down or offered less in any of their applications for finance were turned down/offered less at the initial stages, before a formal application was made, suggesting a significant amount of unmet demand will not be reflected in financial providers' approval rates. However, given the low proportion of SMEs that were turned down/offered less in 2019, any difference is likely to be minimal.
SMEs who had been rejected/offered less in any of their applications for finance over the three years prior to the survey were asked, for their largest application, at what stage in the process they were turned down/offered less (Figure 25). Nearly half (48 per cent) were turned down/offered less at the initial stages, before a formal application had been made. This was broadly in line with the proportion in 2010 (49 per cent) and 2012 (46 per cent) and suggests a significant proportion of unmet demand will not be reflected in financial providers' approval rates. However, given the low proportion of SMEs that were turned down/offered less in 2019, any difference is likely to be minimal.
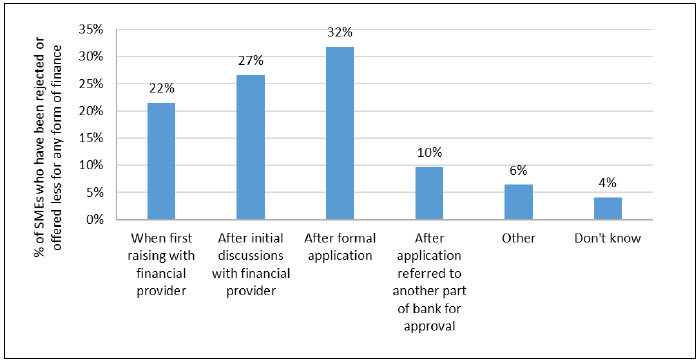
Base: SMEs that were rejected or offered less for any form of finance, n=73
7.6 Costs and ease of access to finance
The proportion of SMEs reporting an increase in the cost of credit had halved since 2012
All SMEs were asked whether they felt there had been an increase in the overall cost of new credit over the 12 months prior to the survey (Figure 26). 16 per cent of SMEs felt the cost of credit had increased, almost half of the proportion in 2012. Almost half of SMEs surveyed in 2019 thought the cost of credit had stayed the same (up from a third of businesses in 2012) while five per cent felt it had decreased.
Those who felt they had seen an increase in the cost of credit (193 businesses) were asked what types of facility they thought had become more expensive. The most commonly cited facility was overdrafts (cited by 56 per cent SMEs who saw an increase in the overall cost of credit), followed by credit cards (33 per cent), secured loans (33 per cent) and unsecured loans (27 per cent).
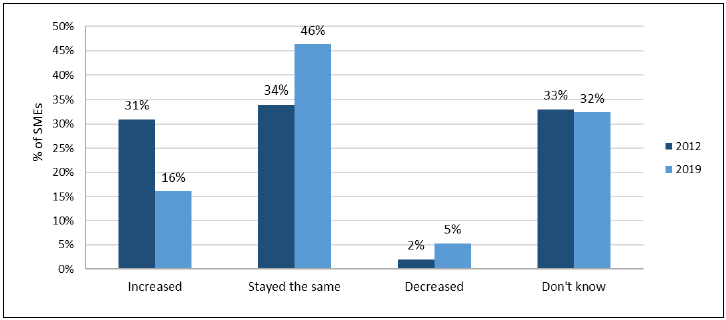
Base: All SMEs, 2012 n=1011; 2019 n=1003
Perceptions of ease of access to finance have improved across all finance types relative to 2012
All SMEs in business for one year or more were asked whether they felt access to each type of finance for their business has stayed the same, become harder or easier compared to a year previously. Across all forms of finance, the proportion reporting that finance was harder to access was less than ten per cent and lower than the proportion in 2012. The finance type with the highest proportion of SMEs reporting that access was harder was grants from public bodies. Compared to 2012, overdrafts and unsecured loans saw the largest drop in the proportion of SMEs that reported access to finance was harder (Figure 27).
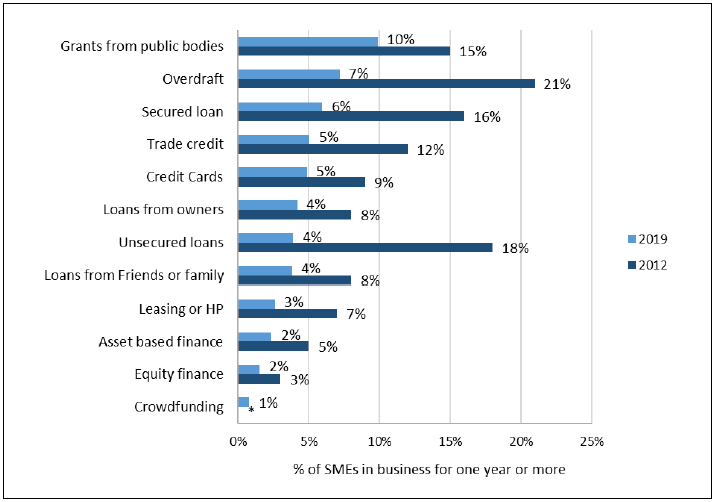
Base: SMEs in business for one year or more, 2012 n=957; 2019 n=947
Contact
Email: industrystatistics@gov.scot